HAL Id: tel-01336218
https://hal.inria.fr/tel-01336218v2
Submitted on 20 Sep 2016
HAL is a multi-disciplinary open access archive for the deposit and dissemination of sci-entific research documents, whether they are pub-lished or not. The documents may come from teaching and research institutions in France or abroad, or from public or private research centers.
L’archive ouverte pluridisciplinaire HAL, est destinée au dépôt et à la diffusion de documents scientifiques de niveau recherche, publiés ou non, émanant des établissements d’enseignement et de recherche français ou étrangers, des laboratoires publics ou privés.
Maksym Gabielkov
To cite this version:
Maksym Gabielkov. How information propagates on Twitter ?. Other [cs.OH]. Université Nice Sophia Antipolis, 2016. English. �NNT : 2016NICE4031�. �tel-01336218v2�
UNIVERSITE NICE SOPHIA ANTIPOLIS
ECOLE DOCTORALE STIC
SCIENCES ET TECHNOLOGIES DE L’INFORMATION ET DE LA COMMUNICATION
THESE
pour l’obtention du grade de
Docteur en Sciences
de l’Université Nice Sophia Antipolis
Mention : Informatique
présentée et soutenue par
Maksym Gabielkov
Comment se propagent les
informations sur Twitter ?
Thèse dirigée par Arnaud Legout
et préparé au sein du laboratoire Inria, équipe DIANA
soutenue le 15 juin 2016Jury :
Directeur : Arnaud Legout - Inria (DIANA) Rapporteurs : Ashish Goel - Université Stanford
Krishna Gummadi - MPI-SWS
President : Guillaume Urvoy-Keller - Université Nice Sophia Antipolis Examinateurs : Laurent Massoulié - Centre de Recherche Commun
Inria - Microsoft Research Laurent Viennot - Inria (GANG)
Comment se propagent les informations sur Twitter ?
Résumé: Cette thèse présente une étude sur la mesure des réseaux sociaux en ligne avec un accent particulier sur Twitter qui est l’un des plus grands réseaux sociaux. Twitter utilise exclusivement des liens dirigés entre les comptes. Cela rend le graphe social de Twitter beaucoup plus proche que Facebook du graphe social représentant les communications dans la vie réelle. Par conséquent, la compréhension de la structure du graphe social Twitter et de la manière dont les informations se propagent dans le graph est intéressant non seulement pour les informaticiens, mais aussi pour les chercheurs dans d’autres domaines, tels que la sociologie. Cependant, on sait peu de choses sur la propagation de l’information sur Twitter. Dans la première partie, nous présentons une étude approfondie de la structure macro-scopique du graphe social de Twitter dévoilant les routes sur lesquelles les tweets se propagent. Pour cette étude, nous avons crawlé Twitter pour récupérer tous les comptes et toutes les relations sociales (liens de following et follower) entre les comptes. Nous présentons une méthodologie pour dévoiler la structure macroscopique du graphe social de Twitter qui se compose de 8 composants définis par leurs caractéristiques de connectivité. Nous avons dé-couvert que chaque composant regroupe les utilisateurs avec un usage spécifique de Twitter. Enfin, nous présentons une méthode pour explorer la structure macroscopique du graphe so-cial de Twitter dans le passé, nous validons cette méthode en utilisant des anciens ensembles de données, et nous discutons l’évolution de la structure macroscopique du graphe social de Twitter durant les 6 dernières années.
Dans la deuxième partie, nous étudions la propagation de l’information sur Twitter en étudiant les articles de presse partagés sur Twitter. Les médias en ligne comptent de plus en plus sur les médias sociaux pour générer du trafic vers leur site Web. Pourtant, nous savons étonnamment peu de choses sur la façon dont les conversations sur les médias sociaux mentionnant un article en ligne génèrent un clic “social” vers cet article. Nous présentons une étude validée et reproductible des clics sociaux en collectant un mois de clics vers des articles mentionnés dans Twitter vers 5 grands journaux en ligne. Nous montrons que les clics et les clics par follower impactent plusieurs aspects de la diffusion de l’information, tous jusque-là inconnus. Par exemple, les ressources secondaires (non promues dans les gros titres des jour-naux) génèrent plus de clics que les gros titres. De plus, alors que l’attention des utilisateurs des médias sociaux est courte en ce qui concerne les postes, elle est étonnamment longue lorsque l’on regarde les clics. Pour finir, on montre que l’influence réelle d’un intermédiaire ou d’une ressource est mal prédite par le comportement d’envoi, et nous montrons comment cette prédiction peut être rendu plus précise.
Dans la troisième partie, nous présentons une étude expérimentale d’échantillonnage du graphe social de Twitter. Les réseaux sociaux en ligne (RSL) sont une source importante d’information pour les scientifiques dans différents domaines tels que l’informatique, la sociologie, ou l’économie. Cependant, il est difficile d’étudier les RSL car ils sont très grands. En outre, les entreprises prennent des mesures pour prévenir les analyses de leurs RSL et s’abstiennent de partager leurs données avec la communauté des chercheurs. Pour ces raisons, nous affirmons que les techniques d’échantillonnage sont une option efficace pour étudier les RSL à l’avenir. Dans cette dernière partie, nous prenons une approche expérimentale pour étudier les caractéristiques des techniques d’échantillonnage bien connues sur un graphe social complet de Twitter nous avons crawlé en 2012.
Mots clé: Twitter, réseaux sociaux, propagation de l’information, analyse de graphes, clics sociaux, échantillonnage de graphes
How Information Propagates on Twitter?
Abstract: This thesis presents the measurement study of Online Social Networks focusing on Twitter. Twitter is one of the largest social networks using exclusively directed links among accounts. This makes the Twitter social graph much closer to the social graph supporting real life communications than, for instance, Facebook. Therefore, understanding the structure of the Twitter social graph and the way information propagates through it is interesting not only for computer scientists, but also for researchers in other fields, such as sociologists. However, little is known about the information propagation in Twitter.
In the first part, we present an in-depth study of the macroscopic structure of the Twitter social graph unveiling the highways on which tweets propagate. For this study, we crawled Twitter to retrieve all accounts and all social relationships (follow links) among accounts. We present a methodology to unveil the macroscopic structure of the Twitter social graph that consists of 8 components defined by their connectivity characteristics. We found that each component group users with a specific usage of Twitter. Finally, we present a method to approximate the macroscopic structure of the Twitter social graph in the past, validate this method using old datasets, and discuss the evolution of the macroscopic structure of the Twitter social graph during the past 6 years.
In the second part, we study the information propagation in Twitter by looking at the news media articles shared on Twitter. Online news domains increasingly rely on social media to drive traffic to their websites. Yet we know surprisingly little about how social media conversation mentioning an online article actually generates a click to it. We present a large scale, validated and reproducible study of social clicks by gathering a month of web visits to online resources that are located in 5 leading news domains and that are mentioned in Twitter. As we prove, properties of clicks and social media Click-Per-Follower rate impact multiple aspects of information diffusion, all previously unknown. Secondary resources, that are not promoted through headlines and are responsible for the long tail of content popularity, generate more clicks both in absolute and relative terms. Social media attention is actually long-lived, in contrast with temporal evolution estimated from posts or receptions. The actual influence of an intermediary or a resource is poorly predicted by their posting behavior, but we show how that prediction can be made more precise.
In the third part we present an experimental study of graph sampling. Online social networks (OSNs) are an important source of information for scientists in different fields such as computer science, sociology, economics, etc. However, it is hard to study OSNs as they are very large. Also, companies take measures to prevent crawls of their OSNs and refrain from sharing their data with the research community. For these reasons, we argue that sampling techniques will be the best technique to study OSNs in the future. In this part, we take an experimental approach to study the characteristics of well-known sampling techniques on a full social graph of Twitter we crawled in 2012.
Keywords: Twitter, social networks, information propagation, graph analysis, social clicks, graph sampling
Contents
1 Introduction 1
1.1 Why Study OSNs? . . . 2
1.2 Why Twitter? . . . 3
1.3 Challenges and Contributions . . . 4
1.3.1 Social Graph Structure. . . 5
1.3.2 Information Propagation . . . 6
1.3.3 Graph Sampling . . . 8
1.4 Thesis Outline . . . 10
2 Related work 11 3 Twitter Social Graph 15 3.1 Motivation. . . 16
3.2 Measuring Twitter at Scale . . . 17
3.2.1 Crawling Methodology . . . 17
3.2.2 Limitations of the Crawl . . . 18
3.2.3 Measured Twitter Social Graph . . . 19
3.2.4 Ethical Issues . . . 20
3.3 Graph Analysis Methodology . . . 20
3.4 The Macrostructure of Twitter in July 2012 . . . 22
3.4.1 LSC Component . . . 24 3.4.2 OUT Component . . . 27 3.4.3 IN Component . . . 29 3.4.4 DISCONNECTED Component . . . 31 3.4.5 Other Components . . . 32 3.4.6 Discussion . . . 32
3.5 Evolution of the Macrostructure of the Twitter Social Graph with Time . . . 32
3.5.1 Methodology to Estimate the Macrostructure . . . 32
3.5.2 Evolution of the Macrostructure . . . 34
3.5.3 Distribution of New Accounts in Components . . . 36
3.6 Related Work . . . 37
3.7 Discussion . . . 37
3.8 Acknowledgements . . . 38
4 Social Clicks 39 4.1 Motivation. . . 40
4.2 Measuring Social Media Clicks . . . 42
4.2.1 Obtaining Raw Data & Terminology . . . 42
4.2.2 Ensuring Users’ Privacy . . . 44
4.2.3 Selection Bias and a Validated Correction . . . 45
4.3 Long Tail & Social Media . . . 49
4.3.1 Background . . . 49
4.3.2 Traditional vs. Social Media Curation . . . 50
4.3.3 Blockbusters and the Share Button . . . 52
4.4 Social Media Attention Span . . . 54
4.4.1 Background . . . 54
4.4.2 Contrast of Shares and Clicks Dynamics . . . 55
4.4.3 Dynamics & Long Tail . . . 55
4.5 Click-Producing Influence . . . 56
4.5.1 Background . . . 56
4.5.2 A New Metric and its Validation . . . 57
4.5.3 Influence and Click Prediction. . . 58
4.6 Conclusion. . . 59
4.7 Acknowledgments . . . 59
5 Sampling Twitter 63 5.1 Motivation. . . 63
5.2 Sampling Techniques . . . 64
5.3 Practical Cost of Crawling the Graph. . . 66
5.4 Estimation of User Activity . . . 68
5.5 Estimation of the Distribution . . . 69
5.6 Discussion . . . 69
5.7 Future Work . . . 70
5.7.1 What’s the bias of my sample? . . . 70
5.7.2 Is Twitter dying? . . . 70
6 Conclusion 73 A Résumé des travaux de thèse 75 A.1 Introduction . . . 75
A.1.1 Pourquoi étudier les RSL? . . . 76
A.1.2 Pourquoi Twitter? . . . 77
A.1.3 Défis et contributions . . . 79
A.1.4 Structure de la thèse . . . 85
A.2 Graphe social de Twitter . . . 85
A.3 Clics sociaux . . . 87
A.4 Échantillonnage de Twitter . . . 89
A.5 Conclusion. . . 90
Chapter 1
Introduction
Social network can be defined as a set of social entities (e.g., individuals, groups, organiza-tions, etc.) connected among each other with different types of relationships. The analysis of social networks is an interdisciplinary academic field at the intersection of sociology, psy-chology, mathematics and computer science.
The idea of social networks has its roots in the works of two sociologists, Émile Durkheim and Ferdinand Tönnies, published in early 1890s. These works on social groups foreshadowed the idea of social networks. Throughout the 20th century there have been major developments by several groups of scientists in different fields working independently. At that time the systematic recording and analysis of social interactions were performed on small groups, e.g., work groups or classrooms, due to the natural difficulty of doing large scientific studies with real people. By the 1970s, different tracks and traditions of social network analysis were combined together. In 1969 Travers and Milgram [Travers 1969] set up their well-known experiment in which they asked 196 arbitrarily chosen individuals in Nebraska and Boston to deliver a letter to a target person in Massachusetts via an acquaintance chain. This experiment was groundbreaking as it has suggested that human society is a small-world network with a short path-length, the mean number of intermediary between the starts and the target was 5.2. It played an important role in the development of the concept of “six degrees of separation” that suggests that every person in the world is six or less steps away from any other person. This concept was highly popularized not only in academia, but also in popular culture.
Due to the fast development of the Internet in the late 1990s, online social networks (OSNs) emerged. OSN, also known as social-networking site, is an Internet-based service that allows individuals to (a) create a public or semi-public profile in the service, (b) es-tablish relationships with other users of the service, (c) view all or some of the relationship between other users. The functionality of the service may also include the ability to exchange messages, multimedia content or express reactions, but these features may vary from one OSN to another.
In 1997 the first social-networking site SixDegrees.com was launched. SixDegrees was
ahead of its time, users didn’t know what to after registering and connecting to their friends (the service got closed in 2013). Starting from 2003 many OSNs were launched, and so-cial networking in the Internet became mainstream (see survey on soso-cial networking sites [Boyd 2007]). Nowadays OSNs can be split into two categories, general and specialized1. Notable examples of general purpose OSNs are Facebook, Twitter and Google+. Popu-lar specialized OSNs include Instagram.com (focuses on sharing photos and videos) and LinkedIn.com (focuses of professional and business networking). The popularity of
social-networking sites varies with time and geographical region. For instance, due to government
1
regulations, multiple websites such as Facebook, Twitter, and Google+ are unavailable on the territory of China, which led to the development of local social-networking sites such as Qzone, RenRen, and Sina Weibo. Another example is a general purpose OSNVK.comwhich
is popular in post-Soviet republics.
General purpose OSNs are normally used to keep in touch with offline friend and not to establish new relationships. It implies that we can see OSNs as a model of social relationships of an individual. We can conclude that OSNs do not only facilitate communications between their users, but also create a valuable source of information for researchers and business. With the help of OSNs researchers can make studies of planetary scale.
1.1
Why Study OSNs?
With the number of registered users in OSNs reaching billions, it is hard to deny that OSNs are playing an important role in lives of people. In the following, we outline the reasons why we believe OSNs should be studied.
Traffic analysis. According to various sources, traffic from social networks is responsible for 30% of all referral traffic to the content published online (see Section4.1). However, little is known about how this traffic is formed. Advertising on the Internet is the major income for many companies such as Google, Facebook, Twitter2. Moreover it is one of the ways to keep the content freely accessible for such online resources as news media. Studying the traffic originating from the OSNs is crucial for the business relying on the revenue from advertising.
Public opinion measurement. Internet is becoming widespread, according to the esti-mates in 2014, 40% of the world population is using internet3, making it one of the best way to know the opinion of the people on events such as political elections or product releases. OSNs are a valuable source of information for business analysts and researchers, but it can also impact of the financial market. For example, a single tweet can cause major fluctuation on the stock market4.
Recommender systems have become extremely common in recent years, they are used to suggest products to the consumer based on their interest. Previous studies show that users who have relationship in OSNs are more likely to share interests [Zhang 2014], e.g., in movie or music genres. Thus, exploiting data from OSNs can improve search results or the quality of recommendations. Also it can be used to improve connectivity in peer-to-peer systems by creating additional connection between the users having social ties on OSNs [Zhang 2014].
Social trust and spam. In the modern world the amount of information people receive every day is huge and keeps increasing, however it is hard to know which information is trustworthy and which is not. Another closely related topic is spam detection. While it is hard to understand from the content of a particular message if it is unsolicited,
2 http://www.statista.com/statistics/460687/digital-ad-revenue-select-companies/ 3 https://en.wikipedia.org/wiki/Global_Internet_usage 4 http://j.mp/20P5vUc
1.2. Why Twitter? 3 undesired or apocryphal, we can benefit from the knowledge of user’s social ties, e.g., by considering the content originating from the “friends” on OSNs more trustworthy. Modeling systems. Many parameters such as popularity distributions emerge from people
behavior. These parameters can be revealed by measuring the OSNs and can be used for modeling. For example, the data about the number of followers on Twitter can be used to model the popularity distribution for information-centric networks.
1.2
Why Twitter?
In this thesis, we chose Twitter as a case study. Twitter is a micro-blogging service that allows its users to send short messages (tweets) of up to 140 characters, also users can subscribe for the messages of others. The main Twitter page of a registered user is called a “timeline”, it shows the list of tweets of the people the user is subscribed to in a reverse chronological order.
Twitter was launched in 2006 and has now more than 332 million active users (as of Jan-uary 2016), making it the third largest OSNs in the world. While Twitter is not the most popular OSN, it has some features that make it different from other OSNs and more inter-esting to study from the research point of view; these features as described in the following. Earliest OSNs allowed their users to create “friendship” relationships among their users. “Friendship” requires a confirmation from both parties of the relationship and is implemented as a major type of relationship in OSNs such as SixDegrees, Facebook or LinkedIn. However friendship is not the only type of social relationship we encounter in the world. In a tradi-tional setting, when people watch TV or read newspapers, they are normally interested in the content, however the publisher of the newspaper or the producer of the TV program has no direct way to communicate with people consuming the product. This publisher-subscriber relationship can be modeled by introducing a “follow” relationship when a user can follow another user to receive their updates without the confirmation of the latter. ‘Follow’-like relationships in OSNs were first introduced on LiveJournal in 1999, but the terms ‘follow’ and ‘follower’ are more known in the context of Twitter. The concept of such unidirectional relationship is much more flexible, because it can both model a publisher-subscriber relation-ship, e.g., when a user follows a celebrity, and a friendship relationrelation-ship, e.g., when two users follow each other. That is why we believe Twitter is one of the best sources of information about social relationship among people.
Another interesting feature of Twitter is the limitation of 140 characters on the length of the post. Initially introduced for compatibility with SMS messaging, the 140-character limit played a huge role in forming the culture of Twitter. Due to the short nature of tweets, Twitter is used to send updates to people. That is why Twitter is widely used during natural disasters or public gatherings to connect people and serve as an additional communication channel. We can say that Twitter became the word-of-mouth of the Internet. We believe that a short message is a better representation of what is on the people’s mind than a multipage opus on Facebook, short tweets give us the opportunity to observe the instant reaction of people to the events.
Also, this limit increased the usage of URL shorteners such asgoo.glandbit.lyso that
of shorteners on Twitter opens unprecedented possibilities of studying content dissemination though Twitter as URL shorteners provide the detailed statistics on the actual number of clicks made on the URLs (see Chapter 4).
Given the constrained length of the tweet, Twitter users developed a series of conventions that allow users to add structure to their tweets [Boyd 2010]. These conventions emerged from the Twitter crowd and got so popular that they were implemented as features of Twitter. Mentions. Users began to use the @username syntax to mention or to address specific users
in their tweets. Now users get notified if they are mentioned in some conversation. Re-tweets. To repost a message of another Twitter user to their followers, a user may copy
the content of the message and post it with preceding RT @username or via @username. Now it is implemented as a re-tweet button.
Hashtags. Users can group messages together by topic or type using a hashtag, that is a word prefixed with a “#” sign. A click on a hashtag gives the messages containing this hashtag in a reverse chronological order.
All these conventions do not only help users to better navigate through Twitter, but also provide researchers and analysts an easier way to interpret the information without involving heavy natural language processing tools. Also, in late 2009, Twitter lists were introduced, allowing users to create and follow ad hoc lists of authors instead of individual authors.
In July 2015, Twitter has extended the limit for the private messages to 10,000 characters. Later, in January 2016, Jack Dorsey (current CEO of Twitter) revealed that Twitter is planning to expand the character limit for tweets as well; this limit would also be 10,000 characters, however users will be required to click to see anything beyond 140 characters. He said that while Twitter would “never lose that feeling” of speed, users could do more with the text.
Twitter does not impose real-name policy on its users. On the one hand, it implies more freedom of expression. Some OSNs, e.g., SixDegees.com, lost many users after introducing the real-name policy and suspending the accounts that did not look real. Also, it is important to remain anonymous when the conversations touch topics such as politics, or when disclo-sure of the information can cause harm to the sender. On the other hand, it creates more opportunities for spammers and opinion manipulation, which is an interesting research topic of its own.
1.3
Challenges and Contributions
In this section, we describe the approach we took in the analysis of Twitter, the challenges we faced, and the contributions we made. Our analysis consists of three steps. (i) we want to understand the medium where information propagates, that is the Twitter social graph. (ii) we study the information propagation in Twitter focusing on news media articles. (iii) we study the problem of using graph sampling for estimation of various metrics when access to the data is constrained.
1.3. Challenges and Contributions 5
1.3.1 Social Graph Structure
To understand information propagation in Twitter, we first need to understand the structure of the medium where it propagates. In Twitter this medium is the social graph that has users as vertices and follow relationships as directed edges (arcs). Information can propagate in this graph from a user to his followers, then it may be retweeted and reach the followers of the followers of a user, etc. While the will of users to retweet something strongly depends on the content and the users themselves, there is no doubt that there is no way for information to flow between the users that are disconnected in the social graph. We can say that the structure of the social graph constraints the information propagation, and naturally a first step in understanding how information propagates on Twitter is to study the structure of its social graph. We faced the following challenges during this study.
1.3.1.1 Challenges
Data collection. To analyse the structure of the Twitter social graph, we first need to crawl the graph. Twitter does not provide access to its social graph, moreover they use a distributed infrastructure to support the operation of Twitter, and even with a full access to this infrastructure, it would be quite challenging to extract the social graph.
The most reliable way to get the data is the Twitter application programming interface (API). However, access to this API is subject to strict rate-limits, at the lime we collected the data (2012) this rate-limits were applied per IP address. We had to implement a distributed crawler that was using 550 machines spread across the globe. It took us 4 month to collect the complete Twitter social graph, details are presented in Section 3.2.
Data processing. Another challenge is to process the data of a big size, the graph we collected consists of 537 million users and 24 billion arcs and requires 74GB of RAM to be stored in the format of an adjacency list.
We have tested multiple state of the art tools including Hadoop5, NetworkX6, SNAP7, and GraphChi [Kyrola 2012]. Map-reduce (Hadoop) and vertex-centric approaches (GraphChi) showed to be inefficient in performing breadth-first-search (BFS) that is essential for com-putation of strongly connected components (SCCs). NetworkX and SNAP appeared to be unusable for large graphs or graphs with high degree nodes. At first, we developed our own solution that made the computations on the graph in a divide-and-conquer manner, e.g., we split the Twitter social graph into chunks that fit into RAM, computed the SCCs in each chunk, then merged the results. Afterwards, when we gained access to machines with more RAM, we used a combination of Python with a module written in C that stored the graph in memory. It helps us avoid the Python memory overhead while preserving the advantage of Python in terms of fast implementation and efficient data manipulation8.
5 http://hadoop.apache.org/ 6 https://networkx.github.io/ 7 http://snap.stanford.edu/ 8
Python is great tool for fast development, however it has overhead in term of CPU utilization and in terms of memory consumption (in Python everything is represented as objects that have headers, e.g., one integer requires at least 12 bytes in memory, whereas in C it would be 4 bytes).
Interpretation of the results. We have computed various statistics on the Twitter social graph, e.g., distribution of degrees, weakly connected components, SCCs, and we have designed and applied the generalized version of the graph decomposition of Broder et al. [Broder 2000]. We obtained the graph decomposition in 8 components and we sought the physical meaning of those components. This step required the computation of numerous metrics per component together with manual inspection of user accounts belonging to dif-ferent components, which is time consuming. The results of these activities are presented in Section3.4.
1.3.1.2 Contributions
We have collected a large scale dataset on the Twitter social graph in 2012 that may be the last dataset of such scale. We went through an ethical process and shared an anonymized version of our dataset9 that was IRB approved. As of April 2016, we got 32 access requests from researchers all over the world, 18 of which signed the license agreement and obtained the dataset for various purposes including studying unbiased sampling, graph generation, influence propagation, node credibility, testing graph processing software (e.g., graph parti-tioning problem for Apache Spark10) or algorithms (e.g., personalized PageRank, community detection, or graph diameter estimation).
We improved and applied the decomposition methodology of Broder et al. [Broder 2000] to the Twitter social graph, which allowed us to map different components of the decomposition to different types of users, hence, to see how Twitter is used today (see Section 3.4) and to observe the evolution of Twitter usage with time (see Section3.5).
1.3.2 Information Propagation
We studied the information propagation focusing on news media URL dissemination on Twit-ter. According to Mitchell et al. [Mitchell 2014], more than half of American adults are using OSNs as their primary source of political news. Also, these are two technical reasons why we chose news media URLs. First, URLs are easy to track because they have a particular syntax, also news media URLs point to a reputable content that was prepared by the publishers and categorized. Second, we can use the number of clicks on those URLs to externally assess their popularity. During this analysis we faced the following challenges.
1.3.2.1 Challenges
Data collection. The daily volume of tweets is measured in hundreds of millions. It is practically impossible for a person outside Twitter, Inc. to obtain the full data on these tweets. However, we can build a methodology combining different endpoints of the Twitter API to obtain a consistent sample of data. For example, we used the 1% sample of tweets, provided by Twitter without subscription fees, together with the search API of Twitter.
Twitter can give us information about who shared what and when, but it cannot tell us exactly who saw this information on Twitter. We can approximate the number of people who saw it by estimating the number of receptions, e.g., by summing up the numbers of followers
9
http://j.mp/soTweet 10
1.3. Challenges and Contributions 7 of people who shared the information (we call them posters). This approximation is quite naive because it doesn’t take into account the overlap between the followers of the posters, and we have no way to validate that people actually saw the information in their Twitter timeline; they may not be checking their timeline regularly or the amount of information in it is overwhelming. Luckily, there is a way to know if a particular news media article shared on Twitter engaged users. We monitored the 1% sample of tweets and discovered that from 70% to 90% of news media URLs are shortened using services such asbit.ly, that provides an
API to retrieve the statistics on the number of clicks made on its shortened URLs. Moreover, we can distinguish between clicks originating from Twitter and clicks coming from other websites by looking at the referrer. More details on the data collection process can be found in Section 4.2.1.
We are the first ones to combine data on sharing behavior of users and their clicking behavior; these data unveils multiple aspects of information propagation, all previously un-known (see Chapter4).
Bias correction. Due to the fact that our data is incomplete, we face the danger of intro-ducing multiple biases in our data. For example, we use the 1% random sample of tweets to discover news media URLs. This sample yields a random subset of tweets, but in terms of URLs we are highly biased towards popular ones. The same URL may be contained in multi-ple tweets; if we sammulti-ple tweets at a constant rate of 1%, URL shared on Twitter once has 1% of chance to appear in our dataset, whereas a URL shared 100 times has 1−(1−0.1)100 ≈ 63%
of chance to appear in the dataset. We cannot recover the URLs we missed, but we can cor-rect the statistics in our study by giving more weight to unpopular URLs. Note that without the correction of this bias, we would observe strikingly different results. There is also a bias in the estimation of the number of receptions that we mentioned in the previous paragraph. More details are presented in Section4.2.3.
User influence analysis. Another question we want to study is the influence of users who share content on Twitter. We can do that by looking at how good they are in posting popular content. However, we don’t have the attribution between the users who share some content and the clicks made on this content; we only have the number of clicks per contents, which is good from a privacy point of view, but harmful in our research. We take an approach of accessing the user influence by looking at the success of content they participated in sharing. We were able to validate our approach on a subset of users in our dataset, more on that in Section4.5.2.
1.3.2.2 Contributions
We present a large scale, unbiased study of news articles shared on Twitter. We gathered a month of web visits to online resources that are located in 5 leading news domains and that are mentioned in Twitter. That is the first data that combines sharing activities with clicks. Our dataset amounts to 2.8 million shares, together responsible for 75 billion potential views on this social media, and 9.6 million actual clicks to 59,088 unique resources. We design a reproducible methodology and carefully correct its biases. We are planing to share our
dataset with the research community after it gets IRB approved (details will be available at
http://j.mp/soTweet).
The analysis of sharing activities together with clicks revealed multiple aspects of infor-mation diffusion, all previously unknown. First, news media article that are not promoted through headlines and are responsible for the long tail of content popularity, generate more clicks both in absolute and relative terms. Second, social media attention is actually long-lived, in contrast with temporal evolution estimated from shares or receptions. Third, the actual influence of a user or an article is poorly predicted by their share count, which is unreasonably used nowadays as a metric of impact in online resources.
1.3.3 Graph Sampling
We studied the problem of social graph sampling. We have collected the complete social graph of Twitter in 2012; soon after our crawl was completed, Twitter introduced a new version of the Twitter API with mandatory authentication for each request. The rate-limit in the new API is applied per user, whereas before it was applied per IP address. The new API made the crawl of the Twitter social graph much harder because it is much harder to create user accounts than use multiple IP addresses (e.g., by using PlanetLab, or other distributed platform). Moreover, automated creation of multiple user and app accounts violates the Twitter terms of use and all accounts created can be suspended.
We believe that our 2012 dataset is the last crawl of Twitter of such scale. Companies managing the OSNs are introducing measures to prevent large-scale crawls of their data because nowadays information is a valuable resource for business. That is why we believe that the only way to do social network measurements, except in case of direct collaboration with an OSN provider, is to use sampling.
However, inconsiderate use of sampling may be harmful. For example, when one decides to use BFS to make a complete crawl of the graph, one assumes that the graph has a giant connected component (that can be reached with BFS) and the remaining components are of negligible size. Depending on the goal of the study it can lead to incorrect results, e.g., we discovered that 20% of the Twitter accounts are disconnected, also if one used only one direction of the links on Twitter to make the crawl, they would miss 25% to 50% of the graph. Also, the result of such a crawl would highly depend on the source to start the BFS from, which is often made blindly.
Another problem appears when one use random walk (RW) to make a measurement of the graph. Most of the theory behind RW assumes that the graph is connected and has a fast mixing property. However, this property has never been validated on real social graphs. We aim to study the properties of well-known sampling techniques (e.g., BFS, RW) on the complete social graph of Twitter collected in 2012. In particular, we want to see how efficient these techniques are in estimating of metrics related to activities of Twitter, e.g., number of active users, or number of tweets sent. These metrics are rarely published by OSN providers and often cannot be verified.
1.3.3.1 Challenges
Data processing. In order to perform tests of sampling techniques on our Twitter dataset, we need to build a tool that would emulate the Twitter API. This step is not straightforward
1.3. Challenges and Contributions 9 due to two facts. First, to make a trustworthy computation on the graph, we need to repeat the experiments multiple times, e.g., we cannot conclude anything on one RW made from a particular node in the graph. Here is when the second fact comes into play, due to the size of the dataset, it is important to have a fast access to the data. For example, if we decide to store the data on the hard drive, a RW will require numerous reads from random places of the file which is known to be extremely slow; then, since we need to repeat the computation multiple times (e.g., to get the confidence interval), we will end up with a computation that can take weeks or month, which is often impractical. Actually, most of the time we need to keep two copies of the Twitter social graph in memory: the adjacency list of followers and the adjacency list of followings. We overcome this problem by putting the graph into memory as a read-only structure and by making multiple computation threads to benefit from the multi-core architecture of the server.
Moreover, some of the sampling techniques (e.g., the ones derived from RW) require computations to be done on each step of the sampling. For example, RW are naturally biased toward high-degree nodes, hence, one needs to unbias the results in either online (Metropolis-Hasting RW) or offline fashion (re-weighted RW), which requires some computation. Such computations usually take few time, but since we aim to see the evolution of different metrics with the size of the sample, we have to repeat these computations numerous times, which in turn results in a significant increase of the computation time. The optimization of such computation is done by profiling and re-factoring the code.
Crawling cost. Another interesting problem is the cost of the crawl. Here, we propose to consider the cost in terms of time required to retrieve the information from the OSNs or in terms of number of requests we need to make to OSNs servers. In theory, we often represent social relationships among users as a graph G(V, E) where V is a set of users and E is a set of relationship interconnecting the users. A naive approach would be to consider a sample S ⊂ V to have cost of |S| or 1 unit (e.g., request) per user. However, in practice that is not what we observe. Indeed, the way information is presented in OSN may affect the cost of the crawl. For example, due to the huge amount of information, the Twitter API paginates the results of some requests, let’s consider that we need to retrieve the list of followers of Lady Gaga, she had 22 million followers in 2012, and the API returns at most 5,000 followers per page, that makes 22×106
5000 = 4400 requests = 73.3 hours to get the information; whereas for an ordinary
user we would need only one minute. Moreover, some techniques (e.g., Metropolis-Hasting RW) relies on some additional knowledge (e.g., the degree of an adjacent node) during the crawl to decide if we jump to a new node or stay in the current one; this can increase the cost of the crawl by a huge factor (50x in case of Twitter).
In summary, we aim to evaluate the performance of sampling techniques to estimate various metrics of the social graph taking into account the real cost of sampling.
1.3.3.2 Contributions
We show that it is important to properly address the sampling bias, because classical sampling techniques, such as RW and BFS, are biased towards high degree nodes. Also, we argue that one needs to carefully account for the practical cost of sampling when designing sampling algorithms (e.g., the cost of Metropolis-Hasting RW is up to two orders of magnitude higher
than the cost of BFS with the same number of nodes sampled). We show that we can easily estimate such metrics as number of active accounts or number of tweets sent within the time-frame of one day.
1.4
Thesis Outline
This thesis has the following structure. Chapter 2 contains the description of related work. In Chapter3 we present the study of the structure of Twitter social graph, we identify eight different components base on the connectivity of the graph and map this components to a particular usage of Twitter. In Chapter4we study the dissemination of news media articles through Twitter by monitoring the URLs of five popular news media posted by both the news media and the ordinary Twitter users. In Chapter5 we acknowledge that provided the rapid growth of OSNs and the constraints put by the OSN provides on the access to their data, it will be difficult if not impossible to collect large scale datasets, we discuss the problem of sampling of OSNs and address the bias of these samples. Chapter 6concludes the thesis.
Chapter 2
Related work
Twitter has been widely studied for years, first works on Twitter were published one year after its launch in 2006 [Java 2007]. We describe in the following works related to this thesis, and we position our contributions to the state of the art.
Twitter Crawl. Some of them crawled partially the graph before 2009 [Java 2007, Krishnamurthy 2008,Huberman 2008], so before the wide adoption of Twitter. Two studies made a large crawl of the Twitter social graph. Kwak et al. used a technique close to a BFS and reverse BFS from a popular account and also collected accounts referring to trending topics. This crawling methodology cannot capture some users that are not connected to the LSC component, and that do not tweet about trending topic, thus a partial view of the Twitter social graph. Cha et al. [Cha 2010] used a crawl by account ID, that is close to what we did. Both of these studies made their dataset publicly available and others built on it [Lee 2010,Wu 2011,Cha 2012,Sharma 2012], but the datasets were collected in 2009 during the main change in the Twitter social graph we discuss in Section3.5.2.
To the best of our knowledge, the dataset we present is the most up-to-date and complete description of the Twitter social graph.
Graph Macrostructure. None of the prior studies explored the macrostructure of a so-cial graph. Broder et al. [Broder 2000] introduced first the notion of macrostructure for a directed graph in the context of the Web, but we significantly improved it, and we are the first ones to apply it to Twitter. Unlike what Broder et al. proposed, we present a method-ology to compute the exhaustive macrostructure of any large directed social graph, along with the categorization of each account in the identified component, which is a significant methodological step.
Influence and intermediaries. Information diffusion naturally shapes collective opinion and consensus [Katz 1957,Degroot 1974,Lord 1979], hence the role of OSNs in redistributing influence online has been under scrutiny ever since their prehistoric forms, e.g., blogs and email chains [Adamic 2005,Liben-Nowell 2008]. Information on traditional mass media fol-lows a unidirectional channel in which pre-established institutions concentrate all decisions. Although the emergence of opinion leaders digesting news content to reach the public at large was pre-established long time ago [Katz 1957], OSNs presents an extreme case. They challenge the above vision with a distributed form of influence: OSNs allow in theory any content item to be tomorrow’s headline and any user to become an influencer. This could be either by gathering direct followers, or by seeing her content spreading faster through a set of intermediary nodes.
Previous studies show that almost all online users exhibit an uncommon taste at least in a part of their online consumption [Goel 2010], while others point to possible bottlenecks in information discovery that limits the content accessed [Cha 2009]. To fully leverage opportu-nities open by OSNs, works propose typically to leverage either a distributed social curation process (e.g., [Zadeh 2013,Hegde 2013,Wong 2015,May 2014]) or some underlying interest clusters to feed a recommender system (e.g., [Xu 2014,Massoulié 2015]).
Prior works demonstrated that news content exposure benefits from a set of informa-tion intermediaries [Wu 2011,May 2014], proposed multiple metrics to quantify influence on OSNs like Twitter [Cha 2010, Bakshy 2011], proposed models to predict its long term ef-fect [Kleinberg 2007, Lelarge 2012], and designed algorithms to leverage inherent influence to maximize the success of targeted promotion campaign [Kempe 2003,Ok 2014] or prevent it [Lelarge 2009]. So far, those influence metrics, models, and algorithms have been validated assuming that observing a large number of receptions is a reliable predictor of actual success, hence reducing influence to the ability to generate receptions. We turn to a new definition in which influence is measured by actual clicks, which are more directly related to revenue through online advertising, and also denote a stronger interaction with content.
Temporal Evolution of Diffusion. Studying the temporal evolution of diffusion on OSNs can be a powerful tool, either to interpret the attention received online as the result of an exogenous or endogenous process [Crane 2008], to locate the original source of a ru-mor [Pinto 2012], or to infer a posteriori the edges on which the diffusion spreads from the timing of events seen [Gomez-Rodriguez 2012]. More generally, examining the temporal evolution of a diffusion process allows to confirm or invalidate simple model of information propagation based on epidemic or cascading dynamics. One of the most important limitation so far is that prior studies focus only on the evolution of the collective volume of attention (e.g., hourly volumes of clicks [Szabo 2010], views [Crane 2008,Cha 2009]), hence capturing the implicit activity of the audience, while ignoring the process by which the information has been propagated. Alternatively, other studies focus on explicit information propagation only (e.g., tweets [Yang 2011], URLs shorteners, diggs [Wu 2007]) ignoring which part of those content exposure leads to actual clicks and content being read. Here for the first time we combine explicit shares of news with the implicit web visits that they generate.
Temporal patterns of online consumption was gathered using videos popularity on YouTube [Crane 2008, Cha 2009] and concluded to some evolution over days and weeks. However, this study considered clicks originating from any sources, including YouTube own recommendation systems, search engine, and other mentions online. One hint of the short attention span of OSNs was obtained through URLs shorteners1. Using generic bit.ly links of large popularity, this study concludes that URLs exchanged using bit.ly on Twitter to-day typically fades after a very short amount of time (within half an hour). Here we can study jointly for the first time the two processes of OSN sharing and consumption. Prior work [Abisheva 2014] dealt with very different content (i.e., videos on YouTube), only mea-sured the overall popularity generated from all sources, and only studied temporal patterns as a user feature to determine their earliness. Since the two processes are necessarily related, the most important unanswered question we address is whether the temporal property of one
1
13 process allows to draw conclusion on the properties of the others, and how considering them jointly shed a new light on the diffusion of information in the network.
Spammers and Bots on Twitter. Twitter is very open, it does not impose real name police and has profiles set to be public by default. While having obvious benefits, this approach has a drawback, it is fairly easy to create fake accounts that are often used for spam, creation of fake followers, or opinion manipulation. Twitter suspends accounts that are violating its terms of use, however, to the best of our knowledge, it is done manually. Many studies are focused on studying malicious activity on Twitter and on automatic ways of its detention [Benevenuto 2010,Wang 2010a,Ghosh 2011,Chu 2012,Yang 2012].
Kurt et al. [Thomas 2011] studied the lifetime, properties, and behavior of spam accounts on Twitter based on the large collection of tweets aggregated during seven month. Authors identified an emerging marketplace of social network spam-as-a-service and analyzed its un-derlying infrastructure including an in-depth analysis of five of the largest spam campaigns on Twitter. Zhang et al. [Zhang 2011] performed an analysis of automated activity on Twitter and discovered that 16% of active accounts exhibit a high degree of automation. Authors present a method for detecting the automated Twitter accounts. Ghosh et al. [Ghosh 2012] studied link farming on Twitter, when users try to acquire large number of followers. Authors describe different types of users who farm links and propose a ranking scheme, where users are penalized for following spammers.
In this work, we identified the DISCONNECTED component that previous studies missed, for example, because they used BFS from a popular node to crawl the graph. This component contains a lot of spammer accounts that are not connected to anyone, but are used to send tweets that will appear in the search results.
Twitter Privacy and Anonymity. Another implication of Twitter being open is that people send sensitive information in their tweets forgetting about the conse-quences [Humphreys 2010,Mao 2011]. Public tweets may contain such sensitive information as user’s health state, confessions about driving drunk, or the periods of time when people leave their houses. This information can be used by insurance companies, law enforcement, and robbers respectively; it can have drastic effect on the lives of people who post it. This problem looks even more severe because 70% of Twitter users are identifiable, e.g., they disclose their full name in their Twitter profile [Peddinti 2014].
Even without disclosing sensitive information by themselves, users of OSNs can be deanonymized by websites. For example, Ramachandran et al. show that it is possible to map silent web visitors to their Twitter profiles by matching the list of webpages they visited with the list of tweets containing URLs they received on Twitter [Ramachandran 2014].
In our study, we share the data we collected from Twitter, and we take the following pre-cautions to ensure that we do not disclose any private information of Twitter users. First, we anonymized the Twitter social graph we make publicly available. Second, the URL shorteners that we use to study the information propagation on Twitter were merged to make sure that users cannot be deanonymized using the data from our dataset (see Section4.2.2).
Twitter Users Categorization. A Twitter user profile does not provide rich information about the user, it only includes basic fields such as name, free-form description, location, and
personal website URL. However, to understand information propagation in Twitter, one needs to understand the landscape of Twitter users. This set of studies is focused on categorizing Twitter accounts into several categories based on their functions, influence, behavior, or origin. Cha et al.[Cha 2010] study the influence of Twitter users based on the complete snapshot of Twitter graph and the entire collection of tweets in 20092. Later, Cha et al. [Cha 2012] categorized Twitter users and study their patterns of information spread. Some researches [Sharma 2012, Wu 2011] have crawled Twitter lists, that are user-created lists meant to group together people of similar domain of interest. Lists were introduced to better organize Twitter subscriptions, users can follow the entire list instead of following all its members. Also, the data from the lists can be used to infer the field of expertise for the users listed.
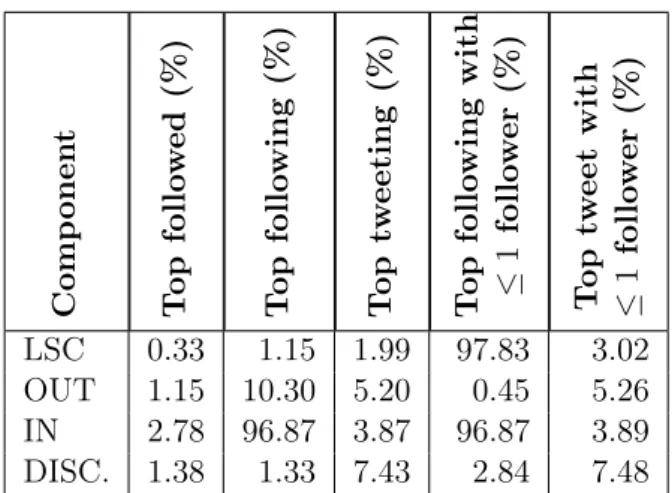
We used the list of experts identified by Sharma et al. [Sharma 2012] to understand the roles of users in different components of graph macrostructure (see Chapter 3.4).
Graph sampling. Graph sampling is a set of techniques to pick a subset of vertices or edges from the original graph. Sampling has a wide spectrum of applications including sociological surveys, graph visualization and estimation of various metrics on the graphs with limited access [Hu 2013]. Classical graph sampling techniques are based on graph traversal algorithms, e.g., BFS, RW, or multiple RWs [Ribeiro 2010]. RW and BFS are known to have bias towards high-degree nodes, this bias should be corrected to obtain correct results, it is often done using theoretical results on Markov chains for undirected social graphs, e.g., Facebook [Gjoka 2010]. One simple approach to access the sampling bias in a directed graph is to ignore the directional of the links and apply previous results [Wang 2010b].
We are the first ones to take into account the practical cost of sampling and to validate the sampling techniques on a real Twitter social graph.
2
Chapter 3
Twitter Social Graph
Contents
3.1 Motivation . . . 16
3.2 Measuring Twitter at Scale . . . 17
3.2.1 Crawling Methodology. . . 17
3.2.2 Limitations of the Crawl. . . 18
3.2.3 Measured Twitter Social Graph . . . 19
3.2.4 Ethical Issues . . . 20
3.3 Graph Analysis Methodology . . . 20
3.4 The Macrostructure of Twitter in July 2012 . . . 22
3.4.1 LSC Component . . . 24 3.4.2 OUT Component . . . 27 3.4.3 IN Component . . . 29 3.4.4 DISCONNECTED Component . . . 31 3.4.5 Other Components . . . 32 3.4.6 Discussion. . . 32
3.5 Evolution of the Macrostructure of the Twitter Social Graph with
Time . . . 32
3.5.1 Methodology to Estimate the Macrostructure . . . 32
3.5.2 Evolution of the Macrostructure . . . 34
3.5.3 Distribution of New Accounts in Components . . . 36
3.6 Related Work. . . 37
3.7 Discussion . . . 37
3.8 Acknowledgements. . . 38
Twitter is one of the largest social networks using exclusively directed links among ac-counts. This makes the Twitter social graph much closer to the social graph supporting real life communications than, for instance, Facebook. Therefore, understanding the structure of the Twitter social graph is interesting not only for computer scientists, but also for researchers in other fields, such as sociologists. However, little is known about how the information prop-agation in Twitter is constrained by its inner structure.
In this chapter, we present an in-depth study of the macroscopic structure of the Twitter social graph unveiling the highways on which tweets propagate, the specific user activity associated with each component of this macroscopic structure, and the evolution of this macroscopic structure with time for the past 6 years. For this study, we crawled Twitter
to retrieve all accounts and all social relationships (follow links) among accounts; the crawl completed in July 2012 with 505 million accounts interconnected by 23 billion links1. Then, we present a methodology to unveil the macroscopic structure of the Twitter social graph. This macroscopic structure consists of 8 components defined by their connectivity characteristics. Each component group users with a specific usage of Twitter. For instance, we identified components gathering together spammers, or celebrities. Finally, we present a method to approximate the macroscopic structure of the Twitter social graph in the past, validate this method using old datasets, and discuss the evolution of the macroscopic structure of the Twitter social graph during the past 6 years.
This work was accepted and presented at ACM SIGMETRICS 2014 in Austin, TX, USA [Gabielkov 2014b].
3.1
Motivation
Twitter is one of the largest social networks with more than 500 million registered accounts. However, it differs from other large social networks, such as Facebook and Google+, because it uses exclusively arcs among accounts2. Therefore, the way information propagates on Twitter is close to how information propagates in real life. Indeed, real life communications are characterized by a high asymmetry between information producers (such as media, celebrities, etc.) and content consumers. Consequently, understanding how information propagates on Twitter has implications beyond computer science.
However, studying information propagation on a large social network is a complex task. Indeed, information propagation is a combination of two phenomena. First, the content of the messages sent on the social network will determine its chance to be relayed. Second, the structure of the social graph will constrain the propagation of messages. In this chapter, we specifically focus on how the structure of the Twitter social graph constrains the propagation of information. This problem is important because its answer will unveil the highways used by the flows of information. To achieve this goal, we need to overcome two challenges. First, we need an up-to-date and complete social graph. The most recent publicly available Twitter datasets are from 2009 [Kwak 2010,Cha 2010], at that time Twitter was 10 times smaller than in July 2012. Moreover, these datasets are not exhaustive, thus some subtle properties may not be visible. Second, we need a methodology revealing the underlying social relationships among users, a methodology that scales for hundreds of millions of accounts and tens of billions of arcs. Standard aggregate graph metrics such as degree distribution are of no help because we need to identify the highways of the graph followed by messages. Therefore, we need a methodology to both reduce the size of the social graph and keep its main structure. In this chapter, we overcome these challenges and make the following specific contribu-tions.
1. We collected the entire Twitter social graph, representing 505 million accounts con-nected with 23 billion arcs. To the best of our knowledge, this is the largest complete social graph ever collected.
1
http://j.mp/soTweet 2
Arcs—that are directed edges—represent the follow relationship in Twitter. If A follows B, A receives tweets from B, but B will not receive tweets from A, unless B follows A.
3.2. Measuring Twitter at Scale 17 2. We unveil a macroscopic structure in the Twitter social graph that preserves the highways of information propagation. Our method extends the one of Broder et al. [Broder 2000] and can be applied to any kind of directed graph.
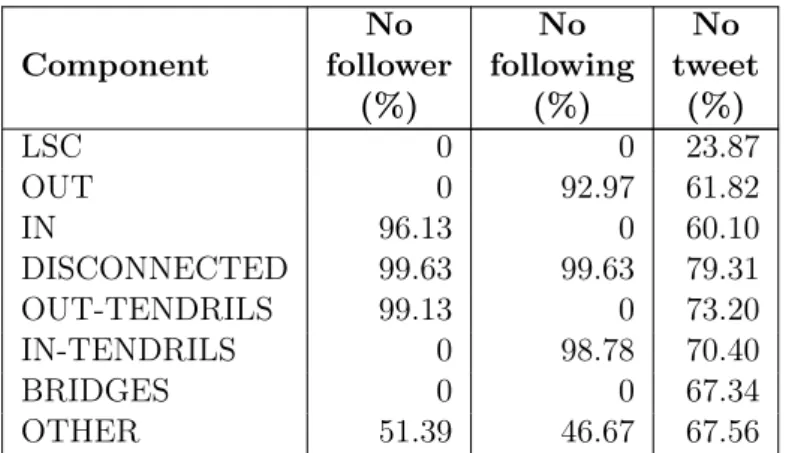
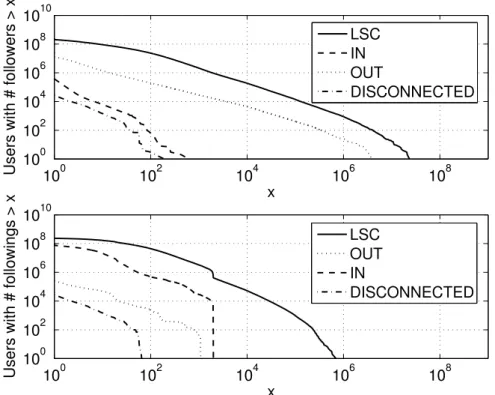
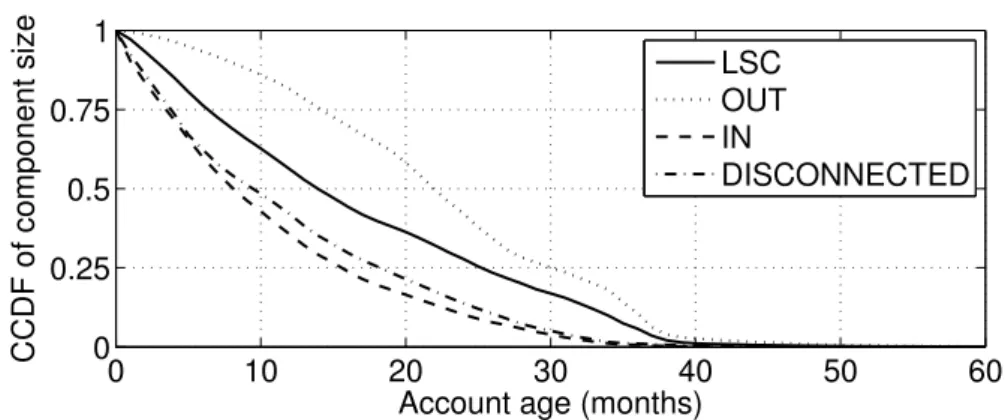
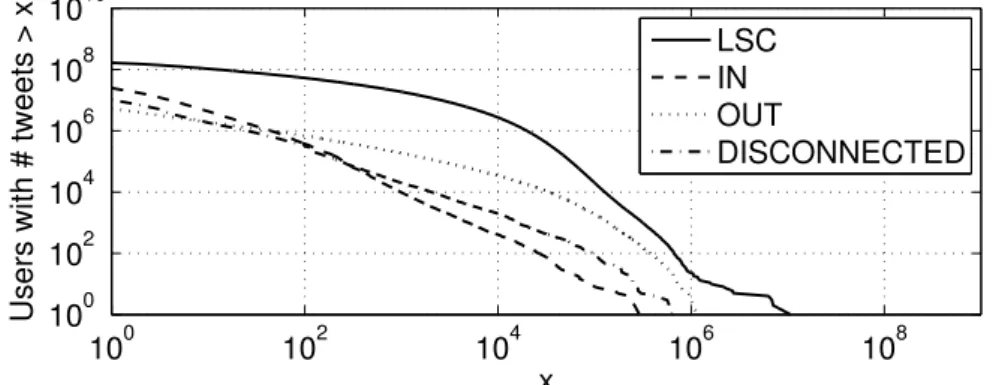
3. We show that not only the macroscopic structure of the Twitter social graph constrains information propagation, but that each component of the macrostructure corresponds to group of users with a specific usage of Twitter. In particular, we show that regular, abandoned, and malicious accounts are not uniformly spread on the components of the macroscopic structure of the Twitter social graph. This result is important to understand how Twitter is used, where users with a specific usage are, and how to sample Twitter without a significant bias.
4. We present a simple methodology to explore the evolution of the macroscopic structure of Twitter with time, we validate this methodology, and show that old datasets from 2009 do not represent the current structure of the Twitter social graph. We explore this time evolution to understand the changes in the usage of Twitter since its creation. The remainder of this chapter is structured as follows. In Section 3.2, we present our methodology to crawl Twitter and discuss the dataset we collected. We present and discuss, in Section3.3, the notion of macroscopic structure, then we describe a methodology to unveil this macroscopic structure. We present the result of applying this methodology to our dataset in Section 3.4. In Section 3.5, we propose a simple approach to estimate the evolution of the macroscopic structure of the graph with time, validate this approach, and discuss the evolution of the Twitter social graph from 2007 to 2012. Finally, we present the related work in Section 3.6, and conclude in Section 3.7.
3.2
Measuring Twitter at Scale
In this section, we describe the methodology used to crawl the Twitter social graph, some high level characteristics of the dataset, the limitations of our crawl, and the ethical issues.
3.2.1 Crawling Methodology
In order to collect our dataset, we used the Twitter REST API3 version 1.0 to crawl the information about user accounts and arcs between users. The main challenge of the crawl is that API requests are rate-limited; an unauthenticated host could make at most 150 requests per hour with that API. However this limit could be overcome by using a whitelisted machine. Twitter used to whitelist the servers of research teams and data-intensive services upon request, this service has been discontinued since February 2011, but existing whitelisted machines could still be used. We used four whitelisted machines to perform our crawl, two machines with a rate limit of 20,000 requests per hour and two with 100,000 requests per hour.
We also implemented and deployed a distributed crawler on 550 machines of PlanetLab4, doubling the crawling rate compared to whitelisted machines only.
3
Twitter REST API,https://dev.twitter.com/overview/documentation
4
<−9 −8 −6 −4 −2 0 2 4 6 8 >9 0 10 20 30 40 50 60 70 80
Difference (API response − public graph degree)
% users in the dataset
Followers Followings
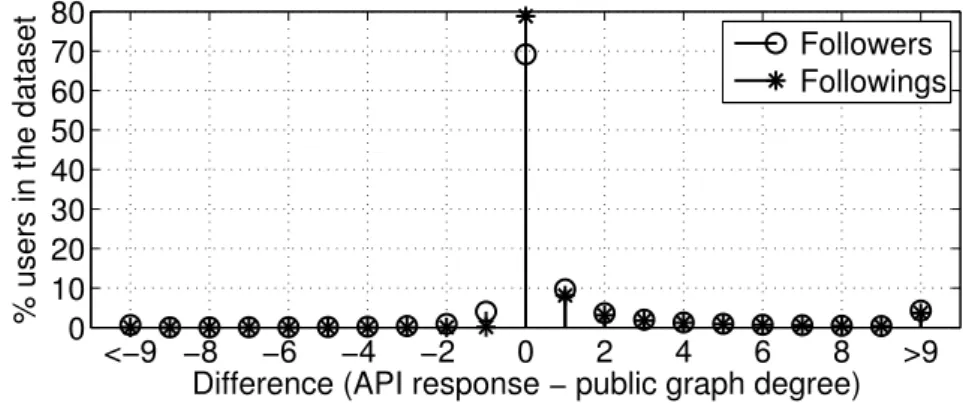
Figure 3.1 – The difference in number of followers and followings between the data from user accounts and the public social graph reconstructed from our dataset.
We crawled Twitter by user ID, such numeric IDs are assigned for new accounts sequen-tially, but with gaps [Krishnamurthy 2008]. Therefore, we first determined using a random polling that the largest assigned ID is lower than 800 million, then we divided the range from 1 to 800 million into chunks of 10,000 IDs. We selected an upper bound (800 million) much larger than the largest observed ID to be sure to do not miss any account.
We performed our crawl from March 20, 2012 to July 24, 2012. We implemented a crawler that assigns chunks of 10,000 IDs to each crawling machine. Then, for a given chunk, each crawling machine performs two steps. First, the machine makes 100 requests for 100 IDs, the maximum number of IDs the lookup method of the API accepts, using an API call [Russell 2011a]. When an ID corresponds to a valid account, we retrieve all public numerical, boolean and date information5. Second, the machine collects the list of followings for all non-protected and valid accounts with at least one following.
We now define the notions of following, followers, and protected accounts that we use in this chapter. Each Twitter account can have followings and followers. An account receives all published tweets from its followings, and all its followers receive its tweets. Tweets, and list of followers and followings, are by default visible to everyone. However, users can make their account protected which makes this information visible only to its followers. Furthermore, following a protected account requires manual approval from its owner. For more information seehttps://support.twitter.com/articles/14016.
3.2.2 Limitations of the Crawl
There are some accounts that we could not crawl, representing 6.33% of the entire Twitter social graph. We explain in the following the reasons why some accounts are not present in our dataset.
1. 32,112,668 accounts (5.97% of the accounts in our dataset) are protected, so we cannot get their list of followings. The degrees of nodes in the graph we analyzed do not take into account arcs to and from protected accounts.
2. 1,855,945 accounts were referenced in the list of followings of other accounts, but the
5
The public information returned by the API call we make is described in this URLhttps://dev.twitter.
3.2. Measuring Twitter at Scale 19 API lookup did not return any profile information for these referenced accounts. Then we tried to perform further API lookups for these referenced accounts, and we obtained profile information for only 137,899 (7.43%) of them. For the rest, the API lookups did not return any profile information. We guess that these accounts were either de-activated6 during the crawl or suspended by Twitter because these accounts violated Twitter’s terms of use. Users can reactivate their account at any time during 30 days after deactivation, so we guess that the observed 7.43% have reactivated their accounts. 3. For 5,938 accounts, we did not crawl the list of followings because the API consistently returned an error code. We counted the number of followings for such accounts as 0. 4. 1,180 user accounts were lost because our archives with data were partially corrupted
due to a system bug on two crawling machines.
The number of followings and followers for each account can be obtained in two ways. Either we get these values from an API call, or we compute them based only on the list of followings for each account. We use the latter to build our social graph, so we cross-validated the number of following and followers using the latter method with the former one. We see in Figure 3.1 that there is no difference between the numbers of followers (resp. followings) returned by the API and the number of followers (resp. followings) in the social graph we computed for 69.14% (resp. 78.79%) of the collected accounts. The difference observed for the other accounts is due to three different reasons. First, our graph does not include protected accounts and their incoming and outgoing arcs, so the number of following and followers in the computed graph is smaller than from the API, which explains that we observe a higher number of positive differences in Figure 3.1. Second, there is a delay between the time the account information was crawled and the time the list of followings was crawled because of the implementation of the crawler described in Section3.2.1. This delay of 9 hours on average (9.5 minutes median) causes a difference in the number of followings reported by the API and the number of followings obtained by computing the social graph, because some arcs might be added or removed during this delay. Third, we crawled all accounts during a four months period. So a given account crawled at time T might be followed (resp. unfollowed) by accounts after time T , accounts that we crawled after they added (resp. removed) the follow links. Thus, there is a larger (resp. smaller) number of followers for this given account in the computed social graph than returned by the API.
3.2.3 Measured Twitter Social Graph
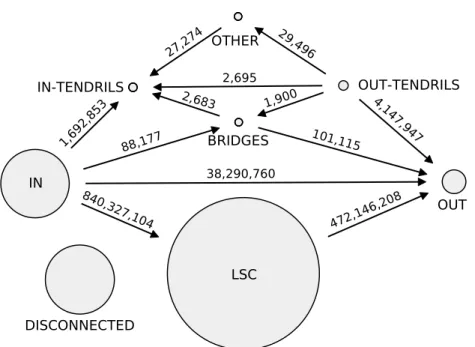
We collected all Twitter accounts, consisting of 537 million accounts at the end date of our crawl in July 2012, and accounts’ public information (including account creation date, number of published tweets, number of followings and followers, etc.) We remind that there are 5.97% of all accounts (32 million) that are protected, which means one needs their approval to get the lists of their followings. So we collected the list of all followings for non-protected accounts only, resulting in a social graph with 505 million nodes and 23 billion arcs. The average node in-degree of this graph is 45.6, the median is 1, and the 90th percentile is 33.
6
Our dataset is, to the best of our knowledge, the largest and most complete dataset of a social network available today. We also believe that it will be harder in the future to collect such a large and complete dataset. Indeed, companies are taking measures to prevent large crawls of their social networks. For instance, Twitter is no more whitelisting machines. Moreover it has discontinued on June 11, 2013 the API 1.0 that supported anonymous requests and use of already whitelisted machines. The new API 1.1 requires user authentication for each request making crawls harder and longer to perform. For these reasons, we acknowledge that our dataset has value to communities interested in social graphs, and we publicly release it (with precautions described in Section3.2.4)7.
3.2.4 Ethical Issues
There are two main ethical issues with large scale measurement studies. First, we need to take care of users privacy. All data collected in this study are publicly available through the Twitter API, the Twitter applications, and the Twitter Web site. In particular, we did not collect any data that is not publicly available, or did not work around any protection mechanisms.
Second, we need to respect Twitter terms of use. We used the regular Twitter API to perform our crawl. We made half of our crawl using machines whitelisted by Twitter, and half of the crawl using a distributed crawler which used the regular Twitter API and conformed to its rate constraint. On average, we generated from the distributed crawler around 20 requests per second to the API, a rate of requests we believe to be negligible for the Twitter infrastructure.
We release our dataset that consists of the Twitter social graph in the format of an adjacency list. In the released dataset each account ID is anonymized.
3.3
Graph Analysis Methodology
We start discussing the motivation and insights behind the analysis of the macroscopic structure—henceforth called the macrostructure—of the Twitter social graph. There is a fundamental difference between directed social graphs such as Twitter and other directed graphs such as the Web. In a directed social graph, not only the links among accounts show the influence of accounts, but they also constrain the propagation of information. Therefore, unveiling the macrostructure of a social graph sheds light on the highways of information propagation.
However, it is a challenge to extract a macrostructure on a social graph of the size of Twitter. The intuition behind our macrostructure analysis is the following. We want to understand how the Twitter graph constrains the flow of information. Therefore, we start by identifying all the strongly connected components (SCCs) that are components with a directed path between any two nodes. In such components, the information can freely circulate, so we abstract each of these components by a single node. After this stage, we obtain a directed acyclic graph (DAG) that is half of the size of the original graph (in terms of number of nodes), still too large to be analyzed. Consequently, the next stage is to group nodes in this DAG based on their connectivity to the largest SCC. As discussed in the following, the
7
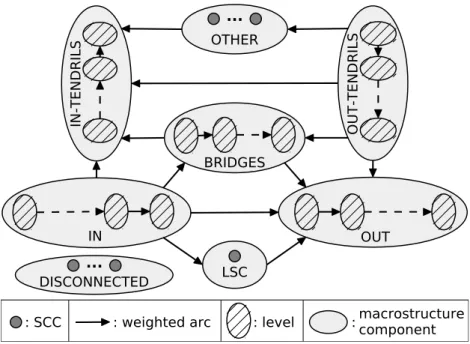
3.3. Graph Analysis Methodology 21 OUT BRIDGES DISCONNECTED OTHER LSC IN IN -T E N D R IL S O U T -T E N D R IL S ... ...
: SCC : weighted arc : level :macrostructurecomponent
Figure 3.2 – Macrostructure of any directed graph.
largest SCC represents roughly half of the nodes. This is large and there is undoubtedly an interesting analysis to make on this component, but we keep this analysis for future work and focus in this chapter on the macrostructure. After this stage, we have 8 components representing a tractable graph. We now describe the details of this process.
We compute the macrostructure of the Twitter social graph in two stages. In the first stage, we use the Tarjan algorithm [Tarjan 1971] to compute the SCCs of the Twitter social graph. Then, we replace each SCC with a single vertex, and the multiple arcs between any two vertices with a weighted arc of weight equal to the number of arcs it replaces. As a result, we obtain a directed acyclic graph.
In the second stage, to uncover the macrostructure of the directed acyclic graph shown in Figure3.2, we use the following procedure. We first identify the Largest Strongly Connected (LSC) component, the component with the largest number of original nodes. From this LSC component, we run a breadth first search (BFS). We define the set of vertices we find to be the OUT component, that is the set of nodes with a directed path from the LSC component. Inside the OUT component we distinguish levels (shown as hatched ellipses on Figure3.2). Each level is a bin of SCCs that have the same distance from the LSC component. Then we run a reverse BFS from the LSC component and define the set of vertices we find to be the IN component which is a set of nodes with a directed path to the LSC component. Similarly to OUT we distinguish levels inside the IN component based on the distance to the LSC component. Next, we perform a BFS starting from the IN component and a reverse BFS from the OUT component, reachable nodes that were not yet in the LSC, IN or OUT components were identified as IN-TENDRILS and OUT-TENDRILS respectively. Inside the tendrils we can also identify levels depending on the distance to the components these tendrils are growing from. We separated nodes that were identified as both IN-TENDRILS and OUT-TENDRILS into the BRIDGES category that consist of accounts connecting the IN and OUT bypassing the LSC component, we can also distinguish levels based on the distance to OUT