HAL Id: inserm-02320512
https://www.hal.inserm.fr/inserm-02320512
Submitted on 18 Oct 2019
HAL is a multi-disciplinary open access
archive for the deposit and dissemination of
sci-entific research documents, whether they are
pub-lished or not. The documents may come from
teaching and research institutions in France or
abroad, or from public or private research centers.
L’archive ouverte pluridisciplinaire HAL, est
destinée au dépôt et à la diffusion de documents
scientifiques de niveau recherche, publiés ou non,
émanant des établissements d’enseignement et de
recherche français ou étrangers, des laboratoires
publics ou privés.
Genome-Wide Methylation Analysis Identifies Specific
Epigenetic Marks In Severely Obese Children
Delphine Fradin, Pierre-Yves Boëlle, Marie-Pierre Belot, Fanny Lachaux, Jörg
Tost, Céline Besse, Jean-François Deleuze, Gianpaolo de Filippo, Pierre
Bougnères
To cite this version:
Delphine Fradin, Pierre-Yves Boëlle, Marie-Pierre Belot, Fanny Lachaux, Jörg Tost, et al..
Genome-Wide Methylation Analysis Identifies Specific Epigenetic Marks In Severely Obese Children. Scientific
Reports, Nature Publishing Group, 2017, 7 (1), pp.46311. �10.1038/srep46311�. �inserm-02320512�
Genome-Wide Methylation
Analysis Identifies Specific
Epigenetic Marks In Severely
Obese Children
Delphine Fradin
1,†, Pierre-Yves Boëlle
2, Marie-Pierre Belot
1, Fanny Lachaux
1, Jorg Tost
3,
Céline Besse
4, Jean-François Deleuze
4, Gianpaolo De Filippo
5& Pierre Bougnères
1,5Obesity is a heterogeneous disease with many different subtypes. Epigenetics could contribute to these differences. The aim of this study was to investigate genome-wide DNA methylation searching for methylation marks associated with obesity in children and adolescents. We studied DNA
methylation profiles in whole blood cells from 40 obese children and controls using Illumina Infinium HumanMethylation450 BeadChips. After correction for cell heterogeneity and multiple tests, we found that compared to lean controls, 31 CpGs are differentially methylated in obese patients. A greatest proportion of these CpGs is hypermethylated in obesity and located in CpG shores regions. We next focused on severely obese children and identified 151 differentially methylated CpGs among which 10 with a difference in methylation greater than 10%. The top pathways enriched among the identified CpGs included the “IRS1 target genes” and several pathways in cancer diseases. This study represents the first effort to search for differences in methylation in obesity and severe obesity, which may help understanding these different forms of obesity and their complications.
Data from U.S. population surveys demonstrate a significant increase in obesity prevalence among children age 2–19 years old, from 5.5% in 1976–19801 to 16.9% in 2007–20101,2, with obesity defined as body mass index
(BMI) ≥ 95th percentile using the Centers for Disease Control and Prevention (CDC)3. Severe obesity is the most
rapidly growing paediatric obesity subgroup, and recent estimates suggest that this disease afflicts up to 6% of all children and adolescents in the United States4. Compared to youth with BMI in the obese range, those with severe
obesity have higher rates of immediate and long-term metabolic and cardiovascular comorbidities5. It stands
to reason that youth with obesity and severe obesity may also differ in aetiological factors and consequences, including epigenetic.
There is growing evidence that DNA methylation might contribute to obesity. Indeed, candidate gene meth-ylation studies in animal models and humans have demonstrated methmeth-ylation changes in promoters of various genes that are implicated in obesity, appetite control and/or metabolism, insulin signaling, immunity, growth and circadian clock regulation6–9. For example, the methylation percentage of insulin-like growth factor 2 (IGF2)
pro-moter was higher in overweight infants than in lean infants8. The methylation of peroxisomal proliferator activated
receptor-γ-co-activator-1α promoter in children blood predicts adiposity at adolescence independently of sex, age,
pubertal timing and activity6.
To identify novel genes and pathways related to obesity and obesity-induced complications, epigenome-wide association studies (EWAS) are needed. Two previous studies using the HumanMethylation27 BeadChip with 27,000 CpGs, primarily targeting gene promoters and CpG islands (CGIs), examined blood leukocytes of obese and lean adolescents10,11. Wang et al. discovered two obesity-associated inflammatory genes Ubiquitin Associated
And SH3 Domain Containing A and Tripartite Motif Containing 3 (UBASH3A and TRIM3), and Almen et al.
1INSERM U1169, Bicêtre Hospital, Paris Sud University, Le Kremlin-Bicêtre, France. 2Pierre et Marie Curie University,
INSERM, Paris, U707, France. 3Laboratory for Epigenetics and Environment, Centre National de Génotypage, CEA
- Institut de Génomique, Evry, France. 4Centre National de Génotypage, CEA - Institut de Génomique, Evry, France. 5Department of Pediatric Endocrinology, Bicêtre Hospital, Paris Sud University, Le Kremlin-Bicêtre, France. †Present
address: Inserm U1232, CRCINA, Nantes, France. Correspondence and requests for materials should be addressed to D.F. (email: [email protected])
received: 23 November 2016 Accepted: 14 March 2017 Published: 07 April 2017
OPEN
www.nature.com/scientificreports/
identified 20 CpGs differentially methylated between groups. A larger study looking at the impact of BMI on DNA methylation in different tissues using the HumanMethylation 450 BeadChip by Dick et al. found five probes correlated with BMI, three of which were in the intron of HIF3A (Hypoxia Inducible Factor 3, Alpha Subunit)12. In
children, two recent papers also showed that specific DNA methylation profiles in blood differ between lean and obese subjects13,14. Using the NimbleGen Human DNA Methylation 385 K Promoter Plus CpG Island Microarray,
Ding et al. found 575 demethylated CGIs and 277 hypermethylated CGIs in obese children. Finally, Huang et al. identified 129 differentially methylated CpGs associated with 80 unique genes. None of the obesity-associated CpGs was common to all studies, which may be due to differences between the study populations, diverse genetic backgrounds, or heterogeneous metabolic phenotypes between different BMI categories.
Given the paucity of research on the different BMI categories, the purpose of this study were twofold: (i) investigate DNA methylation marks in all obese children compare to lean controls; (ii) identify the differentially methylated CpGs associated with severe obesity in childhood. We hypothesized that patients with severe obesity could help at identifying epigenetic changes, as extreme phenotypes improve genetic association studies.
Results
Identification of differentially methylated CpGs associated with childhood obesity.
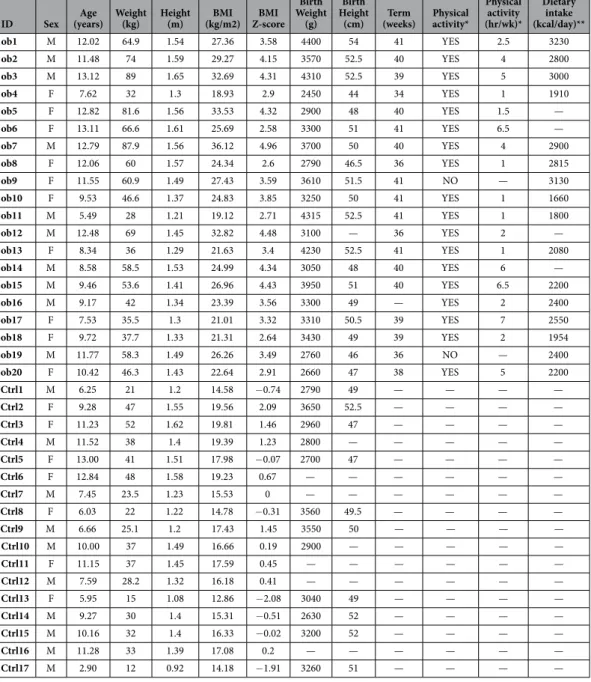
The genome-wide methylation analysis was conducted in 20 obese children (BMI Z-score > 2.5,) and 17 controls (Table 1). Three controls were excluded due to bad quality DNA and arrays.Because DNA methylation varies by cell type and could bias EWAS results conducted in blood samples, we estimated the cell type compositions in each sample using minfi, and found that cellular composition was not similar between cases and control subjects (Supplemental Table 1). To correct for these differences, we used next the Houseman’s correction algorithm15.
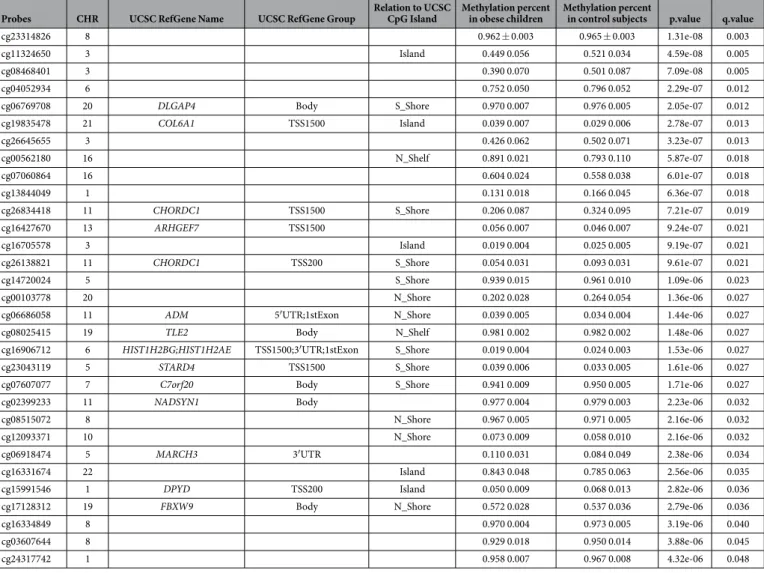
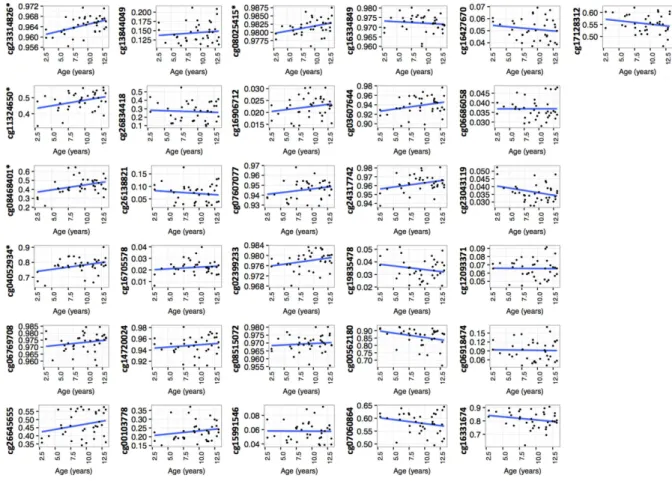
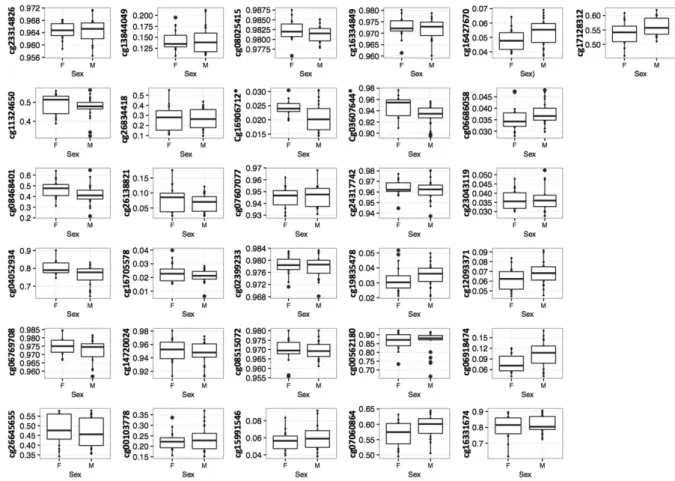
After correction for cellular heterogeneity and multiple testing, thirty-one CpGs were differentially methyl-ated (FDR ≤ 0.05) between obese children and control subjects, 10 were hypermethylmethyl-ated, and 21 were hypo-methylated in obese compared to lean children (Table 2). The largest difference was observed for cg26834418 located in the promoter region (TSS1500) of the CHORDC1 gene (+ 13% in control subjects compare to obese children). This gene also showed two other probes differentially methylated in obese compare to lean children. Because of the relatively small numbers in the study and small differences in methylation levels for most of the significant CpG sites, we analysed the confounding variables age and sex. We found that the methylation of 5/31 and 1/31 of the identified CpG sites was correlated with respectively age or sex (Figs 1 and 2).
The distribution of the 31 CpGs showed that DNA methylation variation was distributed over the CpG island shores, and that although CGI are enriched on the array (31% of Illumina probes are in CGI); only 16% of our obesity–associated CpGs were located in CGI, compared to 38% in shores (22% in S-Shore and 16% in N-shore) (p = 0.016, Pearson’s Chi-squared test) (Fig. 3A). The genomic distribution of the 31 CpGs in comparison to all the probes located on the 450 K BeadChip array with respect to gene structure is shown in Fig. 3B. We also found an enrichment of differentially methylated CpGs outside promoter and gene body (p = 2.10−4, Pearson’s
Chi-squared test) (Fig. 3B).
Since obesity is an extremely heterogeneous disease, we then chose to focus only on the extremely obese chil-dren (BMI z-score ≥ 3.5).
Identification of differentially methylated CpGs associated with severe childhood obesity.
We analysed next DNA methylation marks only in the 11 severely obese children of the group. We found 151 differen-tially methylated CpGs (q.value ≤ 0.05), 69 were hypermethylated, and 82 were hypomethylated in severely obese patients compared to lean controls (Supplemental Table 2). Of these 151 differentially methylated CpGs, ten had a greater than 10% difference in methylation between the case and control groups. The most significant difference was observed for a cg27590049 located in the LMX1A (LIM Homeobox Transcription Factor 1, Alpha)16; and thelargest difference was observed for a cg07944420 located on the gene body of ACSF3 (Acyl-CoA Synthetase Family
Member 3) that showed a decreased by 17% of methylation level in control subjects compared to obese children.
Thirteen of the 151 CpGs were common to our first analysis comparing obese children all together, 18 seems specific to moderately obese children and 138 to severely obese children (Fig. 3C).
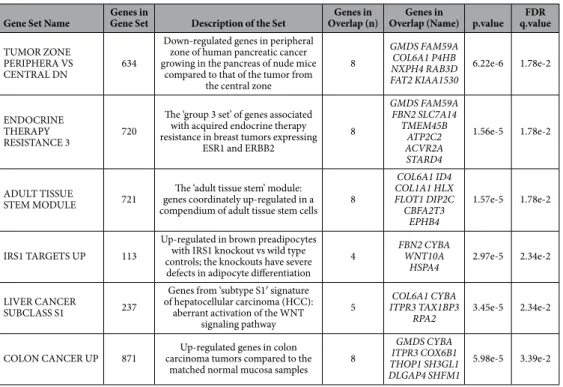
Next, we performed a gene set enrichment analysis (GSEA) to explore the potential of shared biologically relevant pathways among the obesity-associated methylation events. Seven pathways showed a significant enrich-ment including “IRS1 Target Genes” and different cancer traits (Table 3).
The genomic distribution of these 151 differentially methylated CpGs in relation to CpG density (CGIs, shores, shelves, and open sea) was not clearly different from the whole array CpG distribution and there was no significant enrichment within specific gene regions (data not shown).
Discussion
In this study we aimed to identify obesity related methylation marks in peripheral blood leukocytes using a genome wide approach in youth obese children. The primary finding of this study was that most of the epigenetic marks are different in moderate and severe obesity. We identified respectively 18 and 138 differentially methylated CpGs between moderate or severe obese children and lean controls. As observed for genetic association studies, sampling individuals with extreme phenotypes can enrich the presence of epigenetic variations and can therefore lead to an increase in detection of these differences. Moreover, most of the differentially methylated CpGs was found within open seas or intergenic regions, consistently with previous findings showing that DNA methylation may be more dynamic outside CGIs.
Compare to previous studies10–13,17,18, we replicated the association between DNA methylation level and
obesity at 10 gene loci (ANKRD11: ankyrin repeat domain 11, AVPI1: arginine vasopressin-induced 1, CDK19:
transport 140, KIAA0753, LTBP1: latent transforming growth factor beta binding protein 1, MYOM2: myomesin 2, TBC1D8: TBC1 domain family, member 8). Among these genes, HDAC4 is an interesting candidate since recently,
Abu-Farha et al. showed a reduced expression of HDAC mRNA and protein in human obese subjects both in blood cells and adipose tissue19. This is consistent with clinical data in humans that associated the
haploinsuffi-ciency of HDAC4 with obesity20. In our study, we found a HDAC methylation level higher in obese children than
in controls.
Numerous genes found in our severe obese analysis were also associated with cancer. Many epidemiological and clinical studies have demonstrated that early obesity is an established risk factor for many cancers in later life21. Cross talk between macrophages, adipocytes, and epithelial cells occurs via obesity-associated hormones,
growth factor signalling, inflammation, vascular integrity processes, microenvironmental perturbations, and other mediators, which could enhance the cancer risk and/or progression22. Thus, the methylation changes in
childhood obesity could increase the risks for later cancer susceptibility.
Most of the identified genes are not expressed or do not have a relevant function in blood cells; whether these epigenetic marks in blood may reflect or correlate with methylation in more relevant tissues is not known. However, several studies showed that DNA methylation measured in whole blood is a marker for less accessible tissues that are directly involved in disease. For instance, Murphy et al. have shown for example that methyla-tion across the H19 DMRs (Differentially Methylated Regions) was similar across several tissues from divers
ID Sex (years)Age Weight (kg) Height (m) (kg/m2)BMI Z-scoreBMI Birth Weight
(g) Birth Height
(cm) (weeks)Term activity*Physical
Physical activity (hr/wk)* Dietary intake (kcal/day)** ob1 M 12.02 64.9 1.54 27.36 3.58 4400 54 41 YES 2.5 3230 ob2 M 11.48 74 1.59 29.27 4.15 3570 52.5 40 YES 4 2800 ob3 M 13.12 89 1.65 32.69 4.31 4310 52.5 39 YES 5 3000 ob4 F 7.62 32 1.3 18.93 2.9 2450 44 34 YES 1 1910 ob5 F 12.82 81.6 1.56 33.53 4.32 2900 48 40 YES 1.5 — ob6 F 13.11 66.6 1.61 25.69 2.58 3300 51 41 YES 6.5 — ob7 M 12.79 87.9 1.56 36.12 4.96 3700 50 40 YES 4 2900 ob8 F 12.06 60 1.57 24.34 2.6 2790 46.5 36 YES 1 2815 ob9 F 11.55 60.9 1.49 27.43 3.59 3610 51.5 41 NO — 3130 ob10 F 9.53 46.6 1.37 24.83 3.85 3250 50 41 YES 1 1660 ob11 M 5.49 28 1.21 19.12 2.71 4315 52.5 41 YES 1 1800 ob12 M 12.48 69 1.45 32.82 4.48 3100 — 36 YES 2 — ob13 F 8.34 36 1.29 21.63 3.4 4230 52.5 41 YES 1 2080 ob14 M 8.58 58.5 1.53 24.99 4.34 3050 48 40 YES 6 — ob15 M 9.46 53.6 1.41 26.96 4.43 3950 51 40 YES 6.5 2200 ob16 M 9.17 42 1.34 23.39 3.56 3300 49 — YES 2 2400 ob17 F 7.53 35.5 1.3 21.01 3.32 3310 50.5 39 YES 7 2550 ob18 F 9.72 37.7 1.33 21.31 2.64 3430 49 39 YES 2 1954 ob19 M 11.77 58.3 1.49 26.26 3.49 2760 46 36 NO — 2400 ob20 F 10.42 46.3 1.43 22.64 2.91 2660 47 38 YES 5 2200 Ctrl1 M 6.25 21 1.2 14.58 − 0.74 2790 49 — — — — Ctrl2 F 9.28 47 1.55 19.56 2.09 3650 52.5 — — — — Ctrl3 F 11.23 52 1.62 19.81 1.46 2960 47 — — — — Ctrl4 M 11.52 38 1.4 19.39 1.23 2800 — — — — — Ctrl5 F 13.00 41 1.51 17.98 − 0.07 2700 47 — — — — Ctrl6 F 12.84 48 1.58 19.23 0.67 — — — — — — Ctrl7 M 7.45 23.5 1.23 15.53 0 — — — — — — Ctrl8 F 6.03 22 1.22 14.78 − 0.31 3560 49.5 — — — — Ctrl9 M 6.66 25.1 1.2 17.43 1.45 3550 50 — — — — Ctrl10 M 10.00 37 1.49 16.66 0.19 2900 — — — — — Ctrl11 F 11.15 37 1.45 17.59 0.45 — — — — — — Ctrl12 M 7.59 28.2 1.32 16.18 0.41 — — — — — — Ctrl13 F 5.95 15 1.08 12.86 − 2.08 3040 49 — — — — Ctrl14 M 9.27 30 1.4 15.31 − 0.51 2630 52 — — — — Ctrl15 M 10.16 32 1.4 16.33 − 0.02 3200 52 — — — — Ctrl16 M 11.28 33 1.39 17.08 0.2 — — — — — — Ctrl17 M 2.90 12 0.92 14.18 − 1.91 3260 51 — — — —
Table 1. Characteristic of obese and control children. *Data obtained from a self-completed questionnaire;
**A 24-hour dietary recall was conducted for all patients by a dietitian, based on individual interview with parents or caregivers.
www.nature.com/scientificreports/
embryonic origins23. Likewise, in non-imprinted loci, Talens et al. also found that DNA methylation levels did not
differ in blood and buccal cells, from mesodermal and ectodermal embryonic tissues, respectively24. The recent
work of Huang et al.25 identified 1,285 discordant and 1,961 concordant genes for methylation between blood and
adipose tissue; the discordant genes are enriched in biological functions related to immune response, leukocyte activation or differentiation, and blood coagulation. Moreover, epigenetic marks associated with type-2 diabetes26
or adiposity7 have also been identified in peripheral tissues.
There were several limitations to this study. The first limitation was that we used DNA from whole blood. To correct our methylation data for this weakness, we used a Houseman correction algorithm27. It must also be noted
that adjusting for cell composition makes impossible the process of replication and validation of the identified CpGs by pyrosequencing. Replication could also be accomplished if there exists an independent replication popu-lation; in this case the models could be re-applied. We tried to replicate our findings by running the available data-sets for common obesity (GEO DataSets: GSE25301, GSE43975, GSE44763, GSE73103) under the RefFreeEwas procedure, but we failed to find any associated CpGs after correction for cell heterogeneity, even those previously identified by the authors without cell heterogeneity correction.
The second limitation is that we cannot conclude about the existence of these epigenetic marks before the establishment of the obesity. While this lack of interpretability is inherent to the design of the cross-sectional case control study, the finding of methylation marks associated with the early stages of severe obesity in young patients may be of pathogenic relevance to certain features or complications of this disease. Indeed, the marks that have been found here could be used in a longitudinal study of the young patients in order to gain both biomarker and mechanistic insights. The longitudinal sampling of cells from adolescence to adulthood should further allow which of these epigenetic changes follow the development of the long term overt phenotype of severe obesity and its complications.
Our major strength was that all studied participants were children, aged from 3 to 13 years old, less subject to cofounding factors like medication or comorbidities, very common in adult obese patients.
Probes CHR UCSC RefGene Name UCSC RefGene Group Relation to UCSC CpG Island Methylation percent in obese children Methylation percent in control subjects p.value q.value
cg23314826 8 0.962 ± 0.003 0.965 ± 0.003 1.31e-08 0.003
cg11324650 3 Island 0.449 0.056 0.521 0.034 4.59e-08 0.005
cg08468401 3 0.390 0.070 0.501 0.087 7.09e-08 0.005
cg04052934 6 0.752 0.050 0.796 0.052 2.29e-07 0.012
cg06769708 20 DLGAP4 Body S_Shore 0.970 0.007 0.976 0.005 2.05e-07 0.012 cg19835478 21 COL6A1 TSS1500 Island 0.039 0.007 0.029 0.006 2.78e-07 0.013
cg26645655 3 0.426 0.062 0.502 0.071 3.23e-07 0.013
cg00562180 16 N_Shelf 0.891 0.021 0.793 0.110 5.87e-07 0.018
cg07060864 16 0.604 0.024 0.558 0.038 6.01e-07 0.018
cg13844049 1 0.131 0.018 0.166 0.045 6.36e-07 0.018
cg26834418 11 CHORDC1 TSS1500 S_Shore 0.206 0.087 0.324 0.095 7.21e-07 0.019 cg16427670 13 ARHGEF7 TSS1500 0.056 0.007 0.046 0.007 9.24e-07 0.021
cg16705578 3 Island 0.019 0.004 0.025 0.005 9.19e-07 0.021
cg26138821 11 CHORDC1 TSS200 S_Shore 0.054 0.031 0.093 0.031 9.61e-07 0.021
cg14720024 5 S_Shore 0.939 0.015 0.961 0.010 1.09e-06 0.023
cg00103778 20 N_Shore 0.202 0.028 0.264 0.054 1.36e-06 0.027
cg06686058 11 ADM 5′ UTR;1stExon N_Shore 0.039 0.005 0.034 0.004 1.44e-06 0.027 cg08025415 19 TLE2 Body N_Shelf 0.981 0.002 0.982 0.002 1.48e-06 0.027 cg16906712 6 HIST1H2BG;HIST1H2AE TSS1500;3′ UTR;1stExon S_Shore 0.019 0.004 0.024 0.003 1.53e-06 0.027 cg23043119 5 STARD4 TSS1500 S_Shore 0.039 0.006 0.033 0.005 1.61e-06 0.027 cg07607077 7 C7orf20 Body S_Shore 0.941 0.009 0.950 0.005 1.71e-06 0.027 cg02399233 11 NADSYN1 Body 0.977 0.004 0.979 0.003 2.23e-06 0.032
cg08515072 8 N_Shore 0.967 0.005 0.971 0.005 2.16e-06 0.032
cg12093371 10 N_Shore 0.073 0.009 0.058 0.010 2.16e-06 0.032
cg06918474 5 MARCH3 3′ UTR 0.110 0.031 0.084 0.049 2.38e-06 0.034
cg16331674 22 Island 0.843 0.048 0.785 0.063 2.56e-06 0.035
cg15991546 1 DPYD TSS200 Island 0.050 0.009 0.068 0.013 2.82e-06 0.036 cg17128312 19 FBXW9 Body N_Shore 0.572 0.028 0.537 0.036 2.79e-06 0.036
cg16334849 8 0.970 0.004 0.973 0.005 3.19e-06 0.040
cg03607644 8 0.929 0.018 0.950 0.014 3.88e-06 0.045
cg24317742 1 0.958 0.007 0.967 0.008 4.32e-06 0.048
Table 2. Differentially methylated CpGs in obese children. Table listing the differentially methylated CpG
probes with corresponding UCSC RefGene Name, group and group related to CpG Island, methylation percent in obese and control children, p.values and q.values after cell type estimate adjustments.
In conclusion, the identification of methylation changes in specific genes will provide important targets for further study into the underlying mechanisms and the therapeutic potential for childhood obesity.
Methods
Study participants.
Twenty obese children (5 to 13 years old) and equal numbers of control children (3 to 13 years old) were included in the study. The BMI for obese children (10 male) and lean children (11 male) was 26.0 ± 4.8 kg/m2 and 16.7 ± 2.2 kg/m2, respectively (Table 1). Age and gender-specific BMI Z-scores weredeter-mined by using the growth charts form the World Health Organization with a mean BMI Z-score of 3.6 ± 0.8 for obese children and 0.2 ± 1.1 for controls. Patients with monogenic or syndromic forms of obesity were excluded. To limit the risk of population stratification, all recruited children are of Caucasian ancestry assessed by family history and grandparents’ birthplace. All methods were carried out in accordance with relevant guidelines and regulations. Patients and controls were included in the study according to the French bioethics law with families being carefully informed and having signed a detailed informed consent. All protocols were agreed by French ethic boards (CODECOH DC-2013-1977, CPP C0-13-004, CCTIRS n°14-116bis, CNIL n°91 4228).
Infinium humanMethylation450 beadchip array.
DNA was extracted from whole blood cells of 20 case and 20 control subjects using Gentra DNA extraction kit (Qiagen). Genomic DNA (1 ug) from each of the 40 subjects was bisulphite-converted using Zymo EZ DNA Methylation-Gold kit (ZymoResearch) and the DNA was analysed using the Infinium HumanMethylation450 platform (Illumina, Inc.) by The Genotyping National Center (CNG, CEA, Evry, France).Infinium HumanMethylation450 BeadChip array data processing.
DNA methylation status of case and control subjects was established using Illumina Infinium HumanMethylation450 BeadChips that cover 485,764 cytosine positions of the human genome. Preprocessing and normalization involved steps of probe filter-ing, color bias correction, background subtraction and subset quantile normalization as previously described28.After these intra-sample normalization procedures, β -values were calculated. To avoid batch effect, all samples were processed together. Obese subjects were compared to control subjects, using t-tests.
Figure 1. Correlation between DNA methylation and age in 20 obese children and 17 controls at the 31 associated CpGs. *Significant correlation (p < 0.05), DNA methylation value in the y-axis and age in years in
www.nature.com/scientificreports/
Figure 2. Association between DNA methylation and sex in 20 obese children and 17 controls at the 31 associated CpGs. *Significant correlation (p < 0.05), DNA methylation value in the y-axis and sex (M = male,
F = female) in the x-axis.
Figure 3. Distribution of differentially methylated CpGs versus all CpGs sites on the Infinium
HumanMethylation450 BeadChip in relation to (A) CpG island regions; (B) the nearest gene regions. Chi-square analysis was performed to test over- or under-representation of sequence features among the differentially methylated CpGs, *P.value < 0.05. (C) Venn diagram of the identified CpGs in obese or severely obese children, below the 13 common CpGs.
Assessment of cell composition differences.
The R package minfi29 was used to estimate the fractionof CD8T-, CD4T-, NK- and B-cells, monocytes, and granulocytes in our 40 samples. This package allows for estimating cell fractions in Illumina 450 K methylation data from whole blood, based on the methylation data published for flow-sorted cells30, and algorithms27.
Cell heterogeneity correction for the methylation data analysis.
To correct our methylation data analysis for cell heterogeneity between samples, we used R package RefFreeEwas15. This package allows forcon-ducting EWAS while deconvoluting DNA methylation arising as mixtures of cell types. This method is similar to surrogate variable analysis, except that it makes additional use of a biological mixture assumption.
References
1. Flegal, K. M., Carroll, M. D., Ogden, C. L. & Curtin, L. R. Prevalence and trends in obesity among US adults, 1999–2008. JAMA 303, 235–241, doi: 10.1001/jama.2009.2014 (2010).
2. Ogden, C. L., Carroll, M. D., Kit, B. K. & Flegal, K. M. Prevalence of obesity and trends in body mass index among US children and adolescents, 1999–2010. JAMA 307, 483–490, doi: 10.1001/jama.2012.40 (2012).
3. Ogden, C. L. & Flegal, K. M. Changes in terminology for childhood overweight and obesity. Natl Health Stat Report 1–5 (2010). 4. Skinner, A. C. & Skelton, J. A. Prevalence and trends in obesity and severe obesity among children in the United States, 1999–2012.
JAMA Pediatr 168, 561–566, doi: 10.1001/jamapediatrics.2014.21 (2014).
5. Kelly, A. S. et al. Severe obesity in children and adolescents: identification, associated health risks, and treatment approaches: a scientific statement from the American Heart Association. Circulation 128, 1689–1712, doi: 10.1161/CIR.0b013e3182a5cfb3 (2013). 6. Clarke-Harris, R. et al. PGC1alpha promoter methylation in blood at 5-7 years predicts adiposity from 9 to 14 years (EarlyBird 50).
Diabetes 63, 2528–2537, doi: 10.2337/db13-0671 (2014).
7. Drummond, E. M. & Gibney, E. R. Epigenetic regulation in obesity. Curr Opin Clin Nutr Metab Care 16, 392–397, doi: 10.1097/ MCO.0b013e3283620f45 (2013).
8. Perkins, E. et al. Insulin-like growth factor 2/H19 methylation at birth and risk of overweight and obesity in children. J Pediatr 161, 31–39, doi: 10.1016/j.jpeds.2012.01.015 (2012).
9. van Dijk, S. J. et al. Epigenetics and human obesity. Int J Obes (Lond) 39, 85–97, doi: 10.1038/ijo.2014.34 (2015).
10. Wang, X. et al. Obesity related methylation changes in DNA of peripheral blood leukocytes. BMC Med 8, 87, doi: 1741-7015-8-87 (2010).
11. Almen, M. S. et al. Genome wide analysis reveals association of a FTO gene variant with epigenetic changes. Genomics 99, 132–137, doi: S0888-7543(11)00281-3 (2012).
12. Dick, K. J. et al. DNA methylation and body-mass index: a genome-wide analysis. Lancet 383, 1990–1998, doi: 10.1016/S0140-6736(13)62674-4 (2014).
13. Ding, X. et al. Genome-wide screen of DNA methylation identifies novel markers in childhood obesity. Gene 566, 74–83, doi: 10.1016/j.gene.2015.04.032 (2015).
14. Huang, R. C. et al. Genome-wide methylation analysis identifies differentially methylated CpG loci associated with severe obesity in childhood. Epigenetics 10, 995–1005, doi: 10.1080/15592294.2015.1080411 (2015).
15. Houseman, E. A., Molitor, J. & Marsit, C. J. Reference-free cell mixture adjustments in analysis of DNA methylation data.
Bioinformatics 30, 1431–1439, doi: 10.1093/bioinformatics/btu029 (2014).
16. German, M. S. et al. Localization of the genes encoding two transcription factors, LMX1 and CDX3, regulating insulin gene expression to human chromosomes 1 and 13. Genomics 24, 403–404, doi: 10.1006/geno.1994.1639 (1994).
17. Almen, M. S. et al. Genome-wide analysis reveals DNA methylation markers that vary with both age and obesity. Gene 548, 61–67, doi: 10.1016/j.gene.2014.07.009 (2014).
Gene Set Name Genes in Gene Set Description of the Set Overlap (n)Genes in Overlap (Name) p.valueGenes in q.valueFDR
TUMOR ZONE PERIPHERA VS
CENTRAL DN 634
Down-regulated genes in peripheral zone of human pancreatic cancer growing in the pancreas of nude mice
compared to that of the tumor from the central zone
8 GMDS FAM59A COL6A1 P4HB NXPH4 RAB3D FAT2 KIAA1530 6.22e-6 1.78e-2 ENDOCRINE THERAPY RESISTANCE 3 720
The ‘group 3 set’ of genes associated with acquired endocrine therapy resistance in breast tumors expressing
ESR1 and ERBB2
8 GMDS FAM59A FBN2 SLC7A14 TMEM45B ATP2C2 ACVR2A STARD4 1.56e-5 1.78e-2 ADULT TISSUE STEM MODULE 721
The ‘adult tissue stem’ module: genes coordinately up-regulated in a compendium of adult tissue stem cells 8
COL6A1 ID4 COL1A1 HLX FLOT1 DIP2C CBFA2T3 EPHB4 1.57e-5 1.78e-2 IRS1 TARGETS UP 113
Up-regulated in brown preadipocytes with IRS1 knockout vs wild type controls; the knockouts have severe defects in adipocyte differentiation
4 FBN2 CYBA WNT10A
HSPA4 2.97e-5 2.34e-2
LIVER CANCER
SUBCLASS S1 237
Genes from ‘subtype S1′ signature of hepatocellular carcinoma (HCC):
aberrant activation of the WNT signaling pathway
5 ITPR3 TAX1BP3 COL6A1 CYBA
RPA2 3.45e-5 2.34e-2
COLON CANCER UP 871 carcinoma tumors compared to the Up-regulated genes in colon matched normal mucosa samples 8
GMDS CYBA ITPR3 COX6B1 THOP1 SH3GL1 DLGAP4 SHFM1
5.98e-5 3.39e-2
Table 3. Gene set enrichment analysis of severe obese children associated CpGs. This table displays gene
www.nature.com/scientificreports/
18. Ollikainen, M. et al. Genome-wide blood DNA methylation alterations at regulatory elements and heterochromatic regions in monozygotic twins discordant for obesity and liver fat. Clin Epigenetics 7, 39, doi: 10.1186/s13148-015-0073-5 (2015).
19. Abu-Farha, M. et al. Proteomics analysis of human obesity reveals the epigenetic factor HDAC4 as a potential target for obesity.
PLoS One 8, e75342, doi: 10.1371/journal.pone.0075342 (2013).
20. Williams, S. R. et al. Haploinsufficiency of HDAC4 causes brachydactyly mental retardation syndrome, with brachydactyly type E, developmental delays, and behavioral problems. Am J Hum Genet 87, 219–228, doi: 10.1016/j.ajhg.2010.07.011 (2010).
21. Han, X. et al. Body mass index at early adulthood, subsequent weight change and cancer incidence and mortality. Int J Cancer 135, 2900–2909, doi: 10.1002/ijc.28930 (2014).
22. Hursting, S. D. Obesity, energy balance, and cancer: a mechanistic perspective. Cancer Treat Res 159, 21–33, doi: 10.1007/978-3-642-38007-5_2 (2014).
23. Murphy, S. K., Huang, Z. & Hoyo, C. Differentially methylated regions of imprinted genes in prenatal, perinatal and postnatal human tissues. PLoS One 7, e40924, doi: 10.1371/journal.pone.0040924 (2012).
24. Talens, R. P. et al. Variation, patterns, and temporal stability of DNA methylation: considerations for epigenetic epidemiology.
FASEB J 24, 3135–3144, doi: fj.09-150490 (2010).
25. Huang, Y. T. et al. Epigenome-wide profiling of DNA methylation in paired samples of adipose tissue and blood. Epigenetics 11, 227–236, doi: 10.1080/15592294.2016.1146853 (2016).
26. Toperoff, G. et al. Genome-wide survey reveals predisposing diabetes type 2-related DNA methylation variations in human peripheral blood. Hum Mol Genet doi: ddr472 (2011).
27. Houseman, E. A. et al. DNA methylation arrays as surrogate measures of cell mixture distribution. BMC Bioinformatics 13, 86, doi: 10.1186/1471-2105-13-86 (2012).
28. Touleimat, N. & Tost, J. Complete pipeline for Infinium((R)) Human Methylation 450 K BeadChip data processing using subset quantile normalization for accurate DNA methylation estimation. Epigenomics 4, 325–341, doi: 10.2217/epi.12.21 (2012). 29. Aryee, M. J. et al. Minfi: a flexible and comprehensive Bioconductor package for the analysis of Infinium DNA methylation
microarrays. Bioinformatics 30, 1363–1369, doi: 10.1093/bioinformatics/btu049 (2014).
30. Reinius, L. E. et al. Differential DNA methylation in purified human blood cells: implications for cell lineage and studies on disease susceptibility. PLoS One 7, e41361, doi: 10.1371/journal.pone.0041361 (2012).
Acknowledgements
Our thanks go to the study participants of the Epichild/Obgen study and staff for excellent technical assistance. This work was supported by an ANR (Agence Nationale de la Recherche) grant: DSS-2012 Epichild and a University Paris Sud (Paris 11) grant: “Attractivité 2015”.
Author Contributions
D.F. performed sample preparations, carried out analyses and wrote the manuscript. P.Y.B. helped in the analysis. M.B.P. performed sample preparations. F.L. and G.d.F. recruited cases and controls and provided blood samples. J.T. and C.B. ran D.N.A. methylation arrays. J.F.D., G.d.F. and P.B. provided intellectual input for the discussion and critically revised the manuscript. D.F. is the guarantor of this work and, as such, had full access to all the data in the study and takes responsibility for the integrity of the data and the accuracy of the data analysis. All authors read and approved the final manuscript.
Additional Information
Supplementary information accompanies this paper at http://www.nature.com/srep Competing Interests: The authors declare no competing financial interests.
How to cite this article: Fradin, D. et al. Genome-Wide Methylation Analysis Identifies Specific Epigenetic
Marks In Severely Obese Children. Sci. Rep. 7, 46311; doi: 10.1038/srep46311 (2017).
Publisher's note: Springer Nature remains neutral with regard to jurisdictional claims in published maps and
institutional affiliations.
This work is licensed under a Creative Commons Attribution 4.0 International License. The images or other third party material in this article are included in the article’s Creative Commons license, unless indicated otherwise in the credit line; if the material is not included under the Creative Commons license, users will need to obtain permission from the license holder to reproduce the material. To view a copy of this license, visit http://creativecommons.org/licenses/by/4.0/