HAL Id: hal-03190522
https://hal-amu.archives-ouvertes.fr/hal-03190522
Submitted on 6 Apr 2021
HAL is a multi-disciplinary open access
archive for the deposit and dissemination of
sci-entific research documents, whether they are
pub-lished or not. The documents may come from
teaching and research institutions in France or
abroad, or from public or private research centers.
L’archive ouverte pluridisciplinaire HAL, est
destinée au dépôt et à la diffusion de documents
scientifiques de niveau recherche, publiés ou non,
émanant des établissements d’enseignement et de
recherche français ou étrangers, des laboratoires
publics ou privés.
Distributed under a Creative Commons Attribution| 4.0 International License
Ca2+ signaling promotes audiogenic seizures,
attentional and cognitive deficits in mice
Ilaria Bertocchi, Ahmed Eltokhi, Andrey Rozov, Vivan Chi, Vidar Jensen,
Thorsten Bus, Verena Pawlak, Marta Serafino, Hannah Sonntag, Boyi Yang,
et al.
To cite this version:
Ilaria Bertocchi, Ahmed Eltokhi, Andrey Rozov, Vivan Chi, Vidar Jensen, et al.. Voltage-independent
GluN2A-type NMDA receptor Ca2+ signaling promotes audiogenic seizures, attentional and cognitive
deficits in mice. Communications Biology, Nature Publishing Group, 2021, 4,
�10.1038/s42003-020-01538-4�. �hal-03190522�
Voltage-independent GluN2A-type NMDA
receptor Ca
2
+
signaling promotes audiogenic
seizures, attentional and cognitive de
ficits in mice
Ilaria Bertocchi
et al.
#The NMDA receptor-mediated Ca
2+signaling during simultaneous pre- and postsynaptic
activity is critically involved in synaptic plasticity and thus has a key role in the nervous
system. In GRIN2-variant patients alterations of this coincidence detection provoked complex
clinical phenotypes, ranging from reduced muscle strength to epileptic seizures and
intel-lectual disability. By using our gene-targeted mouse line (Grin2a
N615S), we show that
voltage-independent glutamate-gated signaling of GluN2A-containing NMDA receptors is associated
with NMDAR-dependent audiogenic seizures due to hyperexcitable midbrain circuits. In
contrast, the NMDAR antagonist MK-801-induced c-Fos expression is reduced in the
hip-pocampus. Likewise, the synchronization of theta- and gamma oscillatory activity is lowered
during exploration, demonstrating reduced hippocampal activity. This is associated with
exploratory hyperactivity and aberrantly increased and dysregulated levels of attention that
can interfere with associative learning, in particular when relevant cues and reward outcomes
are disconnected in space and time. Together, our
findings provide (i) experimental evidence
that the inherent voltage-dependent Ca
2+signaling of NMDA receptors is essential for
maintaining appropriate responses to sensory stimuli and (ii) a mechanistic explanation for
the neurological manifestations seen in the NMDAR-related human disorders with GRIN2
variant-meidiated intellectual disability and focal epilepsy.
https://doi.org/10.1038/s42003-020-01538-4
OPEN
#A list of authors and their affiliations appears at the end of the paper.
123456789
N
-methyl-
D-aspartate
receptors (NMDARs) play an
essential role in the survival, differentiation, and
migra-tion of neurons, as well as in the formamigra-tion and
stabili-zation of synapses and neuronal circuits both during development
and in adulthood
1–5. The critical role of NMDARs is based on (I)
their slow response to the major excitatory neurotransmitter
L
-glutamate, (II) the voltage-dependent current block by
extra-cellular Mg
2+, and (III) their high Ca
2+permeability
6,7(for a
recent review see ref.
8). By combining these three features,
NMDARs provide a precise and elegant molecular mechanism for
the activation of Ca
2+-dependent postsynaptic second messenger
cascades, which trigger specific intracellular responses
9,10. In
turn, these responses are necessary for the experience-dependent
priming of neural networks
11.
For several decades the precise coincidence detection of pre- and
postsynaptic activity by NMDAR-dependent Ca
2+signaling has been
postulated to be of crucial importance for learning and adapting to
environmental stimuli. However, this has rarely been tested directly
at the behavioral level
12,13. By introducing the well-characterized
GluN2A(N615S) mutation (previously called N596)
14,15into the
mouse genome, we were able to study the effects of an inappropriate
glutamate-induced Ca
2+influx through GluN2A-type NMDARs,
even at resting potentials, on synaptic plasticity, activity-induced
c-Fos expression, neuronal network activity in the hippocampus and,
lastly, on behavior. This analysis had not been possible in previous
studies with gene-targeted Grin2a
(N614Q)mice that died for unknown
reasons 2 weeks after birth
12.
The molecular components responsible for the Mg
2+-regulated
Ca
2+influx through the channel are localized at the tip of the ion
pore of heterotetrameric NMDARs. The immobile ion pore is
assembled from four P-loop structures in the M2 membrane
segments
of
NMDAR
subunits:
i.e.
two
obligatory
GluN1 subunits and two from the GluN2(A–D) or GluN3(A,B)
subunit families (for a review see ref.
16). Within this complexity,
GluN1/2-receptors are the most abundant NMDAR subtypes
throughout the central nervous system
17–19. In these NMDAR
subtypes, an asparagine amino acid residue in the GluN1 subunits
(N614, labeled previously N598 (ref.
20)) and two neighboring N
residues in the GluN2 subunits (N614 and N615, labeled
pre-viously N595 and N596 (ref.
15)) located at the tip of the P-loops,
build the narrow constriction of the ion channel pore, and
dif-ferentially modulate Mg
2+block and Ca
2+permeability
14,15,21.
The amino acid substitutions GluN1(N614Q) and GluN1
(N614R) abolished or reduced both the Mg
2+block and Ca
2+permeability of all NMDARs. This caused the premature death of
the respective mutant mice due to respiratory failure
22, as
described in mice completely lacking NMDARs (Grin1
–/–)
23. The
importance of precise NMDAR signaling for the establishment of
autonomic pattern activity in neuronal circuits is further
emphasized by Grin2b knockout mice. In GluN2B-deficient pups,
the trigeminal neuronal pattern formation is impaired and the
pups starve to death within the
first days after birth due to the
lack of suckling responses
24.
The NMDAR function as a coincidence detector is generally
identified with the induction of long-term potentiation (LTP), the
dominant experimental model of synaptic plasticity
25. The
voltage-controlled Mg
2+block is essential for this
activity-dependent NMDAR signaling
10. In recombinant GluN1/2A
NMDARs the Mg
2+block is predominantly determined by the
asparagine amino acid residue GluN2A(N615). In oocytes and
HEK293 cells expressing recombinant GluN1/GluN2A(N615S)
heterodimeric receptors, the GluN2A(N615S) mutation led to a
pronounced attenuation of the Mg
2+block and a 1.4-fold
increased Ca
2+permeability
14,15. Notably, a similar Mg
2+block
attenuating point mutation (c.1841A>G, p.Asn615Ser) at the
identical position of the GluN2A subunit was found in two
unrelated young female patients who suffered from epileptic
seizures, intellectual disability (ID), moderate hypotonia, and
speech/language disorders
26,27.
To unravel the functional contributions of the
voltage-dependent Mg
2+block in neurological disease, brain
physiol-ogy, and behavior, we generated and analyzed heterozygous and
homozygous gene-targeted mice with global Grin2a
(N615S)expression (Grin2a
+/Sand Grin2a
S/S, respectively). The viability
and good health of Grin2a
+/Sand Grin2a
S/Smutant mice allowed
us to resolve the functional consequences of this mutation,
par-ticularly for seizure susceptibility, hippocampal plasticity,
hip-pocampal oscillatory activity, and in cognitive performance
during simple and complex associative learning tasks. Thus,
experimental results show that the voltage-dependent Ca
2+sig-naling of GluN2A-type NMDARs is of particular importance for
the tight temporal control of attentional processes, which
becomes especially important when there are spatial and/or
temporal discontiguities between relevant cues and behaviorally
relevant outcomes.
Results
Generation of GluN2A(N615S)-expressing mice. Heterologous
expression of GluN2A(N615S) (Fig.
1
a) with GluN1
demon-strated a reduced Mg
2+block of GluN1/2(N615S) receptors in
the presence of 1 and 4 mM of Mg
2+at hyperpolarized
mem-brane potentials when compared with wild-type NMDARs
(Fig.
1
b). In the absence of Mg
2+, short glutamate applications
(20 ms) activated mutated and wild-type NMDAR channels with
comparable current amplitudes and similar activation (rise time)
and deactivation kinetics. During prolonged glutamate
applica-tions (600 ms) slower desensitization kinetics were obvious for
the GluN1/2A(N615S) compared to GluN1/2A heterodimeric
receptors (Fig.
1
b and Supplementary Table 1).
By classical gene-targeted replacement
28we inserted the
c.1841A>G mutation at the homologous position in exon 10,
and thus replaced the Grin2a asparagine codon (AAT, N615)
with a codon for serine (AGT) (Fig.
1
c and Supplementary Fig. 1).
The Grin2a cDNA sequence analysis of total brain mRNA of
heterozygous Grin2a
+/Smice together with the comparable
GluN2A immunosignals in forebrain extracts of Grin2a
+/+and
Grin2a
S/Slittermates verified that adult mice expressed the
Grin2a
(N615S)and Grin2a
+alleles at the same level (Fig.
1
d, e).
We also observed in forebrain extracts statistically comparable
levels of the GluA1 subunit of the
amino-3-hydroxy-5-methyl-4-isoxazolepropionic acid receptor (AMPAR), the postsynaptic
marker protein PSD95 and the phosphorylated form of
α-CaMKII in Grin2a
S/S, Grin2a
+/s, and Grin2a
+/+mice. However,
GluN2B levels were significantly higher in the membrane fraction
but not in the total forebrain fraction from homozygous Grin2a
S/Smouse brains when compared to heterozygous and wild-type
littermates (Fig.
1
e and Supplementary Fig. 2).
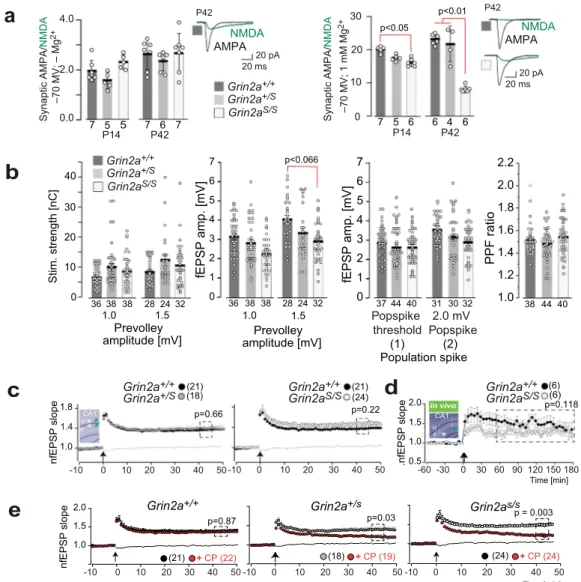
Regular glutamatergic signal transmission but increased
GluN2B-type LTP in GluN2A(N615S)-expressing mice. Patch
clamp recordings in CA1 pyramidal cells showed that the
GluN2A(N615S) subunits are functionally incorporated in
synaptic NMDARs. At
–70 mV and in the absence of extracellular
Mg
2+, the synaptic AMPA/NMDA current ratio and the
indivi-dual peak of AMPAR and NMDAR currents were similar in
CA1 cells from Grin2a
S/S, Grin2a
+/S, and Grin2a
+/+mice
(Fig.
2
a, left). However, the presence of GluN2A(N615S) in
synaptic NMDAR was indicated by the decreased AMPAR/
NMDAR response ratio detected in Grin2a
S/Smutants in the
presence of 1 mM Mg
2+(Fig.
2
a, right). This NMDAR-induced
compared to postnatal day 14 (P14), in accordance with the
increasing
developmental
Grin2a
expression
profile after
birth
18,29(Fig.
2
a, right). Thus, the homozygous Grin2a
S/Smice
express significant amounts of synaptic
GluN2A(N615S)-con-taining NMDARs with reduced voltage dependence.
To directly assess changes in excitatory synaptic transmission
and synaptic excitability, we recorded simultaneously in the apical
dendritic and soma layers in the CA1 region of hippocampal
slices from GluN2A(N615S)-expressing mice and wild-type
littermates. First, we measured the
fiber volley, the field excitatory
postsynaptic potential (fEPSP), and the population spike as a
function of different stimulation strengths. In our
field recordings
the stimulation strength required to induce pre-volley amplitude
of 1.0 or 1.5 mV was statistically unaltered in
GluN2A(N615S)-GluN2A
β
-actin
0
1
2
a
0
1
GluN1
GluN2A
GluA1
PSD95
pCaMKII
G
A
PDH
e
β
-actin
β
-actin
GAPDH
GAPDH
b
GluN1/2A
GluN1/2A(N615S)
Protein expression (forebrain)
HEK293 cells
COOH NH2(N615
S
)
1
3
4
Grin2a
+Grin2as
GluN2A(N615S)
GLVFNNSVPN
GLVFN
S
SVPN
1.0 - 1.0 - 2.0 - 80 - 40 40 V(mV) V(mV) Inorm Inorm 4 Mg2+ 1 Mg2+ 0 Mg2+ 200pA 100ms 100ms 200pA 100pA Glu 4 Mg2+ 1 Mg2+ 0 Mg2+ 0 Mg2+ 100pAGrin2a
S/SGrin2a
+/+ - 80 - 40 40 1.0 - 1.0 - 2.0 Glu1
0
out in2
LBD2
0
1
2
0
1
2
0
1
2
0
1
3
2
2
Grin2a
+/SMembrane fraction
Total lysate
GluN2B
GAPDH
1
0
2
GluN2B
β-actinβ-actin
p<0.001 p<0.01exon 10
Grin2a
+
N615
Grin2a
SN615S
Grin2a gene-targeting
loxP
c
exon 10
N615
A A C A A T T C T A A C AG T T CT R 0 -11N615S
N615
SpeI -14Grin2a
S/SGrin2a
+/Sc-DNA sequence
rel. pos.
N
/
S
Grin2a mRNA expression
(forebrain)
Grin2a
+/+d
Chr. 16
(3)
(3)
(3)
(4)
(3)
(7; source data)
expressing mice and showed only a trend towards lower
fEPSP amplitudes at a given pre-volley amplitudes of 1.5 mv in
Grin2a
S/Smice. Together with the similar paired-pulse ratio our
field recordings revealed no major alterations in CA3-to-CA1
synaptic transmission of Grin2a
S/Sand Grin2a
+/Smice (Fig.
2
b).
To analyze whether these voltage-independent GluN1/2A
(N615S) receptors can still induce synaptic plasticity, we analyzed
field LTP (fLTP) at CA3-to-CA1 synapses in the different Grin2a
genotypes. Here we found that the magnitude of hippocampal
fLTP in Grin2a
S/Sand Grin2a
+/Smice was unaffected ex vivo and
in vivo (Fig.
2
c, d
30), in contrast to the reduced fLTP found in
GluN2A-deficient mice and in mice lacking the GluN2A
intracellular C-terminal domain of the GluN2A subunit
31,32.
This suggests that the coincidence signaling of GluN1/2(N615S)
receptors is still operative. However, since the GluN2B antagonist
CP101,106 significantly reduced the fLTP in Grin2a
S/Sand
Grin2a
+/Smice but not in Grin2a
+/+littermates (Fig.
2
e), we
conclude that (i) pure GluN1/2A(N615S) receptors have a
reduced contribution to the long-term synaptic enhancement
after tetanic stimulation and (ii) the fLTP recorded in Grin2a
S/Sand Grin2a
+/Sis substantially mediated by GluN2B-containing
receptors.
This conclusion was strengthened by using four tetanic
stimulations (4 × 100 Hz), which can induce GluN2B-dependent
LTP in the absence of functional GluN2A
33,34. In comparison
with single tetanic stimulation, LTP was significantly increased
40–45 min after the 4 × 100 Hz stimulation in hippocampal slices
of both Grin2a
S/Sand Grin2a
+/Smice compared to WT control
littermates. This LTP increase was reduced by CP101,606
(Supplementary Fig. 3a), an effect that is reminiscent of the one
described for LTP reduction in juvenile (P14) wild-type mice
35.
This LTP was still completely NMDAR-dependent and could be
blocked by the NMDAR antagonist APV (Supplementary Fig. 3b).
Together, these results show the incorporation of GluN2A
(N615S) into synaptic NMDARs but reduced contribution of
GluN2A(N615S) receptors in LTP.
GluN2A(N615S) homozygous mice show altered home cage
behaviors but regular brain anatomy, no apoptosis or
neuro-degeneration. In contrast to other genetically modified mice with
altered NMDAR Ca
2+permeability and/or altered Mg
2+block
12,22,
we found that Grin2a
S/Sand Grin2a
+/Smice are viable and
long-living. However, Grin2a
S/Smice can be recognized by their reduced
body weight. Moreover, Grin2a
S/Smice showed poor nest building
and burrowing activities (Fig.
3
a), which can be indicators of
impairments
associated
with
hippocampal
dysfunction
36–38.
Grin2a
S/Smice also exhibited the paw- and limb-clasping reflex
(Fig.
3
b and Supplementary Data: Video 1)
39–41, reduced muscle
strength, lower activity in the running wheel (Fig.
3
c and
Supplementary Fig. 4a), and decreased grip strength and climbing
activity (Supplementary Fig. 4b–d). In marked contrast, the general
locomotor activity of Grin2a
S/Smice that we recorded automatically
in the LABORAS home cage
42was significantly increased in the
first 5 h of the night cycle (Supplementary Fig. 4d), although there
was no difference in the maximum and mean running speed
between genotypes. The number of rearing, grooming, and eating
events was not affected (Supplementary Fig. 4d). Our analysis in the
Catwalk test showed that Grin2a
S/Smice exhibit a regular walking
pattern (Supplementary Fig. 4e) and can achieve normal balance
scores in the stationary rod test (Supplementary Fig. 4f). Some
minor alterations in the base support of the hind limbs (the distance
of hind limbs during walking) of Grin2a
S/Smice (Supplementary
Fig. 4e) might contribute to the slightly delayed acquisition in the
rotarod test (Supplementary Fig. 4g). In heterozygous Grin2a
+/Smice, we found a trend towards reduced activity in the running
wheel and climbing (Supplementary Fig. 4a, d), and 20–30% of
Grin2a
+/Smice did show strong paw- and limb-clasping.
The reduced Mg
2+block of GluN1/2A(N615S) receptors could
conceivably permit a glutamate-induced, voltage-uncontrolled
Ca
2+influx into neurons that are sensitive to Ca
2+-induced
toxicity. However, we did not detect any signs of cytotoxicity or
neurodegeneration in Nissl-stained brain slices from adult
Grin2a
S/Smice (Fig.
3
d). Furthermore, no chromosomal DNA
degradation could be detected in the terminal deoxynucleotidyl
transferase dUTP nick end labeling (TUNEL) assay in the
hippocampus and adjacent cortical cell layers, suggesting that
there was no apoptosis or necrosis in Grin2a
S/Sbrains (Fig.
3
e).
Our Timm staining of mossy
fibers did not indicate hippocampal
sclerosis, a neuropathological marker of temporal lobe epilepsy in
humans and rodents
32,43,44, not even in 6-months-old Grin2a
S/Smice (Fig.
3
f). Lastly, the immunosignals of neuronal and
astrocytic markers NeuN and GFAP were comparable between
controls and Grin2a
S/Smice, as was the hippocampal
layer-specific distribution of calbindin, the interneuronal protein
parvalbumin, and the AMPAR subunit GluA1 (Fig.
3
g).
Grin2a
S/Smutant mice are highly sensitive to audiogenic
sei-zures (AGSs). Considering the presence of an epileptic phenotype
in the patient with the analogous GluN2A(N615K) mutation
27and the transient epileptiform discharges observed in
GluN2A-deficient mice
45, we analyzed the seizure susceptibility of GluN2A
(N615S)-expressing mice. When exposed to a high-frequency
acoustic stimulus (11 kHz), which is used for AGS induction in
DBA mice
46, all Grin2a
S/Smutants responded immediately after
tone onset with a stereotypic AGS response composed of wild
running followed by clonic seizures, tonic extension of limb
extremities, and respiratory arrest (RA). In contrast, no seizures
were observed for Grin2a
+/+control mice, whereas in Grin2a
+/SFig. 1 GluN2A(N615S) containing NMDAR expression in vitro and in vivo. a The position of N615 in the membrane segment M2 is depicted together with the three channel-forming trans-membrane segments M1, 3, and 4.b In HEK293 cells, recombinantly expressed GluN1/GluN2A and GluN1/GluN2A (N615S) channels were activated by fast glutamate application (1 mM; in the continuous presence of the co-agonist glycine, 10µM) at holding potentials from–100 to +40 mV in different extracellular Mg2+concentrations. NMDAR-mediated peak currents were normalized to those obtained at+40 mV. Data points represent mean ± SEM for n = 4–7 different HEK293 cells. Representative current traces evoked in 0 mM Mg2+at– 60 mV, with 20 and 600 ms applications, are shown below the IV plots and were used to determine the current kinetics (Supplementary Table 1). c Schematic view of the A to G replacement in exon 10 of the mouse Grin2a gene. d Reverse transcription PCR (RT-PCR)-sequence analyses of total brain mRNA show the A-to-G mutation in pos. 0 and two diagnostic silent mutations at pos.–11 and –14 in the pore loop encoding gene segment in Grin2a+/+, Grin2aS/S, Grin2a+/Smice.
In Grin2a+/Smice, the overlay of two different colored“nucleotide” peaks, at position 0, –11, and –14 indicate equimolar amounts of mRNA from the Grin2a+and the targeted Grin2aSalleles.e Immunoblots of forebrain protein lysates of 4-week-old mice (Supplementary Fig. 2) indicate no
genotype-specific differences of GluN1, GluN2A, and the AMPAR subunit GluA1 expression relative to the β-actin levels (p > 0.05). The levels of PSD95 and αCaMKII (in its phosphorylated state, pCaMKII) are also comparable between genotypes relative to the GAPDH expression. The GluN2B expression level in the membrane fraction was significantly increased in Grin2aS/Smice when compared to Grin2a+/+and Grin2a+/Smice but not in the levels of total protein
mice the audiogenic stimulus had lower penetrance and in one of
the
five epileptic heterozygotes (out of a total of 17 Grin2a
+/Smice tested), the seizures were not followed by RA (Fig.
4
a and
Supplementary Data: Video 2). In Grin2a
S/Smice, death from RA
could be prevented by chest massage within a few seconds after
the tonic phase, allowing us to visualize in revived Grin2a
S/Smice
90 min post-AGS a pronounced elevation of the immediate early
genes c-Fos and ARC, specifically in the ventromedial nucleus of
the hypothalamus, the medial amygdala, and in the inferior
col-liculus (IC) and periaqueductal gray (PAG) midbrain nuclei
(Fig.
4
b and Supplementary Fig. 5a). The very same AGS-specific
activity network, which excludes a major hippocampal
con-tribution, has been described in detail in other kindling-based
animal models for AGS
47,48. Indeed, the hippocampus of
Grin2a
S/Smice was spared from the AGS-induced increase in
c-Fos and ARC expression (Fig.
4
b and Supplementary Fig. 5a).
4.0 2.0 0.0 20 pA 20 ms 0 10 20 30 P42 AMPA NMDA P42 7 5 5 7 6 7 p<0.05 p<0.01 Synaptic AMPA/ NMDA g M – ; V M 0 7 – 2+
a
Grin2a+/Sc
p=0.03 p=0.22 (21) (24) 1.0 1.8 p=0.66 r CA1 r o 1.4 1.0 2.0 p=0.87 1.5d
in vivo p=0.118 CA1 r o 1.0 1.5 2.0 0.5 p = 0.003 Time [min] P S P Ef n e p ol se
(1) (2) Population spike P14 P42 P14 P42 7 5 6 6 4 6 0 10 20 30 38 36 38 28 2432 Stim. strength [nC] Prevolley amplitude [mV] 1.0 1.5 0 1 2 3 4 5 6 7 44 40 37 31 30 32 Popspike threshold 2.0 mV Popspikeb
(24) + CP (24) 1.0 1.5 0 1 2 3 4 5 6 7 36 38 38 28 2432 1.0 1.2 1.4 1.6 1.8 2.0 2.2 PPF ratio 38 44 40 P S P Ef ne p ol s -10 0 10 20 30 40 50 -10 0 10 20 30 40 50 -10 0 10 20 30 40 50 -10 0 10 20 30 40 50 -10 0 10 20 30 40 50 -60 -30 0 30 60 90 120 150 180 Grin2a+/+ Grin2aS/S Grin2as/s Grin2a+/s Grin2a+/+ (18) + CP (19) (21) + CP (22) P S P Ef n.e p ol s Time [min] fEPSP amp. [mV] fEPSP amp. [mV]Prevolley amplitude [mV] Grin2a+/S Grin2a+/+ Grin2aS/S AMPA NMDA 20 pA 20 ms (6) (6) (18)(21) Grin2a+/S Grin2a+/+ Grin2aS/S Grin2a+/+ Grin2aS/S Grin2a+/+ 40 Synaptic AMPA/ NMDA g M M m 1 ; V M 0 7 – + 2 p<0.066
Fig. 2 Hippocampal synaptic transmission and plasticity inGrin2aS/SandGrin2a+/Smice with the GluN2A(N615S) mutation. a (left) In the absence of extracellular Mg2+the synaptic AMPA/NMDA ratio of CA1 pyramidal cells in acute hippocampal slices is not altered in Grin2a+/Sand Grin2aS/Smice
compared to control littermates. (right) In the presence of extracellular Mg2+the strong reduction of the AMPA/NMDA ratio in Grin2aS/Smice relates to
the increased NMDA currents at CA1 synapses (Tukey’s test). Example traces are depicted to the right of each bar graph. Data from the same experimental group were pooled across animals and are presented as mean ± SEM (see also ref.35) with p < 0.05 being designated as statistically
significant. Numbers in bar graphs indicate the number of slices. b Paired-pulse facilitation at CA3-to-CA1 synapses excluded strong alterations of presynaptic function in mutant mice. The stimulation strengths (in nC) necessary to elicit a pre-volley of 1.0 and 1.5 mV and the resulting fEPSP amplitudes were comparable in all genotypes but showed only a trend towards lower fEPSP amplitudes recorded at 1.5 mV pre-volley amplitudes in Grin2aS/Smice. The fEPSP amplitudes necessary to elicit a just detectable population spike (1) and a population spike of 2 mV amplitude (2) and the paired-pulse facilitation ratio (PPF) at an interstimulus interval of 50 ms did not indicate any synaptic impairments in Grin2aS/Sand Grin2a+/Smice compared to WT littermates.
The number of slices is indicated in the bar graphs or in brackets.c Field LTP (fLTP) at CA3-to-CA1 synapses, induced by tetanic stimulation in slices (1 s; 100 Hz; arrow), was comparable in all three genotypes. The inset inc gives a schematic view of the stimulating (white arrow) and the recording (green arrow) electrode positions in str. radiatum (r) and str. oriens (o). d Similarly, CA1-to-CA3 fLTP (induction: 2 × 1 s; 100 Hz; arrow) in freely moving mice was comparable between Grin2aS/Sand Grin2a+/+mice. The inset shows a Nissl-stained slice of one recorded mouse post mortem.e In mutant mice, but not in control littermates, the GluN2B-containing NMDAR contributes significantly to the magnitude of LTP, since LTP was significantly reduced by the GluN2B-specific antagonist CP101,106 (CP). Recordings of the non-tetanized control pathway in c and e are given as dashed lines. Error bars represent mean ± SEM (for statistics: Supplementary Statistics to Fig. 2).
Together, our data show that increased neuronal excitatory
activity in brainstem, midbrain, and extra-hippocampal forebrain
regions is associated with AGS in mice with voltage-uncontrolled
Ca
2+signaling via GluN2A(N615S)-containing NMDARs.
AGSs in
Grin2a
S/Smice are rescued by pre-treatment with
NMDAR antagonists. In several animal models, AGS can be
prevented by pre-treatment with NMDAR antagonists (for a
recent review see ref.
49). Accordingly, a single i.p. injection of
memantine (5 mg/kg) was sufficient to abolish AGS in our
Gri-n2a
S/Smutants. The AGS-RA rate dropped from 100% in
vehicle-treated Grin2a
S/Smice down to 0% in memantine-injected mice,
when tested 3 h after injection (Fig.
4
c). The typical AGS-induced
c-Fos expression could not be detected in brains of
memantine-treated, AGS-resistant Grin2a
S/Smice (Fig.
4
d and Supplementary
Fig. 5b). The audiogenic stimulation was then repeated on
the same memantine-treated mice on subsequent days. The
pharmacological blockade of AGS lasted up to 3 days in some
Grin2a
S/Smice (three out of six mice; Fig.
4
c). When we tested
Nuclease treated 0.5
TUNEL
e
NeuN GFAP ori rad mol CBd
g
CA1 PV GluA1Grin2a
+/+Grin2a
S/S 1Timm staining
f
0.2 IML OML 0.05 CA1 CA1 DG CA3Grin2a
S/SGrin2a
S/SGrin2a
+/+ 0.5Grin2a
+/+Grin2a
S/Sb
Nissl
a
c
1 2 3 4 5Nest building score
Burrowed food [g x 100] 13 12 16 2 1 0 p<0.001 p<0.001
in 2 h
in 18 h
0 19 24 22 19 24 22Grin2a
S/S Body weight (g) 20 10 p<0.01 11 1019 30 0 40 50Grin2a
+/+Grin2a
S/SGrin2a
+/SGrin2a
+/+Grin2a
Grin2a
+/S+/+Running wheel total distance [km] 8 8 8 p<0.01 0 8 12 4
Grin2a
S/S(N>50)
2 cmFig. 3Grin2aS/Smice are viable and show no signs of neurodegeneration or altered brain structure. a Grin2aS/Smice had a reduced body weight (by
18% in adults), significantly lower score in nesting and in overnight burrowing activity (filled circles: 30-week-old mice, white dots: 18-week-old mice). b Grin2aS/Smice showed the clasping reflex. c During the 12 h dark phase on the Lafayette running wheel the running distance is reduced in Grin2aS/Smice.
d Nissl staining revealed unaltered cell density throughout the brain (top) and layering of hippocampal subfields, including CA1 (bottom), in Grin2aS/Smice
compared to Grin2a+/+. Error bars represent mean ± SEM.e In the TUNEL assay no apoptotic cells could be detected in the hippocampus of Grin2aS/S
mice, compared to the staining of the nuclease-treated positive control slice.f No aberrant mossyfiber sprouting in either genotype in the dentate gyrus inner (IML) and outer molecular layer (OML) can be found by Timm staining of coronal sections.g The distribution of NeuN-positive neurons and of GFAP-positive glial cells are indistinguishable between Grin2aS/Sand Grin2a+/+mice. Mossyfiber projections visualized by anti-calbindin (CB) staining, as well as
numbers of parvalbumin (PV)-positive interneurons are similar between both genotypes. Anti-GluA1 immunosignal in all hippocampal layers is comparable between brain sections of Grin2aS/Smice and control littermates. CA1 cornu ammonis region 1, CA3 cornu ammonis region 3, DG dentate gyrus, mol
stratum moleculare, ori stratum oriens, rad, stratum radiatum. Scale bars ind–g are in mm. The number of animals is given below the bars. For the Nissl stain, Tunnel test and Timm stain 3 mice were used per genotype. For the immunohistological analysis of glialfibrillary acidic protein (GFAP), neuronal nuclear antigen (NeuN), Calbindin (CB), and Parvalbumin (PV)five mice and for the GluA1 immunofluorescence stain, three mice were used (for statistics: Supplementary Statistics to Fig. 3).
with an alternative NMDAR blocker, MK-801, at low doses (0.2
mg/kg i.p.), the AGS inhibition was similarly effective and even
longer lasting (Fig.
4
e). The efficiency of MK-801 in reducing the
incidence of AGS was highly significant 18 h post-injection and
lasted up to 4 days in half of the MK-801-treated Grin2a
S/Smice
(N
= 4). Again, AGS-resistant, MK-801-injected Grin2a
S/Smice
showed no c-Fos induction in those brain regions normally
associated with AGSs (Fig.
4
f). The pharmacological rescue of
AGS in GluN2A(N615S)-expressing mice points to a direct
involvement of the aberrant NMDAR signaling in the exaggerated
a
-20 Time [sec] 0 20 40 60 80Grin2a
+/+(+ 11 kHz; no AGS)
c-Fos DAPI PVT MeA VMH c-Fose
100 0 20 40 60 80 100 VMH IC HPC PAG IC PAGGrin2a
S/S (17)Grin2a
+/S (17)Grin2a
+/+ (13) 0 20 40 60 80100 p<0.05 p<0.0001 Vehicle (4) MK-801 (4) 11 kHz p<0.04 5 7 100 0 5 5 2 i.p. Time [h]+ MK-801 (0.2 mg/kg; +11 kHz; no AGS)
0.2 0.2 IC VMH HPC MeA VMHGrin2a
S/Sb
f
Grin2a
S/S(+ 11 kHz; + AGS/RA)
Grin2a
S/S+ Vehicle (+ 11 kHz; AGS/RA positive)
11 kHz
d
c
Vehicle (5) Memantine (8) 11 kHz p<0.002 0 20 40 60 80 100AGS-induced
respiratory arrest [%]
10 20 30 40 50Grin2a
S/SGrin2a
S/S+ Vehicle (+ 11 kHz; AGS/RA positive)
PVT
AGS-induced
respiratory arrest [%]
AGS-induced
respiratory arrest [%]
MeA VMH MeA VMH PVT PVT Cx Cx HPC HPC 0.3 c-Fos+ Memantine (5 mg/kg; +11 kHz; no AGS)
0.2 i.p. Time [h]Fig. 4Grin2aS/Smice are susceptible to brainstem-derived AGS that can be rescued by NMDAR antagonists. a Mortality curve showing that none of the Grin2a+/+controls were affected, while audiogenic seizures (AGSs) followed by respiratory arrest (RA) were induced in all Grin2aS/Smice and in a subset
of heterozygous Grin2a+/Smutants during the 11 kHz tone exposure [4 repetitions × 20 s tone, 2 s brake; pink squares; p < 0.0001 by Log-rank (Mantel–Cox) test]. b The c-Fos immunoreactivity was specifically increased in the hypothalamus (VMH), the inferior colliculus (IC), and periaqueductal gray (PAG) but not in the hippocampus (HPC) of a resuscitated Grin2aS/Smouse 90 min after AGS when compared to tone-exposed Grin2a+/+
littermates.c Memantine i.p. injection in Grin2aS/Smice, 3 h before tone exposure, rescued AGS susceptibility in Grin2aS/Smice. The rescue effect could
still be observed in four out of eight, and in two out of eight, mice 27 and 51 h after memantine treatment, respectively.d Increased c-Fos immunofluorescence (in grayscale) in the medial amygdala (MeA) and the VMH of a Grin2aS/Sanimal with AGS (saline injection) compared to a
memantine rescued Grin2aS/Slittermate. In the paraventricular nucleus of the thalamus (PVT), the hippocampus (HPC) and cortex (Cx) there was no
difference in c-Fos expression between memantine-injected and saline-injected animals (forfluorescence images, see Supplementary Fig. 5). e As in Fig.4c but now MK-801 and saline are used for pre-treatment. The MK-801 effect was longer lasting compared to memantine and one out of four animals showed resistance to tone exposure even 4 days after MK-801 injection.f Decreased c-Fos DAB immunosignal in an MK-801 AGS-rescued Grin2aS/Sanimal
(bottom) in the medial amygdala (MeA), the VMH and the PVT when compared to saline-injected Grin2aS/Slittermate (top). Scale bars are in mm (for
pathological response to a stressful, acoustic stimulus. This result
is also in accordance with the resistance of GluN2A-deficient
mice to audiogenic-like seizures induced by electrical stimulation
of the principal midbrain nucleus, the IC
50.
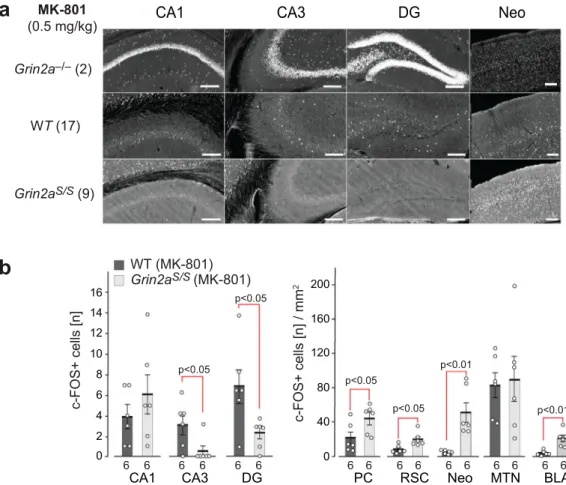
Altered drug-induced c-Fos expression in brains of
Grin2a
S/Smice. Next, we wondered whether alterations in excitatory
activity could also be observed in the hippocampus of Grin2a
S/Smice. As we have previously described
51,52, Grin2a
–/–mice
dis-played a robust and significantly increased excitation in
hippo-campal neurons—visualized by the number of c-Fos-expressing
neurons 60–90 min post-MK-801 treatment compared to
wild-type controls (Fig.
5
a). Now we found in neurons of Grin2a
S/Smice exactly the opposite: a reduced excitation. We observed only
sparsely distributed c-Fos immunoreactive cells in all
hippo-campal subfields in Grin2a
S/Smice, and their number was even
lower in both CA3 and DG when compared to MK-801-treated
wild-type mice (Fig.
5
a, b). However, in several
extra-hippocampal regions, like the piriform cortex, the retrosplenial
cortex, the neocortex, and the basolateral amygdala, but not in the
midline thalamic nuclei, c-Fos expression was increased after
MK-801 injection in Grin2a
S/Smice compared to WT controls
(Fig.
5
b and Supplementary Fig. 6a, b). Since the NMDAR
antagonists MK-801 and memantine reside within the channel
vestibule, snuggling into the binding pocket
53, and memantine, as
well as the MK-801 blockade of NMDARs, is reduced in
recombinantly expressed NMDARs that carry mutations at
ana-logous positions in the pore loop (e.g. GluN2A(N615K) GluN2A
(N615Q) and GluN2B(N615Q))
54,55, it seems most likely that
blockade of activity-responding GluN1/2B receptors is
respon-sible for the genotype-specific MK-801-induced c-Fos expression.
The MK-801-mediated inhibition of GluN1/2B activity of
GABAergic interneurons has been proposed as a causal
mechanism for the disinhibition of CA1 neurons in
GluN2A-deficient mice
56. Thus and in turn, the constant
glutamate-triggered GluN1/2A(N615S) Ca
2+signaling may promote the
inhibition of principal cells in the hippocampal pathways.
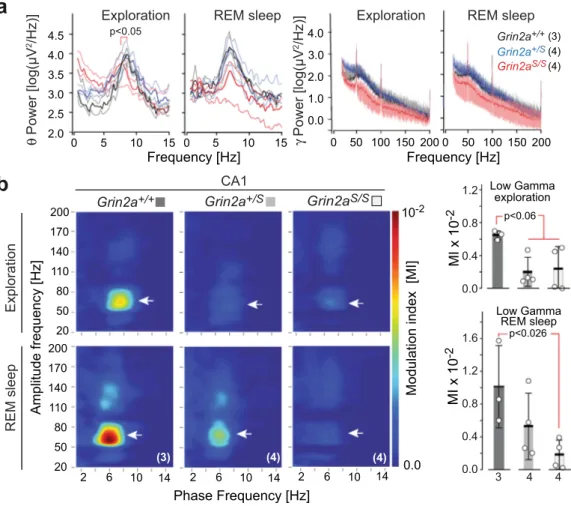
GluN2A(N615S) expression impairs synchronization of
hip-pocampal activity. To provide additional evidence for altered
hippocampal activity in GluN2A(N615S)-expressing mice, we
next analyzed neuronal activity synchronization, which is known
to depend critically on NMDAR signaling
57–60. Our in vivo
recordings of hippocampal local
field potentials in freely moving
animals revealed that the average theta range was similar for
wild-type and Grin2a
+/Smice
—at 8.61 ± 0.07 and 8.75 ± 0.28 Hz,
respectively— whereas in Grin2a
S/Smice the theta range peak
frequency was reduced to 7.43 ± 0.24 Hz. Interestingly, during
p<0.05
a
MK-801
(0.5 mg/kg)
CA1
CA3
DG
Neo
WT (MK-801)
c-FOS+ cells
[n] / mm
2 p<0.05 p<0.05 p<0.01 p<0.01PC
RSC
Neo
MTN
BLA
0 40 80 120 200 160b
c-FOS+ cells [n]
0 2 4 6 8 10 p<0.05CA1
CA3
DG
12 14 16Grin2a
S/S(MK-801)
Grin2a
S/S(9)
Grin2a
–/–(2)
WT (17)
6 6 6 6 6 6 6 6 6 6 6 6 6 6 6 6Fig. 5 MK-801-induced c-Fos expression is reduced in DG granular and CA3 pyramidal cells ofGrin2aS/Smice. C-Fos expression 120 min after i.p. injection of MK-801.a C-Fos DAB immunosignals are depicted for one representative brain section of the different genotypes as indicated. The original images, including the cortical regions and results of PBS injected animals, are presented in Supplementary Fig. 6. The number of mice analyzed is given in brackets.b For quantitative comparisons the total numbers of c-Fos-positive cells in the cellular layers of the hippocampus were counted. C-Fos-positive cells in extra-hippocampal regions are given per mm2. Slices from six mice per genotype were used for the statistical analyses (two-tailed t-tests) and error
bars represent mean ± SEM. CA1 and CA3 cornu ammonis regions 1 and 3, DG dentate gyrus, PC piriform cortex, RSC retrosplenial cortex, Neo neocortex, MTN midline thalamic nuclei, BLA basolateral amygdala. All scale bars: 0.2 mm.
rapid eye movement (REM) sleep we observed no significant
differences between the three genotypes (Fig.
6
a). Thus, the leaky
Mg
2+block of GluN2A(N615S)-containing NMDARs in
Grin2a
S/Smice has a significant effect on theta oscillations during
exploratory behaviors but not during REM sleep, suggesting that
this effect may be due to differences related to specific behavioral
state-dependent activity
61,62.
A further impairment of hippocampal oscillations in GluN2A
(N615S)-expressing mice became apparent when we analyzed the
coupling between the phase and the amplitude of slow and fast
oscillations, as measured by the modulation index (MI)
63–66.
Grin2a
+/+controls showed the typical phase–amplitude coupling
patterns of hippocampal networks, with MI values varying
between 0.006 and 0.007 in awake animals and 0.006 and 0.016
in REM sleeping mice
67,68(Fig.
6
b). Compared to control
animals, the MI values for Grin2a
S/Sand Grin2a
+/Sanimals
dropped down significantly to 0.0001–0.005 during exploration.
In REM sleep the MI reduction was significant only for Grin2a
S/Smice, dropping down to the range 0.0002–0.004, confirming a
robust disruption of complex hippocampal oscillation patterns.
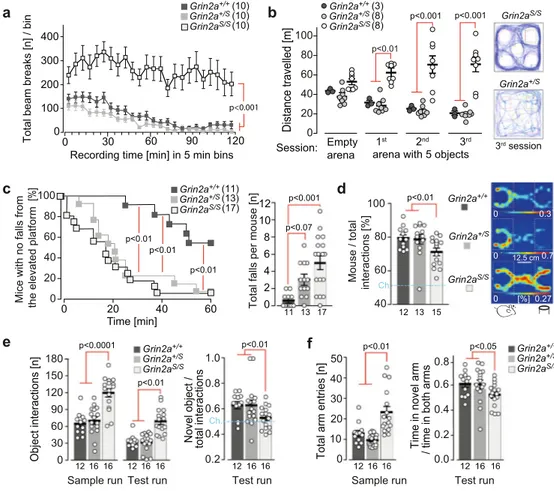
Grin2a
S/Smice are hyperactive and exhibit abnormal and
dysregulated attention. To comprehend the impact of these
physiological alterations on the behavioral phenotype of GluN2A
(N615S)-expressing mice, we used a battery of different
beha-vioral tests. In accordance with the novelty-induced hyperactivity
in the LABORAS cage (Supplementary Fig. 4d), Grin2a
S/Smice
also displayed a pronounced locomotor hyperactivity in another
novel environment test, without any sign of habituation
throughout the entire 2 h session (Fig.
7
a). We observed the same
increase in exploratory behavior when we exposed Grin2a
S/Smice
to
five novel objects in three repeated, 6 min sessions in a novel
arena. Grin2a
S/Smutants did not decrease their object exploration
during the three sessions, in contrast to what was observed for
both Grin2a
+/Sand Grin2a
+/+control mice (Fig.
7
b).
Hyperactivity is often associated with impulsive behavior that
can be measured in the cliff avoidance reaction (CAR) test
69.
Here we found that the latency to the
first fall from the platform
was significantly shorter in both Grin2a
+/Sand Grin2a
S/Smice
compared to wild-type littermates (Fig.
7
c). In addition, during
the entire test, the total number of falls for Grin2a
S/Sanimals was
Grin2a
+/+b
CA1
Exploration
REM sleep
Grin2a
+/S 10-2 0.0Modulation index [MI]
Amplitude frequency [Hz]
Low Gamma explorationMI
x 10
-2 p<0.06MI x 10
-2 Low Gamma REM sleep p<0.026Grin2a
S/S 20 50 80 110 140 170 200 2 6 10 14Phase Frequency [Hz]
20 50 80 110 140 170 200 2 6 10 14 2 6 10 14 (4) (4) (3) 0.0 0.4 0.8 1.2 0.0 0.4 0.8 1.2 1.6Exploration
5 15 0 50 100150Frequency [Hz]
REM sleep
10 Grin2a+/+ Grin2a+/S Grin2aS/Sa
p<0.05 4.0 3.0 2.0 1.0 0.0γ
Power [log(µV
2/Hz)]
50 100 150200 (3) (4) (4) 4.5 4.0 3.5 3.0 2.5 2.0θ
Power [log(µV
2/Hz)]
5 15 0 10Exploration
REM sleep
0 2000
Frequency [Hz]
3 4 4
Fig. 6 Adult GluN2A(N615S) mutant mice express altered hippocampal oscillations during wakefulness and REM sleep. a (left) Peak frequencies during exploration and rapid eye movement (REM) sleep for theta (0–15 Hz, left diagrams) and gamma oscillations (15–200 Hz, right diagrams) in all genotypes. During exploration, the average theta range peak frequencies were at 8.61 ± 0.07 and 8.75 ± 0.28 Hz for Grin2a+/+mice and Grin2a+/Smice, respectively. In Grin2aS/Smice the theta range peak frequency was significantly slower, measuring 7.43 ± 0.24 Hz (Kruskal Wallis test, p = 0.0159). During REM sleep
the average frequency ranges of Grin2a+/+and Grin2a+/Smice were around 7.00 ± 0.20 Hz whereas Grin2aS/Smice had a lower but not significantly
different range 6.71 ± 0.22 Hz.a (right) No significant differences on the low and high gamma frequency bands—ranges between 20–100 Hz and 100–200 Hz, respectively111—could be detected between genotypes, neither during exploration nor in REM sleep. The number of mice used in this experiment are
given with the name of the genotypes.b (left) Grin2aS/Sand Grin2a+/Smice show reduced theta-gamma phase–amplitude coupling as determined by the
modulation index (MI) in the low gamma component in CA1 (white arrowheads) during awake and REM sleep states.b (right) For Grin2aS/Sthe MI value
dropped significantly during exploration and REM sleep although the MI reduction reached significance only during exploration (one-way ANOVA, Kruskal–Wallis test). Numbers below bars of bar graphs indicate the number of animals. Error bars represent mean ± SEM.
higher compared to controls, whereas a similar but
non-significant trend was noticed for Grin2a
+/Sanimals (Fig.
7
c).
Next, we assessed the general sociability of the mice in the
three-chamber social test
70. The preference to interact with an
unfamiliar stranger mouse rather than with a non-living novel
object was significantly reduced in Grin2a
S/Smice compared to
the other two genotypes (Fig.
7
d). However, this reduced
preference did not reflect a lack of interest in the social stimulus
per se, but rather an increased activity and exploratory response
to the object. Indeed, Grin2a
S/Smice showed increased levels of
exploration and attention to both the social and non-social cues.
Similarly, in the novel object recognition task, the total number of
interactions with objects was significantly increased in Grin2a
S/Smice; however, they did not show a significant preference for
the novel object over the familiar one in the test trial, as observed
in wild-type controls and Grin2a
+/Slittermates (Grin2a
+/+p
=
0.001, Grin2a
+/Sp < 0.01; Grin2a
S/Sp > 0.20; Fig.
7
e).
To evaluate short-term spatial recognition and spatial
exploration we conducted a simple, spatial novelty preference
test in a perspex Y-maze (Fig.
7
f). Mice were allowed to explore
freely two arms of the maze (start and familiar arm) during a
sample run, whereas in the following test run they were allowed
to explore all three arms (including the previously unvisited
and hence novel arm). As expected, Grin2a
+/+controls showed
a strong preference for the novel arm over the familiar arm
during the test run, as did the heterozygous Grin2a
+/Smice. In
contrast, the homozygous Grin2a
S/Smice showed reduced
novelty preference (Fig.
7
f) and increased locomotor activity
(with significantly more total arm entries) throughout both the
sample and test runs.
In summary, this behavioral analysis revealed that Grin2a
S/Smice (but not the Grin2a
+/Slittermates) displayed increased and
dysregulated levels of attention and exploration to spatial,
non-spatial, and social cues
a
Recording time [min] in 5 min bins 0
100 200 300 400
Total beam breaks [n] / bin
p<0.001 (10) (10) (10) 0 0.3 0 0.7 0 [%] 0.27 0 20 40 60
Mice with no falls from
the elevated platform
[%]100 80 60 40 20 0
b
c
d
e
p<0.01 p<0.01 p<0.01 Object interactions [n] Test run 0 30 60 90 150 p<0.01 p<0.0001 Novel object / total interactions 0.2 0.4 0.6 0.8 1.0 0.0 0.2 0.4 0.6 0.8 p<0.05Time in novel arm
/ time in both arms
Total arm entries [n]
10 20 30 0 p<0.01
f
Time [min] 180Sample run Test run p<0.01 (17) (13) (11) 2 1 1616 1216 16 120 40 50 0 2 4 6 8
Total falls per mouse [n]
p<0.001 12 10 Mouse / total interactions [%] 40 60 80 100 p<0.01 2 1 13 15 1 1 13 17 Grin2a+/+ Grin2aS/S Grin2a+/S 16 12 16 12 16 16 12 16 16 40 80 60 20 0 p<0.001 p<0.01 100 Distance travelled [m] Empty arena 1st 2nd 3rd
arena with 5 objects
Grin2aS/S 3rd session p<0.001 Grin2a+/+ Grin2aS/S Grin2a+/S (3) (8) (8) Grin2a+/+ Grin2aS/S Grin2a+/S Grin2a+/S Session: Grin2a+/+ Grin2aS/S Grin2a+/S Grin2a+/+ Grin2aS/S Grin2a+/S Grin2a+/+ Grin2aS/S Grin2a+/S 0 30 60 90 120 Test run Sample run p<0.07 Ch. Ch. 12.5 cm
Fig. 7Grin2aS/Smice are hyperactive and show increased attention and lack of inhibition. a The total locomotor activity during the entire 2 h session in a novel environment was enhanced in Grin2aS/Smice.b Similarly, the exploratory behavior of Grin2aS/Smice remained high in all three successive 6 min
exposure sessions tofive novel objects (ITI = 4 min), as exemplified by traces of the animal’s movement on the right. c (left) The time of first fall (Cliff Avoidance Reflex, CAR) was significantly reduced for Grin2aS/Sand Grin2a+/Smice.c (right) In a 60-min session Grin2aS/Smice showed a significantly
increased number of falls compared to wild-type mice.d (left) In the three-chamber sociability test Grin2aS/Smutants had a significantly reduced
preference to explore the stimulus mouse over the object compared to Grin2a+/Sand Grin2a+/+littermates.d (right) Occupancy heat maps in the three-chamber sociability test show a representative example of a Grin2aS/Smouse with a reduced preference for another mouse versus an inanimate object. The
social preference is visible for Grin2a+/+and Grin2a+/Smice. The occupancy is color-coded separately for each group and translates to a % given in white numbers on the key for each genotype.e During the novel object recognition test, Grin2aS/Smice displayed significantly more interactions with the two
objects in both the sample and test runs compared to their Grin2a+/Sand Grin2a+/+littermates. During the test run, only the Grin2a+/Sand Grin2a+/+ showed a significant preference for the novel object over the familiar object. There was no significant novelty preference in the Grin2aS/Smice.f During the
sample run in the Y-maze Grin2aS/Smice made significantly more total arm entries. In the test run, Grin2a+/+and Grins2a+/Sshowed a preference for the unexplored novel Y-maze arm, whereas Grin2aS/Smice showed a lack of novelty preference. The numbers of mice are shown in brackets or below the bars
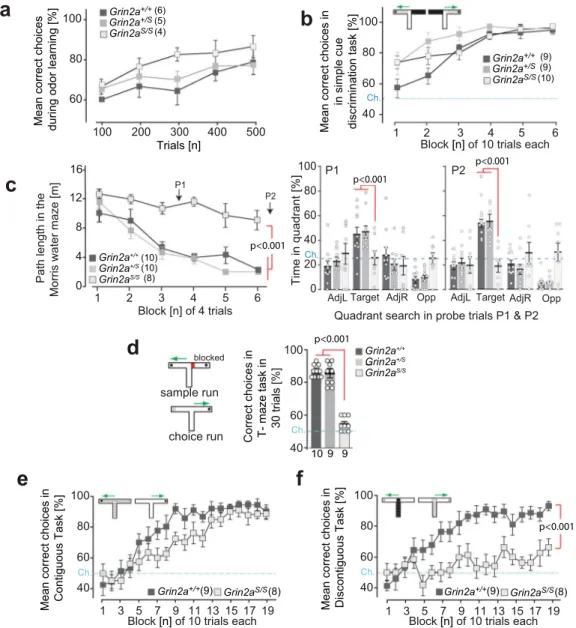
Grin2a
S/Smice are not impaired in learning simple
associa-tions. How does this attentional phenotype impact associative
learning? We found that despite their hyperactivity, impulsivity
and dysregulated levels of attention, Grin2a
S/Smice could still
form simple associations. Grin2a
S/Sand Grin2a
+/Smice were
both able to learn to discriminate between a rewarded and a
non-rewarded odor, and both groups of mutants acquired this simple
odor-learning task at the same rate as their control littermates
(Fig.
8
a).
We next evaluated the ability of mice to acquire a simple
visuo-tactile discrimination in a T-shaped maze, during which animals
were required to choose between two different
floor inserts
located in the goal arms (Fig.
8
b). Choosing the correct
floor
insert (whose spatial location varied between the left and right
goal arms according to a pseudorandom sequence such that there
was no spatial solution) was rewarded with a sweet milk reward.
Both Grin2a
S/Sand Grin2a
+/Smice successfully acquired the task
and were unimpaired relative to controls (Fig.
8
b). Grin2a
+/S100 200 300 400
60 80 100
Mean correct choices
during odor learning [%] 500
a
40 60 80 100 1 2 3 4 5 6b
Trials [n] (6) (5) (4) Grin2a+/+ Grin2aS/S Grin2a+/S (9) (9) (10) Grin2a+/+ Grin2aS/S Grin2a+/S p<0.001Correct choices in T- maze task in
30 trials [%] 40 60 80 100 p<0.001 40 60 80 100 1 3 5 7 9 11 13 151719
d
e
40 60 80 100 1 3 5 7 9 11 13 1517 19Block [n] of 10 trials each Block [n] of 10 trials each 9 9 10 Grin2a+/S Grin2aS/S Grin2a+/+ (9) (8) 1 2 3 4 Block [n] of 4 trials 6 0 4 8 12
Path length in the
Morris water maze
[m] p<0.001 5 (10) (8) (10) Grin2a+/S Grin2aS/S Grin2a+/+ sample run choice run blocked Grin2aS/S
Grin2a+/+ Grin2a+/+(9) Grin2aS/S (8)
Mean correct choices in Contiguous Task [%]
Quadrant search in probe trials P1 & P2
c
f
Mean correct choices in
in simple cue
discrimination task [%]
Block [n] of 10 trials each
Mean correct choices in Discontiguous Task [%]
AdjL Target AdjR Opp
Time in quadrant [%] 100 80 60 40 20 0
AdjL Target AdjR Opp
Ch. 16 P1 P2 Ch. Ch. Ch. Ch. p<0.001 p<0.001 P2 P1
Fig. 8 Associative learning in GluN2A(N615S) expressing mice. a Odor discrimination. Grin2aS/Slearned to discriminate between amyl acetate and ethyl
butyrate in a rewarded go/no go-paradigm (250 trials for each odor stimulus, pseudo-randomized, and counterbalanced by stimulus identity across animals). Acquisition was similar for all three genotypes.b Simple visuo-tactile discrimination. Grin2aS/Smutant mice showed normal acquisition in the
simple discrimination T-maze task and were able to associate a specific visuo-tactile insert (black foam versus light blue toweling) with a milk reward. c Morris watermaze. In the standard Morris watermaze task (left graph) the path length to reach the hidden platform decreased across training blocks for Grin2a+/+and Grin2a+/Smice but not for Grin2aS/Smice. Two probe trials were conducted after 12 and 24 training trials (P1 and P2, respectively) during
which the platform was removed from the pool. At both P1 and P2 (right bar graphs) the Grin2aS/Smice failed to search for the platform in the target
quadrant. AdjL adjacent left, Targetfixed location of the hidden escape platform during acquisition, AdjR adjacent right, Opp opposite of target quadrant. Dashed lines indicate chance levels.d Rewarded alternation. (left) In the T-maze rewarded alternation task (right) spatial working memory performance was substantially impaired in Grin2aS/Smice.e Contiguous task. In the contiguous version of the conditional T-maze task (withfloor inserts covering the entire T-maze; white Perspex versus gray wire mesh), Grin2a+/+and Grin2aS/Smice were able to associate a particularfloor insert with the location of the
reward in either the left or the right goal arm.f Discontiguous task. Separate groups of mice were trained in the discontiguous version of this conditional task, in which thefloor insert cues were now limited to the start arm only. Grin2a+/+mice readily acquired the task, but Grin2aS/Smice failed to learn.
The numbers of mice are shown in brackets or below the bars of bar graphs. Chance levels (Ch.) are indicated by dashed lines. Error bars represent mean ± SEM (for statistics: Supplementary Statistics to Fig. 8).