Containerized Compressed Natural Gas Shipping
by
Georgios V. Skarvelis
Bachelor of Engineering in Naval Architecture, Newcastle University, 2008
Master of Science in Marine Engineering, Newcastle University, 2009
Submitted to the
Department of Mechanical Engineering
in Partial Fulfillment of the Requirements for the Degree of
Master of Science in Mechanical Engineering
at the
Massachusetts Institute of Technology
June 2013
ARCHIVES
MA SSACHUSETTS INSTITUTE
OF TECHNOLOGY
U
235J20-© 2013 Massachusetts Institute of Technology. All rights reserved.
Signature of Author:
Department of Mechanical Engineering
May 22, 2013
Certified by:
Accepted by:
Paul D. Sclavounos
Professor of Mechanical Engineering and Naval Architecture
Thesis Supervisor
David E. Hardt
Professor of Mechanical Engineering
Chairman, Department Committee on Graduate Students
Containerized Compressed Natural Gas Shipping
by
Georgios V. Skarvelis
Submitted to the Department of Mechanical Engineering on May 22, 2013 in Partial Fulfillment of the
Requirements for the Degree of Master of Science in Mechanical Engineering
ABSTRACT
In the last decades, the demand for energy is increasing. It is necessary to develop new ways to distribute the energy using economically feasible solutions. In this project an Ultra Large Container Ship is used that can carry more than 12,000 TEUs. Inside each TEU, four cylinders are installed that can store compressed natural gas at 250 bar. Two types of cylinders are tested: cylinders made of steel and cylinders made of carbon fiber. Carbon fiber cylinders were chosen because they are lighter. In addition, two types of compressors are used: centrifugal and reciprocating compressors. Centrifugal compressors are used to increase the initial pressure from 10 bar to 50 bar.
Reciprocating compressors are used to increase the pressure from 50 bar to 250 bar. A model is developed using thermodynamics and MATLAB, in order to determine the total power required for a compressor to fill the entire vessel in one or more days. Furthermore, by using valuation metrics, a model is created to find the value of the project and to generate sensitivity analyses. It is concluded that leasing the ships is more profitable than buying them.
Thesis Supervisor: Paul D. Sclavounos
Dedication
This thesis is dedicated to my parents, Vasilis and Maria,
whose support, guidance and constant love have
sustained me throughout my life and have provided me
Acknowledgements
First of all, I would like to thank my supervisor Professor Paul Sclavounos, for his inspiring and encouraging way to guide me to a deeper understanding of knowledge work, his very useful comments and notes during the entire work with this final year project, and above all for his time.
Secondly, I take this opportunity to also thank, in no particular order, Sungho Lee, Andreas Nanopoulos, Carlos Casanovas and Godine Chan of the Laboratory for Ship and Platform Flows (LSPF) as well as Dr. John Coustas and Mr. Iraklis Prokopakis of DANAOS Corporation for their help in compiling this thesis. In addition, I would like to thank all the professors and students at MIT.
At last, to my parents, thanks for supporting me with your love and understanding.
Table of Contents
ABSTRACT...2
Acknow ledgem ents ... 4
Table of Contents...5
1. Introduction...8
1.1 The Natural Gas M arket ... 8
1.2 Natural Gas Transportation ... 10
1.2.1 Pipelines... 11
1.2.2 LNG Carriers ... 12
1.3 Com pressed Natural Gas (CNG)... 13
1.4 CNG Carriers and Shipping Com panies... 14
1.4.1 Sea NG Corporation ... 15
1.4.2 Knutsen OAS Shipping Com pany ... 16
1.4.3 Trans Ocean Gas Com pany ... 17
1.4.4 EnerSea Transport ... 18
1.5 Containerization... 19
1.5.1 ISO Standards ... 20
1.5.2 Container Ships ... 21
1.5.3 Evolution of Container Ships ... 22
1.5.4 Cargo Cranes ... 25
1.5.5 Cargo Holds ... 26
1.6 Freight M arket of Container ships ... 28
2. Transportation of Natural Gas inside a TEU ... 31
2.1 Twenty Equivalent Unit (TEU)... 31
2.2 Steel- X120 grade ... 32
2.3 Carbon Fiber Type 4 ... 33
2.4 Dim ensions of the TEU ... 34
2.5 Sketch of the TEU ... 34
2.6 Analysis of the cylinders ... 35
2.6.1 Determ ination of the steel cylinders thickness... 35
2.6.2 Dim ensions of the cylinders... 36
2.6.3 Calculation of cylinders volume ... 36
2.6.5 Determination of the Compressed Natural Gas inside the four cylinders...37
2.6.6 Total W eight of a TEU ... 37
2.6.7 Determ ination of the Carbon Fiber (Type 4) cylinders weight ... 38
2.7 Strength Analysis of the TEU... 39
2.7.1 Tensile Stresses ... 41
2.7.2 Beam Analysis ... 41
2.7.3 Shear Force and Bending M oment Diagram s ... 42
2.7.4 Com pression Stresses on the beam ... 43
2.7.5 M axim um Bending stress... 43
2.7.6 Critical Buckling Point ... 43
3. Com pressors ... 44
3.1 Reci procating Com pressors ... 44
3.2 Centrifugal Com pressors ... 45
3.3 Axial Com pressors... 46
3.4 Rotary Com pressors ... 46
3.5 First Law of Thermodynam ics ... 47
3.6 Ideal Gas Laws... 48
3.7 Perfect Gas Form ula ... 49
3.8 Com pressibility...50
3.9 Theoretical Com pression cycles... 51
3.10 Heat transfer ... 52
3.11 Heat m ode ... 52
3.12 Heat Capacity ... 53
3.13 W ork Done Calculation for the whole Process ... 54
3.14 Calculation of the above constants ... 59
3.14.1 Calculation of Z factor... 59
3.14.2 Calculation of the Surface Area of the cylinders ... 61
3.14.3 Specific Heat Capacities and Gas Constant of M ethane ... 62
3.14.4 M ass flow rate ... 63
3.15 Calculation of W ork done using M atlab ... 64
3.15.1 Case 1: Load a TEU in one day ... 64
3.15.2 Case 2: Load a TEU in two days ... 67
3.15.3 Case 3: Load a TEU in three days... 70
4. Econom ic Valuation ... 75
4.1 Ultra large Container Ship (U LCS) ... 75
4.1.1 Ultra Large Containership Details... 76
4.1.2 Num ber of CNG TEUs loaded in the ULCS... 76
4.1.3 Voyages and Fleet of the Shipping Com pany... 76
4.2 Capital Costs for the Shipping Company ... 77
4.2.1 Annual Costs... 77
4.2.2 Fuel Costs ... 78
4.2.3 Electricity Costs ... 84
4.2.4 Port Charges ... 84
4.2.5 The deploym ent of containers ... 84
4.2.6 Extra Costs... 85
4.2.7 Crew Costs and Adm inistrative Expenses ... 85
4.3 Operating Incom e of the fleet ... 86
4.4 Unleveraged Internal Rate of Return ... 87
4.5 Return on Invested Capital (ROIC) ... 87
4.6 Return on Equity (ROE)... 88
4.7 W ACC (W eighted Average Cost of Capital)... 89
4.8 Value/Capital for the shipping com pany ... 91
4.9 Sensitivity Analysis for buying the ships ... 93
4.10 Econom ic Evaluation for leasing the vessels ... 93
4.10.1 Sensitivity Analysis for leasing the ships... 94
4.11 Com parison of the above two options ... 94
5. Com parison of LNG Carriers and ULCS carrying CNG containers ... 96
5.1 Energy savings... 96
5.2 Comparison of the revenue of LNG ship and the ULCS of this project ... 98
5.3 Sum m ary of advantages ... 98
6. Conclusions ... 99
7. Appendices ... 100
Appendix A - Torsion of our Cylinders... 100
Appendix B - Buckling... 104
1. Introduction
1.1 The Natural Gas Market
Natural gas will play an important role worldwide for the next several decades. Natural
gas accounts for 14% of the total world energy supply. That share is expected to rise
especially in North America and Europe.
Natural gas is a gaseous-phase fossil fuel and is lighter than air. It is used for residential
purposes such as space heating, water heating and cooking. In the last decade, gas is
also used to generate electricity. It is cleaner than conventional fossil fuels such as coal
(solid substance) and oil (liquid substance). Gas is also more efficient and has lower
levels of dangerous byproducts that are released into the atmosphere (Wang and
Economides 2009).
There are many large deposits of natural gas around the world. Gas consumption is
rapidly increasing, and the International Energy Agency (IEA) states that the global gas
demand will rise by more than 50% between 2013 and 2035. According to
IEA,
gas will
make to 32% of the global energy supply.
Recoverable naturat-gas reserves
2011 trn cubic metres
0 10 20 30 40 50 60 70 80 90 100 110 120 130 140 150
Figure 1: Recoverable natural-gas reserves
I
Russia United States China Iran Saudi Arabia Australia Gatar Argentina Mexico Canada Venezuela Indonesia Norway Nigeria Algeria Source: 1EA Conventional Tight Shale 1 Coal-bed methaneOne drawback to natural gas is the difficulty in transporting it. Because of increased
demand, there has been a substantial development in natural gas exploration and
transportation
On the global natural gas market, USA and Russia account around 40% of the natural
gas supply as can be seen from the graph below.
The World Top 10 (2011)
rN
.4-Ii
Eu M (U 00 A-Ac:r:
Figure 2: Top 10 Producers of Natural Gas
The following graph clearly shows that North America and Europe are the leading regions in natural gas consumption.
World dry natural gas consumption by region, 1980-2010
trillion cubic feet Europe ounner Sovie t
North America 21 Uno
29
Ie,, 13
Central & South
America 5 Oceania trillion cubicleet 30 2010 --15 _ 5 0 1 1980 1986 1990 1996 2000 2006 2010 - North America Former Soviet Union -Europe
-- Asia Middle East
Central & South America -Africa
-Oceania
Figure 3: Natural Gas Consumption by region Share of W0,10 latal
Over the last years, Asia had a high growth rate in gas consumption and is approaching the level of Europe and North America. This growth is shown in Figure 3. This is due to the shutdown of Nuclear reactors in Japan after the Fukosima accident and the increased Chinese demand for the Russian natural gas.
1.2 Natural Gas Transportation
Due to rising environmental concerns and low price, natural gas is a front-runner in energy preference by customers worldwide. Hence, the transportation of it over long distances is a major issue for the majority of governments and the energy sector.
Two well established modes of transportation are used to carry natural gas over long distances from the sources to the consumers: pipelines and liquefied natural gas (LNG) ships. According to BP statistical review of World Energy, pipelines account for 70% of the transported gas and LNGs for the remaining 30%. Many countries construct LNG terminals for re-gasification in order to be able to get this fossil fuel directly from the
LNG ships. Some LNG ships have already installed small re-gasification stations on them, in order to be able to transport greater gas volume from the port. These stations make LNG ships more competitive against the pipelines. The following figure clearly depicts LNG ships domination in the sea transport market of natural gas (Wang and Economides 2009).
us
Canada
a Mexico
0 S & Cent. America * Eutope & Eurasia U Mddle East
Afric+ Pipeline gas
0 Asa Pacific - LNG
1.2.1 Pipelines
Pipelines are less expensive than the LNG vessels. Underwater pipelines are also an option, but are very expensive. Pipelines are the common and efficient ways to transport natural gas on land. Of course, pipelines have political, technical and economical obstacles. High capital investment is needed for large-diameter pipelines and significant proven reserves for the next years. Larger pipelines mean that more compressor stations are necessary for the operation of the pipelines. Compressor stations require fuel and specialized workers to run. It is estimated that a pipeline costs around $1 billion to $1.5 billion per 1000 km. Pipeline transportation is less complex than the LNG process. In the last decade, the development of the underwater pipelines and offshore pipeline technology make pipelines a viable way of transportation. Pipeline usage reduces the unit costs of gas transportation thus making it more competitive to LNG vessels usage (Wagner and Wagensveld 2002).
1.2.2 LNG Carriers
LNG ships are very expensive. They cost around $200 million to build and their maximum capacity is 160,000 cubic meters.
Figure 6: Liquefied Natural Gas Carrier
The obvious benefit of LNG carriers is the relatively easy access to distant markets.
Generally, beyond 3,000 kilometers is too great and expensive of a distance for
pipelines to cover (Wand and Economides 2009). The environmental concerns for oil
transportation pipelines have frequently been more widely debated than for liquefied
natural gas pipeline transportation. Pipeline projects such as the Baku-Tblisi Ceyhan,
Chad-Cameroon, Camisea and the Yadana have become important landmarks for
ecological activism. On the other hand, if the pipeline infrastructure can be moved
underground then the environmental impacts can be reduced.
The advantage of LNG ships over pipelines and other modes of transportation for
natural gas is clearly depicted by the following figure.
Efficient Options for Monetizing Natural Gas
16--14
12
10
8
6
4
2
07
0
5,000
Figure 7: Options to
transport Natural Gas according to the distance to consuming
market
1.3 Compressed Natural Gas (CNG)
CNG is a natural gas compressed at pressures of 100 to 250 bar in order to reduce its
volume. Ships, trucks and barges can transport it. It has been used to fuel buses, cars
and other vehicles around the world. There are several maritime companies that use
CNG vessels to transport compressed natural gas throughout the seas. These ships can
be called "floating pipelines" (Wang and Economides 2009).
The first ship was constructed in the 1960's for the transportation of CNG. The name of
the ship was Columbia Gas' SIGALPHA. This ship was capable of carrying compressed
natural gas. Of course, this ship was uneconomical due to the low selling price of
natural gas. This high transportation cost and low gas prices meant low returns for the
investors (Wang and Economides 2009).
S
I It
1,000
2,000
3,000
4,000
Today
LNG
ships are the leaders in sea transportation of natural gas because they can
carry larger quantities for a considerable distance. Thus they can pick up and transport
natural gas from any port.
Proved / stranded gas (102m3)
Capacity (million m3)
Reach (km)
Upstream infra costs
Downstream infra costs Number potential export sites
Global gas commodity market?
Energy balance delivered gas
Public acceptance 161 100 - 250 6000 - 12,000 very large very large low no very strong low 127 1,4 - 22 200 - 5,500 low low large yes stronger unknown
Table 1: Advantages of LNG Carriers over CNG Carriers
1.4 CNG Carriers and Shipping Companies
CNG carriers' technology is very simple. At an ambient temperature, natural gas is compressed to higher pressures (100-250 bar). A common CNG ship has a containment system of cylindrical, vertical or horizontal pipes to store the compressed natural gas. The pipes are made of steel in order to sustain the high temperature of natural gas
intake.
In the last decade, many investors and shipping companies have shown interest in CNG projects. Some of the most famous shipping companies that own CNG carriers are: SeaNG Corporation, Knutsen OAS Shipping Company, Trans Ocean Gas Company and
Figure 8: SeaNG Corporation's carrier
1.4.1 Sea NG Corporation
Sea NG Corporation is based in Canada. It has a model that stores compressed natural
gas in coils of pipe wound into cylindrical containers called coselles. Coselles have a
diameter of 17 meters and 4 meters in height. Every coselle weighs around 600 tons
and has a capacity of 3 million MMscf of compressed natural gas. They can be stacked
in the holds and on the deck. This type of CNG vessel combines safe and efficient
loading and unloading facilities with the gas compressed at an onshore terminal.
American Bureau of Shipping was the first classification society, which approved the
first CNG carrier of Sea NG Corporation. Cost savings are achieved because these types
of ships use their own natural gas, as a fuel thus the ship owner does not need to
purchase heavy fuel oil, which is expensive.
1.4.2
Knutsen OAS Shipping Company
Knutsen OAS is a Norwegian maritime company, which developed a pressurized natural gas system. This system consists of pipes enclosed in cylindrical containers. Det Norske Veritas the Norwegian classification society approved this vessel. In this model, the natural gas is stored on-board at 250 bar at ambient temperature in vertical cylinders. The capacity of these ships varies from 2 million cubic meters to 30 million cubic meters. Their advantage is that they use natural gas as fuel so they have low cost. Their disadvantage is that the unloading of natural gas could be far away from shore and this increases the delivery cost.
The technology behind the Knutsen's ship is simple. It is a combination of a crude oil tanker and a container vessel. The ship's pressurized natural gas system is based on pipeline construction principles.
I
Figure 9: PNG Carrier of Knutsen OAS 4L
1.4.3 Trans Ocean Gas Company
Trans Ocean Gas Company is based in Canada and uses fiber reinforced plastic pressure
vessels to transport compressed natural gas at high pressures.
Fiber pressure vessels are considered safe and trustworthy and have various
applications in different industries such as aerospace, offshore shipping and public
transportation. Using fiber pressure vessels eliminates all the disadvantages of using
conventional steel pressure vessels.
The Trans Ocean Gas CNG containment system is easier to install because it is
developed in cassettes. The cassette system carries fiber pressure bottles vertically and
manifolds are connected on the top and bottom of each cassette. In order to reduce
their instability from vibrations and hydrodynamic movements, the cassette frames are
made of steel. In addition, manifolds and pipes are manufactured by duplex stainless
steel in order to be corrosion resistant (Trans Ocean Gas. July, 2010).
1.4.4 EnerSea Transport
EnerSea Transport is a US maritime company and has developed a cargo containment system known as 'VOTRANS' (Volume Optimized Transport Storage).This system includes compressed natural gas bottles made from large-diameter steel pipe sections. Optimizing pressure and temperature and using this containment method can achieve improved storage efficiencies of more than 60%.
Reducing the vessel's weight reduces wall thickness due to the operating pressure of 120 bar and in that way the volume of natural gas is increased.
The vessel's draft was designed to guarantee that the ship could be constructed and the cargo containment system could be fitted in dry dock. In addition, the vessel can be dry docked in many ports worldwide for servicing and maintenance.
1.5 Containerization
Containerization is the technique of transporting cargo by placing it in large containers. It is an essential cargo-moving method established in the last century. Sealed boxes were used until the 1960s. Afterwards, containerization became a vital factor in maritime industry. Ships were constructed for carrying containers. These types of ships are fast and large and can hold boxes inside the bulkheads and above deck. Containers can be easily loaded and unloaded with less lost time in ports. Their speed makes them able to make more voyages compare to traditional cargo vessels. Of course, port infrastructure plays a key role for the fast handling of the boxes. The container can be transported by a ship, truck and rail. The container, developed after the Second World War, resulted in a rapid increase of international trade and reduced transport expenses (Stopford 2009).
Containerization caused a revolution in the global logistics system and shipping industry. Its introduction did not have an easy passage and it took about ten years before ships used it widely. One important issue was the high cost of infrastructure in ports and railroad stations for the handling of the containers. Moreover, trade unions were worried about the massive loss of jobs of port employees.
In 2010 approximately 90% of non-bulk cargo worldwide was moved by container ships.
Today, several container ships can carry over 14,000 TEU. One example of a modern
container ship with a length of 396 meters is the Emma Maersk. Container ships can be
limited in size only by the depth. Enhanced cargo safety is also a significant advantage
of containerization. It is very difficult for someone to steal the shipment because the
doors of the containers are sealed. In addition, a number of containers are fitted with
electronic monitoring devices and can be remotely monitored for changes in air
pressure, which happens when the doors are opened. Containers have developed into
widely accepted technique to move vehicles overseas .By using TEU or FEU containers
for simple international transportation; container ships have decreased shipping
expense and shipping time.
1.5.1 ISO Standards
There are five common standard container lengths worldwide: 20-ft, 40-ft, 45-ft, 48-ft,
and 53-ft. The United States uses standard containers of 48-ft and 53-ft for domestic
purposes. Cargo capacity of container ships is expressed in twenty-foot equivalent
units or forty-foot equivalent units (FEU).
The maximum gross mass for a loaded TEU container is 24 tons, and for a FEU is
30 tons. The maximum payload mass is reduced to approximately 22 tons for TEU and
27 tons for FEU due to truss weight.
1.5.2 Container Ships
Container ships are merchant vessels that carry their load in standard intermodal
containers. They carry the majority of sea-going non-bulk cargo.
Container ship capacity is measured in twenty-foot equivalent units.
These ships remove their hatches and hold more than the traditional merchant vessels.
The hull of a container ship is divided into cells by vertical guide rails. These cells are
designed to store cargo in standard dimensions of a TEU or FEU. Containers are usually
made of steel to be able to hold up to 24 tons.
Recent container ships can carry up to 16,000 twenty-foot equivalent units.
Figure 14: Marco Polo Container Ship (16,000 TEU)
Today's largest container ships have a length of 400 meters. The hull is comparable to
bulk carriers and is built around a strong keel. The holds are topped by hatch covers, on
which more boxes can be loaded. A lot of container ships have their own cargo cranes,
and safety systems for securing the stability of boxes during the voyages.
Figure 15: General Arrangement of a Container Ship
In 2010, container ships made up 14% of the world's fleet in terms of deadweight tonnage. The container ship deadweight tonnage is around 170 million. The average age of container ships worldwide is 11 years, making them the youngest merchant type of vessel.
The top 20 liner companies controlled 65% of the world's container capacity, with 2,700 ships and German ship owners dominate the liner shipping trade.
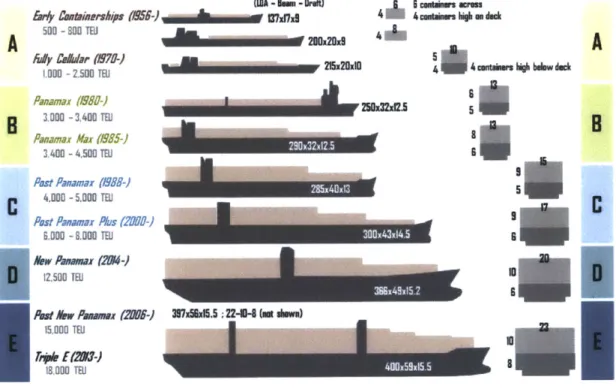
1.5.3 Evolution of Container Ships
Since the mid 1950s, the size of the container ships has been increasing by different periods. Each period represents a different generation. There are five generations:
1) First generation
The first generation of container ships consisted of small bulk vessels with speeds of 18 knots that could carry up to 1,000 TEUs. Due to the lack of infrastructure in port terminals, these vessels had cranes onboard. Once the container began to be adopted, the construction of the first fully cellular container ships started. All containerships are composed of cells. Cellular containership also offered the benefit of loading the cargo below the deck as well as on the deck. Many ports started to use specialized cranes for
loading and unloading boxes. In addition, the fully cellular vessels were much faster with speeds of more than 20 knots.
2) Second Generation - Panamax
In the 1980's larger containerships were constructed to meet the economies of scale. More boxes means less cost per TEU. The main purpose of naval architects and ship owners is to build ships that can pass the Panama Canal (32 meters beam limitation) and this was achieved in 1985 with containerships of about 4,000 TEUs.
1) Third Generation - Post Panamax
The target was to overcome the beam restriction of Panama Canal and to construct bigger ships by increasing the length and keep the beam constant. In 1996, the first Post Panamax ship was constructed with a capacity of 6,500 TEUs. Ship size increased with a capacity of 8,000 TEUs due to the rapid growth of international trade. Post Panamax Containerships require deep-water ports with excellent handling systems.
2) Fourth Generation - New Panamax
These are ships designed to be able to pass Panama Canal after its expansion in 2014. They have the ability to carry around 12,500 TEUs. These vessels can service the USA either from Asia and Europe.
3) Fifth Generation - Post New Panamax
In 2006, Maersk shipping company introduced the containership Emma Maersk having capacity of 11,000 to 15,000 TEUs. These ships cannot pass the Panama Canal even after its 2014 expansion but can load up to 18,000 TEUs. In addition, shipyards are trying to design container ships of 30,000 TEUs. These ships will be very useful for the transportation of large commodities between Europe and Asia.
Containership speeds range from 20 to 25 knots. Due to high-energy consumption, many shipping companies are using slow-steaming method (up to 21 knots) to reduce their fuel costs. As a result, the design of fast containerships will not continue for the next few years.
S- Io am-D6
[aWWEauVinese (ON-) voobogaBA
A
500 -g. T.mMx'=
a4
Ay CaL/ar (879-i)flxU 1,900 -2500 TEU faisn ME98-) _____________e
3000-3,400 TEDl Panamax Max (/985-) 3400 - 4,500 TEl 4,0-5,000DOTEU Post Panamax (/988-)Post Paamx Phus (20/0-) 6,000 -8,000 1ai ALrw PaanWX (214-) 12,500 a -B caumkws -~cantakm h~b am dark 5 4gnas h bdow dmk
:1
I.
A
B
C
pat har Pwaaw e f(g-) U7x5M5.5 :22--8 (aii am)
15,000 TEU Tk 00 M?-)
18000 Ta
Figure 16: Evolution of Container Ships
In order to reduce the operating cost per TEU, economies of scale play an essential role in containerships sizes. The major issues for the construction of larger ships are, the lack of large low speed diesel engines, the size limitations of sea passages such as Suez Canal and Singapore Strait and the lack of sufficient ports organized to handle large container ships.
Of course, the low draft of large container ships gives substantial room for ships growth. Hence, a 20,000 TEUs ship can be constructed by increasing its length and its
1.5.4 Cargo Cranes
There are two types of container ships: geared container ships that have cargo crane
on-board and gearless container ships that do not have cranes. The majority of the
container ships are ungeared. Geared ships account for only 8% of the container ship
capacity and are vessels of 1,500-2,500 TEUs.
Geared container ships are flexible and can load and unload TEUs in every port, but
they have a number of disadvantages such as:
e
Higher new building cost
e
More maintenance and fuel costs
* Suitable only for less-developed ports
e
Some of the cranes are slower than the ports cranes
The development of port cranes has been a key to the success of
containerization. Today, some ports can load or unload around 700 TEUs per hour.
Singapore's port is the world's busiest harbor with 26 million of TEUs annually and the
total estimated container traffic is around 465 million TEUs.
1.5.5 Cargo Holds
Cargo holds for modern container ships are mainly constructed to increase the speed of
loading and unloading the cargo, and to hold containers stable while at sea. The hatch
openings are vital for the operation of the vessel through its entire life. They are
enclosed by a steel arrangement which is the hatch coaming. Hatch covers are on the
top of hatch coamings and are metal plates that can be moved hydraulically or lifted by
cranes (Stopford 2009).
Vertical arrangements made by metal or cell guides, are installed in each cargo hold.
They keep the containers in well-organized rows and give extra protection against
movement during sea turbulence. The main difference between the structure of
container ships and other merchant vessels such as oil tankers and bulk carriers is that
container ships have cell guides.
A method of three dimensions is used in the loading and unloading process to explain
the location of a container aboard the ship.
The first coordinate is the row, which starts in the front of the container ship.
The second coordinate is a tier. The first tier is at the bottom of the cargo holds and it
increases across the height of the cargo hold.
The third coordinate is the slot. Slots on the starboard side are given odd numbers and
those on the port side are given even numbers. The slots at the centerline are given low
numbers, and the numbers increase for slots near the end of the edges of breadth.
SAY 09 %2 10 08 0s 04 02 03 03 os 07 0s It I I I I I I I I so Be 84 82 to 10 04 02 12 0 410 02 Of 03 015 07 86 It SAYI1 (10) row
-
so
06Figure 18: The three dimensions of the cargo hold
3
I
- 4
1.6 Freight Market of Container ships
The act of hiring a ship to carry commodities is called chartering.
In the freight market, the following types of freights and contracts apply:
e Voyage Charter
In this case, the ship owner agrees to transport a given quantity of a commodity with a predefined vessel from a given port, A, to a given port, B, within a stated time period. The price is defined as $/tonne of commodity. The freight weight depends upon the quantity of the cargo loaded in the ship, except when the vessel is fixed on dead weight charter (Alizadeh and Nomikos 2009).
The ship owner pays every operational expense related to the vessel (fuel, crew, port charges, etc) with the only exception, probably, being the loading and unloading expenses.
The voyage charter may be:
1. Direct: this is performed within a few weeks after signing the contract, while the respective freight is called spot rate.
2. Forward charter: this is performed in the future, e.g. within two months after signing the contract.
3. Consecutive: this refers to a number of similar, repetitive vessels.
0 Time Charter
In this case, the vessel and the crew are leased for a specific time period. The ship owner provides the crew, the maintenance and guarantees that the vessel meets various performance criteria (speed, consumption, etc). In this case, the rate is determined differently, in $/day or DWT/month.
In addition, the charterer pays separately the following: Fuel, port expenses, loading and unloading expenses. During the specified charter period, the charterers may use
the vessel at their discretion; they may even sub-charter it. A time charter fixture report will detail the name of the vessel, its description, its delivery date, the rate of hire and the name of charterer.
There are three charters categories:
1. Direct
2. Forward charter
3. Bareboat charter: the charterer, apart from the fuel, port expenses, loading and unloading expenses, also provides the crew. In addition, a ship owner buys a vessel and does not wish to manage it but hands it over the charterer for a specific period, usually 10-20 years. The owner cannot be active in the operation of the ship and he acts as an investor.
The time charter market is less transparent for calculating the general market on a particular route. It is a very suitable measurement for charterers, ship owners and bankers because they are able to consider the ship's income and compare it to the breakeven cost (Alizadeh and Nomikos 2009).
" Contract of affreightment
* A Contract of affreightment is similar to a repetitive chartering contract but the name of the vessel is not defined in it. The ship owner is allowed to use any vessel, at his discretion, in order to comply with his contractual obligations. He can even use a vessel that is not under his control when signing the contract (e.g. he may fulfill his obligations by participating in the time charter as a buyer). Companies, which are using contract of affreightment, illustrate their industry as "industrial shipping" because their objective is to provide a service. Most of these shipping companies that are using this type of chartering, own bulk carriers that transport iron and coal and the major consumers are the steel mills of Europe and Far East.
The ship owner covers every operating expense of the vessel. The freight is calculated in a fixed price $/tonne of the commodity. One problem of this contract is that the volume and time schedule of the cargo is not usually known in advance.
The container shipping prices are divided into two categories: the first is the price to time-charter one TEU on a container ship, and the other is the freight rate which is the daily cost to distribute one TEU. The liner maritime companies use the Hamburg Index and Shanghai's Containerized Freight Index to determine the charter prices of containers. These indexes show the average daily cost of a TEU for a weight of 14 tons.
In addition, UNCTAD keeps a record of container freight rates expressed as the price for
a charterer to move one TEU along a given route. There are three main routes for liner
sector: Europe-Asia, Europe and Asia. In recent years the freight rate of USA-Asia route is higher than the other routes due to the high demand of Chinese products
in USA.
Containerized Freight Indices, 2010
3,000 1,500 1,,300 2,600 1,400 1200 1 27200 1100 2 2000100 E .0 900 1,.600 800W I Vro 700 1,200 600 1.000 Soo 1 4 7 10 13 16 19 22 25 28 31 34 37 40 43 46 49 Weec no.
-Shanghai - Europe (USD/TEU) = Shanghai - US west coast (USD/FEU)
mChina Containerized Preight Index (RH axis)
Source: Shanghai Shipping Exchange
2.Transportation of Natural
Gas
inside a TEU
2.1 Twenty Equivalent Unit (TEU)
The twenty-foot equivalent unit is the most common unit of cargo capacity regularly used to illustrate the deadweight of container ships. It is a standard-sized metal box which has the ability to be transported easily by sea (ships) and land (trucks and trains). The height of TEU ranges from 1.30 meters to 2.90 meters. The most common height is
2.59 meters.
The maximum gross weight for a TEU container is 24tons. Subtracting the empty container weight, the maximum load a TEU can carry is reduced to 21.8 tons.
8ft
Figure 21: Dimensions of a TEU Container
Inside a TEU, four cylinders can be installed to carry compressed natural gas. In this project, two materials are examined for the manufacture of the cylinders. The materials are Steel (X120 steel grade) and composites (Carbon Fiber Type 4).
2.2
Steel- X120 grade
The first Compressed Natural Gas (CNG) project, using steel pressure vessels mounted on the deck of a ship, was conducted off the coast of New Jersey in 1966. It was concluded that it was not feasible because the weight of steel pressure vessels required, would be too heavy for the host ship to carry. Thus, CNG development stagnated for thirty years.
Since then, the demand of Natural gas has been increasing rapidly. Pipeline Companies try to reduce the gas transportation costs. These expenses can be reduced by high strength operating pressure and thin wall pipes. Conventional steel lacks strength. The technological advancement of plate manufacturing helps these companies to exploit the high strength of steel. Over the last decades, engineers increased transportation efficiency by increasing the diameter of pipelines. Today, the highest pipeline uses X100 grade. In 1993 ExxonMobil accelerated the improvement of X120 pipeline technology
(Valsgard, Lotsber, Sigurdsson and Mork 2010).
150
-100
Stmegth
50
0
x5e
1950
X120
e
X120
X60
X..
1960 1970 1980
2000
2020
Yecar of Comlercial Readiness
Figure 22: The rapid improvement of X120b.
-The growth targets were set to create a minimum yield stress of 827 MPa. -The initial X120 target properties were for dry gas transportation and stress-based design with wall thickness up to 20 mm.
Yield Strength
Tensile Strength
8 927MPa
>931 MPa
827
MPa
931 MPa CVN Toughness @-30*C 2231J 84JCTOD@ -20*C
>014mm
0.08 mm (seam)
20.13 mm(girth) DBTT (vTre) <-50*C BDWTIT (SA%)@ -200C 75%Yield / Tensile Ratio <0.93
Table 2: Properties X120 steel grade
2.3 Carbon Fiber Type 4
In 1999, Mr. Steven Campbell developed a technique of CNG transportation that overcame all the steel pressure vessels drawbacks. He used composite pressure vessels for Trans Ocean Gas and concluded that these vessels were safe and cost efficient. These vessels have been used by various industries such as aerospace, automotive and defense. Since composite pressure vessels have been successfully utilized to carry natural gas for fuel on public busses, they can also be used in a ship-based CNG transportation system.
The most important advantages of using carbon fiber pressure vessels over steel pressure vessels for the transportation of compressed natural gas are:
1) Better rupture characteristics 2) Corrosion resistant
3) Much lighter
f"a Resin
Price-50
CNG Tank, 190 lit.
100 160 200 250
Vessel Weight (kg)
Figure 23: Comparison of the weight and cost of each material
2.4 Dimensions of the TEU
TELJ____ ____
Length 6,1 meters
Width 2,44 meters
Height 2,59 meters
Volume 39 cubic meters
Weight 2,2 tons
2.5 Sketch of the TEU
Side View Plan View
2.59 m 6.1 m 2.44 m (0 M0 0 100% 90% 80% 70% 60% 50% 40% 30% 20% Low
iiinMce XStrand* (Type 4)
---
l
2.6 Analysis of the cylinders
2.6.1 Determination of the steel cylinders thickness
The pressure inside the cylinder pushes against the area that is equal to the inside
diameter of the cylinder. The pressure times the diameter is equal to the force
produced by internal pressure. That force has to be balanced, otherwise the cylinder
would rupture. The area of the metal in the cylinder is equal to twice the thickness and
creates another force. These two forces must be equal and hence the minimum
thickness can be determined.
F= P-D= 2-f
f = Uyield t
P-D=2-a-t
t=
2 - ay
Diameter of a cylinder = 1.2 meters
Maximum Pressure
=250 bar
=25 MPa
Gyieldof X120 steel grade
=827 MPa
Hence,
P -D
25-1.2
t = - =
2
2=
0.018 meters=1.8
cm2 - ca
2-827
2.6.2 Dimensions of the cylinders
Pressure inside the cylinders
250
bar
Cylinder's length
6
meters
Material
X120
Steel grade
Thickness
0,020
meters
Diameter of the Cylinder
1,2
meters
Diameter of the Inner Cylinder
1,16
meters
Yield Strength of steel
827
MPa
2.6.3
Calculation of cylinders volume
Cylindrical Section
Length
4,8
meters
Outside Height
1,2
meters
Inside Height
1,16
meters
Inner Volume
5,1
cubic meters
Total Volume
5,4
cubic meters
Volume of Cylindrical Section
0,4
cubic meters
Semicircular Sections
2
Outer Radius
0,6
meters
Inner Radius
0,58
meters
Inner Volume
2,11
cubic meters
Total Volume
2,26
cubic meters
Volume of Semicircular Sections
0,15
cubic meters
Total Volume of Steel
0,50
cubic meters
]
L
2.6.4 Calculation of Weight of cylinders without CNG
Density of steel 7850 kg/cubic meters
Weight of Steel in one cylinder 3946 kg 4 tons
Weight of 4 cylinders in an TEU 15,8 tons
2.6.5
Determination of the Compressed Natural Gas inside
the four cylinders
Density of Natural Gas 0,7 kg/cubic meters Total Volume of Inner Cylinders in
FEU 7,18 cubic meters
Weight of Natural Gas (4 Cylinders) 5029 kg 5,0 tons
2.6.6 Total Weight of a TEU
Weight of the TEU+Cylinders+NG 23 tons
As it is mentioned in a previous section of this thesis, the maximum weight of a TEU 24 tons. Hence, using steel cylinders is reliable and valid for this project.
2.6.7 Determination of the Carbon Fiber (Type 4)
cylinders weight
According to the following figure and the composite cylinders company the ratio of the
CNG/Total weight is 57.7% or a ratio of 0.577. The weight of the compressed natural
gas is 5 tons this gives a weight for the composite container of 3.66 tons. This lowers
the weight of the TEU by 4.32 tons which is 34%.
Type 1 Type 2 Type 3 Type 4
93% 4% <2% <2%
Metal Metal Liner reinforced Metal Liner reinforced Resin impregnated with resin Impregnated with resin Impregnated continuous filament
continuous filament continuous filament with a non-metallic liner (hoop Wrap) (fully Wrap)
CrMo steel CrMo steel with Glass Aluminium with HP HDPE liner with Carbon Fiber Glass &lor Carbon
$3 to $5 $5 to $7 $9 to $14 $11 to $18
0.91.3 0.-1.0 OA-0. 0.3-CA
sou"
Figure 24: Weight and cost of each material
Therefore, the total weight of a TEU by using composites cylinder us 11.7 tons.
Weight of the NG 5 tons
CNG/Total Weight 0,577
Weight of the composites cylinders 3,67 tons
Weight of NG 5 tons
Weight of frame + TEU 3 tons
2.7 Strength Analysis of the TEU
1.2 meters
1.2 meters
Figure 25: Free Body Diagram of the cylinder
Mass of Natural gas inside the cylinder = 1250 kg Mass of cylinder's steel = 3950 kg
Total mass = 5200 kg
Weight = 5200 * 9.81 = 51012 N
Weight at each edge is = 51012/2 = 25506 N
6
= 450 s 12 1cO
-1
,EF = 0F
3x - F1, = 0 F3 -cosO = F1 - cosO F3 = F1Weight = F2 + F1, + F3,
25506
=
F
2+ F
1-sin& + F
3- sinO
25506 = F
2+ F
1- sin45" +
F3 -sin45
025506
=F
2+ F
1+
F3 -Al1 = Al2cos6
= Al3Euler'sformula states: Al
=F
14 -_1 F2*- 12 A-E -AEcos6
F1
1 =F
2 -12 -COS9 F-cos=
F2 -12 -cos6F
1 = F2 -cos26
=F
3F l
A E
F1 = F2 - -V(
2*-* F
1 = F2 - 0-5 = F3 Hence, 25506 = F2 + F1-2
25506 = F2 + F2 -
O.5
-
+ (F2 -0.5*1-)
F
2 =14941 N
F
1 = F3 = 7492N2.7.1 Tensile Stresses
11
= 13 =0.84
meters
12 =0.6
meters
Thickness = 0.03 meters -1 = 3 F -7492
=297302
N/r
2A
0.84* 0.03
F214941N
U2A
0.6-0.03=
6 - 0 3 =830111 N/2
8311
2.7.2 Beam Analysis
85 N/cm 6 metersTotal Weight of a cylinder
=51012 N
Length of the beam = 6 meters
Hence, 8500 N/m = 85 N/cm
EF = 0 EF = 0< Ra + Rb = 85 -600 = 51000 N Hence, Ra = Rb = 25500 N EM = 0 x=0 M=0 x=3 M = (25500 -300) -(85 -3) = 3825000 N -cm x=6 M=0
2.7.3 Shear Force and Bending Moment Diagrams
25500 N
3I m
25500 N
Bending Moment Diagram:
3im
+
1
3825000 N -cmI
Cross-Section:
A36 steel is going to be used. Force = 51012 N
Length = 600 cm
Young Modulus of A36 steel = 29000000 psi = 19994796 N/cm2
F -1 51012 -600 10 4cm
Al-AE~ 19994796-600-3
2.7.4 Compression Stresses on the beam
F
51012
a=F 50 = 28.34 N/cm2
A 600-3
A36 steel in plates, bars, and shapes with a thickness of less than 8 inches have minimum yield strength of 36,000 psi.
36000 psi = 24821 N/cm2
2.7.5 Maximum Bending stress
thickness
-width
23
-
1202
Wx = Moment of Resistance = 6- 6 = 7200 cm 36
6
M
3825000
- -- -= 82 0 531.25 N/cm2 W 7200Allowable bending stress for A36 steel: 22000 psi = 15168 N/cm2
Callowable > Ubending moment Hence, it is accepted.
2.7.6 Critical Buckling Point
In our case, Euler's formula for critical buckling point cannot be applied. Safety factor of A36 steel = 1.67
Fcritical = safety
factor
- ForceFcritical = 1.67 -51012 = 85190 N
Of course we can reduce the thickness of the cross-section in order the total weight of the FEU to be decreased
3. Compressors
A gas compressor is a mechanical device that increases the pressure of a gas by reducing its volume.
Types of Compressors:
The most important types of gas compressors are presented on the following figure (Bloch 2006):
L i Screw c
l
r~qid
Ring]
Scroll
Figure 26: Compressors Types
3.1 Reciprocating Compressors
Reciprocating compressors make use of pistons driven by a crankshaft. Their characteristics are:
e They are stationary or portable e They are single or multi-staged
They are used by many industries such as automotive, oil and gas industries. Their
benefit is the potential to reach discharge pressures up to 200 MPa and for that reason
they are the most efficient type of compressors. On the other hand, their big size and
high capital cost are their main disadvantages (Bloch 2006).
P1
Figure 27: Reciprocating Compressor
3.2 Centrifugal Compressors
Centrifugal compressors make use of an impeller to force the gas to the rim of the
impeller, increasing the velocity of the gas. A diffuser section is used in order to convert
the kinetic energy to pressure energy. These compressors are mainly used in the oil
industry and in natural gas processing plants. They are single and multi-staged
compressors. They can reach pressures up to 70 MPa (Bloch 2006).
3.3 Axial Compressors
Axial-flow compressors are dynamic rotating compressors that use arrays of fan-like airfoils to compress the gas. They are perfect for high flow rates of gases. They are multi-staged compressors (more than 5 stages). One important advantage of axial compressors is their high efficiency which reaches 90% at design conditions. Of course, for that reason they are expensive and need careful maintenance. Natural gas pumping stations use these types of compressors (Bloch 2006).
oVAIN SHAF N
DFIIVI= FROM TURBINE
Figure 29: Axial Compressor
3.4 Rotary Compressors
Rotary screws
screw compressors use two meshed, rotating, positive-displacement helical
to force the gas into a smaller space (Bloch 2006). Their features are:
Continuous
operation
e
Stationary or portable
* They produce a power up to 900 kW
Figure 30: Rotary Compressor
3.5 First Law of Thermodynamics
The first law of thermodynamics states that energy cannot be created or destroyed
during a process, although it may change from one form of energy to another in a
closed system (Borgnakke and Sonntag 2009).
AE =
Q
-W
The change in internal energy of a system is equal to the heat added to the system
minus the work done by the system.
The first law of thermodynamics can be expressed from the conservation of energy for
an open system.
Q
+(e
+ pU) initial * hinitial =(e
+ PU)final 'rfinal
+ We is the energy, u is the specific volume and p is the pressure.
For constant flow of mass: 7
initial = rnfinal = ?n
Hence, the above equation can be written as:
O
+ (e + pU) initial - 7 = (e + PU)final -r
+1
Oil injected into the Compressed gas system seals,
lubricates and
rgove heat hat Two-stage irrtake gas filter Oil separator
the compression. elemert
.Compressor
Micro oil filter Cool oil
retumn Belt
Gas- Oil
Separator
Compresd '- Oiyoutlet
Oil cooler Hot separated oil gas to oil cooler Motor
It is known that energy e is the addition of the kinetic, potential and internal energy of a
substance.
Hence, e+pv can be represented as:
v 2
e + pv = u + pv +-
+ gz
Enthalpy h is equal to u+pv.
By multiplying the above equation by the mass, it is obtained that:
h
=
u + pv
mh = mu + mpv
H = U + PV
which is the enthalpy of the whole mass that flows inside the system
Therefore,
Q
+ (e + PU)initial -7h = (e + pu)final -?m +W
can be written as+
(
2(h + ,+ gzinitial
S ( 2
T h = ( h -T g z f in a l
3.6 Ideal Gas Laws
A perfect gas is one that obeys the laws of Boyle, Charles and Amonton. In reality, there are no truly ideal gases, but these laws are used and corrected by compressibility factors based on experimental data (Bloch 2006).
Boyle's Law:
At constant temperature the volume of a perfect gas varies inversely with the pressure.
V2 P1
V1 P2
P2 -V2 =
P
1-V
1 =constant
Charles' Law:
The volume of a perfect gas at constant pressure varies as the absolute temperature:
V
2 T2 V1 T1 V2 _V 1 _ - --
-constant
T2 T1Amontons' Law:
At constant volume the pressure of a perfect gas will vary with the absolute
temperature.
P2 T2 P1T,
P
-- 2 _p 1 =-constant
T2 T13.7 Perfect Gas Formula
Using Charles' and Boyles' laws, the following formula is developed which is the perfect
gas equation:
P - V = n-- R - T
Where P is pressure in Pascal, V is the gas volume in
m
3, n is the number of moles of
the gas, T is the absolute temperature in Kelvin and R is the universal gas constant and
equals to 8.31 mo.
3.8 Compressibility
All the gases deviate from the above ideal gas laws. It is essential that these deviations
be considered in many compressor calculations in order for the results to be reliable.
Compressibility is taken into account from the records on the real performance of a
particular gas under pressure-volume-temperature changes. Hence, Z factor becomes a
multiplier in the perfect gas equation (Cravalho, Smith, Brisson and McKinley 2005).
The ideal gas formula can be written as:
P-V =Z-n-R-T
Or
P -V
Z =RT
Compressibility factor Z is defined as the ration of the actual volume (at a given
pressure and temperature) to the ideal volume of a perfect gas. In addition, it
determines how real gas diverges from actuality.
Z factor can be calculated by PVT laboratories and from published charts such as the
one shown in the following figure.
PEUDO
gVCEvD PMESURC3.9 Theoretical Compression cycles
There are two types of compression cycles that are valid to compressors.
Isothermal Compression is when the temperature is kept constant as the pressure increases. Of course, this is an ideal compression cycle and cannot be implemented easily on a compressor. This needs constant removal of the heat of compression.
Isothermal compression obeys the following equation:
P
1 - V1 = P2 - V2 = constantAdiabatic compression is obtained when there is no heat added or removed from the gas during compression. It obeys the following formula
P1 - 1 = P2 V2
where k is the ratio of the specific heats.
1E D CSB AB - ADIABATIC AC -POLYTROPIC AD -ISOTHERMAL THEORETICAL NO CLEARANCE F A VOLUME-0
FIGURE 1.7 A p-V diagram illustrating theoretical compression cycles. (Dresser-Rand Company,
Painted Post, N. Y)
Figure 32: Pressure-Volume Diagram
The above figure shows the theoretical isothermal and adiabatic cycles on a pressure-volume diagram. The area represents the work required from a compressor. It is observed that the work required for the isothermal process is less than the work required for the adiabatic process.