HAL Id: hal-02458624
https://hal.archives-ouvertes.fr/hal-02458624
Submitted on 26 Jun 2020
HAL is a multi-disciplinary open access
archive for the deposit and dissemination of
sci-entific research documents, whether they are
pub-lished or not. The documents may come from
teaching and research institutions in France or
abroad, or from public or private research centers.
L’archive ouverte pluridisciplinaire HAL, est
destinée au dépôt et à la diffusion de documents
scientifiques de niveau recherche, publiés ou non,
émanant des établissements d’enseignement et de
recherche français ou étrangers, des laboratoires
publics ou privés.
Isamu Matsuyama, Francis Nimmo, James Keane, Ngai Chan, G. Jeffrey
Taylor, Mark Wieczorek, Walter Kiefer, James P. Williams
To cite this version:
Isamu Matsuyama, Francis Nimmo, James Keane, Ngai Chan, G. Jeffrey Taylor, et al.. GRAIL, LLR,
and LOLA constraints on the interior structure of the Moon. Geophysical Research Letters, American
Geophysical Union, 2016, 43 (16), pp.8365-8375. �10.1002/2016GL069952�. �hal-02458624�
GRAIL, LLR, and LOLA constraints on the interior
structure of the Moon
Isamu Matsuyama1, Francis Nimmo2, James T. Keane1, Ngai H. Chan1, G. Jeffrey Taylor3,
Mark A. Wieczorek4, Walter S. Kiefer5, and James G. Williams6
1Department of Planetary Sciences, Lunar and Planetary Laboratory, University of Arizona, Tucson, Arizona, USA, 2Department of Earth and Planetary Sciences, University of California, Santa Cruz, California, USA,3Hawaii Institute of
Geophysics and Planetology, University of Hawaii, Honolulu, Háwaii, USA,4Institut de Physique du Globe de Paris, Paris,
France,5Lunar and Planetary Institute, Houston, Texas, USA,6Jet Propulsion Laboratory, Institute of Technology, Pasadena, California, USA
Abstract
The interior structure of the Moon is constrained by its mass, moment of inertia, and k2andh2tidal Love numbers. We infer the likely radius, density, and (elastic limit) rigidity of all interior layers by solving the inverse problem using these observational constraints assuming spherical symmetry. Our results do not favor the presence of a low rigidity transition layer between a liquid outer core and mantle. If a transition layer exists, its rigidity is constrained to 43+26
−9 GPa, with a preference for the high rigidity values. Therefore, if a transition layer exists, it is more likely to have a rigidity similar to that of the mantle (∼70 GPa). The total (solid and liquid) core mass fraction relative to the lunar mass is constrained to 0.0098+0−0.0066.0094and 0.0198+0.0026
−0.0049for interior structures with and without a transition layer, respectively, narrowing the range of possible giant impact formation scenarios.
1. Introduction
Planetary interior structure models suffer from an inherent nonuniqueness. However, it is possible to constrain the likely interior structure parameters using the available observational constraints. For the Moon, these con-straints are derived from seismic, lunar laser ranging (LLR), magnetic, gravity, and topography observations. The mean moment of inertia (MOI) is constrained by the combination of gravity and LLR observations [e.g.,
Bills and Rubincam, 1995], and the improved accuracy in the gravity data after the Gravity Recovery and
Interior Laboratory (GRAIL) mission [Zuber et al., 2013] has reduced the MOI uncertainty significantly [Williams
et al., 2014]. Although the uncertainty in the product of the gravitational constant G and the lunar mass was
also reduced significantly by the GRAIL mission, the mass uncertainty is dominated by the uncertainty in G [Williams et al., 2014]. The Moon deforms in response to tidal forcing, and this generates topography and gravity variations that depend on the interior structure. These gravity and topography constraints can be char-acterized by the k2and h2tidal Love numbers, whose uncertainties were also reduced significantly by analysis of GRAIL, LLR, and Lunar Orbiter Laser Altimeter (LOLA) data [Williams et al., 2014; Mazarico et al., 2014; Williams
and Boggs, 2015].
The Moon is the only other terrestrial body besides Earth for which seismic constraints are currently available. Modern seismic studies using Apollo data constrain the seismic wave velocity distribution and reveal an inte-rior structure consisting of a crust and mantle [Garcia et al., 2011; Lognonné and Johnson, 2015]. Inversion of the same data using a Monte Carlo exploration methods favors a thin crust and a uniform upper mantle [Khan et al., 2000; Khan and Mosegaard, 2001, 2002]. Modeling of seismic [Garcia et al., 2011; Weber et al., 2011], induced magnetic dipole moment [Hood et al., 1999; Shimizu et al., 2013], and rotational dissipation [Williams
et al., 2001] data indicates the presence of a liquid and metallic outer core.
Seismic data show that S waves are highly attenuated below a depth ∼1000 km, and partial melting at the bottom of the mantle was suggested as a possible explanation [Nakamura et al., 1973, 1974]. Recent studies carrying out inversions using multiple geophysical constraints [Khan et al., 2014; Matsumoto et al., 2015] and reanalysis of Apollo seismic data [Weber et al., 2011] seem to confirm the presence of such a layer.
RESEARCH LETTER
10.1002/2016GL069952
Key Points:
• The interior structure of the Moon is constrained using the observed mass, moment of inertia, and Love numbers • The probability distributions of the
interior structure parameters are provided
• The presence of a low rigidity transition layer at the base of the mantle is not required
Supporting Information: • Supporting Information S1 Correspondence to: I. Matsuyama, isa@lpl.arizona.edu Citation:
Matsuyama, I., F. Nimmo, J. T. Keane, N. H. Chan, G. J. Taylor, M. A. Wieczorek, W. S. Kiefer, and J. G. Williams (2016), GRAIL, LLR, and LOLA constraints on the interior structure of the Moon, Geophys.
Res. Lett., 43, 8365–8375,
doi:10.1002/2016GL069952.
Received 14 JUN 2016 Accepted 29 JUL 2016
Accepted article online 2 AUG 2016 Published online 19 AUG 2016
©2016. American Geophysical Union. All Rights Reserved.
Table 1. Observational Constraints Used in the Papera
Parameter Symbol Value and Uncertainty Reference
Mean radius R(km) 1737.15 Williams et al. [2014]
Mass M(1022kg) 7.3463±0.00088 (0.012%) Williams et al. [2014]
Mean solid MOI Is∕(MR2) 0.393112±0.000012 (0.003%) Williams et al. [2014]
Monthly tidal quality factor Q′ 38±4 (11%) Williams and Boggs [2015]
Dissipation frequency dependence factor 𝛼 0.25±0.15 (60%) Gribb and Cooper [1998], Jackson [2000], and Tan et al. [2001]
Observed Love number k′
2 0.02422±0.00022 (0.9%) Williams et al. [2014]
Elastic Love number k2 0.0220±0.0017 (7.7%) This work
Observed displacement Love number (LOLA) h′
2 0.0371±0.0033 (8.9%) Mazarico et al. [2014]
Elastic displacement Love number (LOLA) h2 0.0338±0.0053 (15.7%) This work
Observed displacement Love number (LLR) h′
2 0.0473±0.0061 (12.9%) Williams and Boggs [2015]
Elastic displacement Love number (LLR) h2 0.0432±0.0085 (19.7%) This work
aThe mean solid moment of inertia (MOI) andk
2Love number values are taken from Williams et al. [2014], rescaled to the adopted mean radius of 1737.15 km. The mean solid MOI does not include the liquid outer core contribution [Williams et al., 2014].
We constrain the radius, density, and (elastic limit) rigidity of all interior layers by solving the inverse problem using the observed mass, mean solid MOI, and tidal k2and h2Love numbers as constraints (Table 1) assuming spherical symmetry.
2. Methods
The likely model parameters given the available observational constraints can be determined using Bayesian probability (supporting information). We use an automatic parallel tempering Markov chain Monte Carlo (MCMC) algorithm [Gregory, 2005] to sample the multidimensional parameter space and calculate the prob-ability distributions of the model parameters.
2.1. Interior Structure Parameters
We assume a five-layer interior model and consider variations in the radius, density, and rigidity of all the layers. Table 2 summarizes the assumed range of the model parameters prior to the consideration of the observa-tional constraints. We consider models with and without a transition layer between the liquid outer core and mantle and explore the possibility of low rigidity for this layer.
We use crust density constraints based on admittance analyses using GRAIL gravity data [Wieczorek et al., 2013;
Besserer et al., 2014] to define the prior crust density range. The density increase with depth z is described by
𝜌(z) = 𝜌s+𝛿𝜌
(
1 − e−z∕d), (1)
where𝜌s = 2223+44−54kg m
−3is the surface density,𝛿𝜌 = 694+54
−44kg m
−3is the density contrast between frac-tured surface materials and deeper unfracfrac-tured rocks (whose grain density is 2917 kg m−3), and d = 9.0+2.2
−1.8
is an e-folding depth scale [Besserer et al., 2014]. We assume the best fit parameters of the farside as a whole because the nearside contains distinct mare regions characterized by high density. Ignoring these regions, the density increase with depth is thought to arise due to a decrease in porosity with depth. Integrating equation (1), the average crust density can be written as
𝜌c(h) =𝜌s+𝛿𝜌 [ 1 −d h ( 1 − e−h∕d)], (2)
where h is the crust thickness. Assuming the prior crust thickness range of 30–50 km and taking into account the uncertainties in all the model parameters, the largest average crust density range is 2660–2820 kg m−3, which we adopt as the prior range.
The mantle density is well constrained by the observed mass and mean solid MOI alone to 3355+12
−14kg m−3and
3359+12
−15kg m−3for interior structures with and without a transition layer, respectively (Table 2). We compute the volume-averaged mantle rigidity assuming these density ranges and the seismic S wave velocity profiles of Gagnepain-Beyneix et al. [2006]. Taking into account the uncertainties in density and S wave velocity, we infer a mantle rigidity range of 61–70 GPa. We adopt a slightly larger prior range of 60–70 GPa. Integrating the
Ta b le 2 . P rior R a nge a nd Expec ted V a lue of the M odel P a ramet ers U sing Diff er ent O bser vational C o nstraints a W ith a Transition La ye r W ithout a Transition La ye r P rior R a nges of Matsumot o et a l. [2015] M a ss ,M OI, k2 , M ass ,MOI, k2 , M ass ,MOI, k2 , M ass ,MOI, k2 , M ass ,MOI, k2 , C o nstraints M ass a nd MOI a nd LLR h2 and LOLA h2 M a ss and M OI and LLR h2 and LOLA h2 and LLR h2 P rior R a nge E xpec te d V alue Expec ted V a lue Expec ted V a lue Expec ted V a lue Expec ted V a lue Expec ted V a lue Expec ted V a lue P rior R a nge S o lid Inner C o re R a dius (k m) 1 – 500 138 + 49 − 134 136 + 48 − 130 134 + 41 − 128 195 + 143 − 82 203 + 140 − 143 203 + 146 − 62 166 + 121 − 80 1 – 400 Densit y (kg m − 3) 7600 – 7800 [ 7702 + 96 − 46 ][ 7702 + 96 − 94 ][ 7702 + 96 − 41 ][ 7701 + 97 − 99 ][ 7701 + 97 − 74 ][ 7701 + 97 − 69 ][ 8000 + 1 − 1 ] 7990 – 8010 Ri g id ity (G P a ) 2 0 – 6 0 -[ 40 + 18 − 19 ][ 40 + 19 − 20 ]-[ 40 + 20 − 19 ][ 40 + 19 − 18 ][ 40 + 19 − 20 ]2 0 – 6 0 Liquid O u te r C or e R a dius (k m) 1 – 500 287 + 104 − 73 275 + 98 − 72 265 + 97 − 71 390 + 32 − 61 381 + 28 − 51 373 + 25 − 43 314 + 47 − 38 1 – 400 Densit y (kg m − 3) 3400 – 7800 6017 + 1552 − 830 6193 + 1443 − 486 6272 + 1365 − 458 5588 + 1338 − 1318 5726 + 1805 − 1092 5871 + 1660 − 1022 5931 + 1817 − 563 3400 – 8000 T h ick ness (k m ) 0 – 499 149 + 43 − 144 139 + 46 − 133 131 + 44 − 125 195 + 91 − 190 178 + 59 − 172 169 + 67 − 163 148 + 47 − 143 0 – 399 Tr ansition Lay er R a dius (k m) 100 – 700 495 + 83 − 137 469 + 58 − 119 464 + 41 − 119 ---445 + 95 − 62 100 – 570 Densit y (kg m − 3) 3000 – 7800 4510 + 252 − 1128 4676 + 410 − 1179 4757 + 459 − 1154 ---[ 3552 + 95 − 43 ] 3450 – 3650 R ig idit y (G P a ) 1 0 – 70 -43 + 26 − 9 44 + 25 − 9 ---41 + 28 − 12 10 – 7 0 T h ick ness (k m ) 0 – 699 207 + 59 − 200 194 + 66 − 186 199 + 90 − 191 ---131 + 40 − 126 0 – 569 Mantle Densit y (kg m − 3) 3000 – 4000 3355 + 12 − 14 3357 + 12 − 13 3357 + 14 − 14 3359 + 12 − 15 3358 + 12 − 15 3359 + 10 − 15 3383 + 18 − 20 3349 – 3419 R ig idit y (G P a ) 6 0 – 70 -66 + 4 − 1 67 + 3 − 1 -66 + 4 − 1 67 + 3 − 1 [ 67 + 2 − 1 ]6 5 – 6 9 Crust T h ick ness (k m ) 3 0 – 50 [ 40 + 7 − 10 ][ 41 + 9 − 4 ][ 41 + 8 − 11 ][ 41 + 9 − 8 ][ 40 + 9 − 5 ][ 41 + 9 − 10 ] 42 + 8 − 3 30 – 5 0 Densit y (kg m − 3) 2657 – 2825 [ 2738 + 80 − 76 ][ 2736 + 43 − 74 ][ 2736 + 51 − 74 ][ 2738 + 50 − 76 ][ 2736 + 51 − 74 ][ 2734 + 29 − 72 ] 2557 + 57 − 152 2400 – 2800 Ri g id ity (G P a ) 1 5 – 2 5 -[ 20 + 5 − 5 ][ 20 + 5 − 4 ]-[ 20 + 4 − 5 ][ 20 + 5 − 4 ][ 20 + 5 − 4 ]1 5 – 2 5 a U n ce rt a int ie s in d ic a te th e 1 𝜎 cr edible re g ion. P aramet ers that a re unc o nstrained ,w ith a n e xpec te d range that is near ly the same as the p rior range ,ar e indicat e d w ith squar e b rack ets .T h e last tw o columns sho w the p rior ranges assumed b y Matsumot o et a l. [2015] and the expec ted values for an in v e rsion assuming these p rior ranges (F igur e S 7).
Love numbers computation into the MCMC sampling requires simple models with a small number of interior layers. Therefore, we ignore compressibility effects and assume a single layer for the mantle. The mantle den-sity constraint can be interpreted as a constraint for the volume-averaged denden-sity. Assuming a bulk modulus ∼130 GPa at the base of the mantle [Gagnepain-Beyneix et al., 2006], the density increase due to compress-ibility is ∼3%. However, there is also a temperature increase of ∼1000 K between top and bottom of the lunar mantle [Laneuville et al., 2013], and the effect of thermal expansion on the density largely offsets the effect of compressibility.
We assume a solid inner core composed of pure iron in the face-centered cubic phase with a prior density range of 7600–7800 kg m−3based on laboratory measurements at lunar pressure and temperature conditions [Antonangeli et al., 2015].
2.2. Anelastic Correction to the Tidal Love Numbers The observed tidal Love numbers k′
2and h′2describe the lunar deformation at the tidal forcing frequency and contain both elastic and anelastic components [Nimmo et al., 2012]. Therefore, the interior structure model must take into account the effects of anelasticity. However, doing so requires specifying the viscosity of all the interior layers, which decreases the resolution of the probability distributions due to the larger number of model parameters. Therefore, instead of calculating both components of the Love numbers, we follow the approach of Khan et al. [2014] and convert the observed Love numbers, k′
2and h ′
2, to elastic Love numbers, k2 and h2. The conversion can be written as
{ k2, h2}={k′ 2, h ′ 2 } 1 1 +Q1′cot (𝛼𝜋 2 ) , (3)
where Q′is the observed tidal quality factor and its variation with frequency w is represented by an w𝛼 depen-dence (supporting information). This approximation allows us to compute the Love numbers with a smaller number of model parameters at the expense of larger uncertainties in the Love numbers, as described below, and fewer constraints. For example, we do not use the tidal quality factor constraints at periods longer than a month [Williams and Boggs, 2015]. Our inversions constrain the rigidities at the elastic limit because we use the elastic Love numbers as constraints.
Laboratory experiments on rocks at Earth’s upper mantle pressures and temperatures (similar to the lunar mantle conditions) and forcing periods ∼1–103s constrain𝛼 to the range 0.1–0.4 [e.g., GribbandCooper, 1998;
Jackson, 2000; Tan et al., 2001]. This range is consistent with Earth’s mantle constraints of𝛼 ∼0.15–0.4 based
on normal modes, Chandler wobble, tides, and rotation rate observations [e.g., Anderson and Minster, 1979;
Smith and Dahlen, 1981; Shito et al., 2004; Benjamin et al., 2006]. Constraining the frequency dependence of the
lunar tidal quality factor is challenging given the available observations. LLR observations of tidal influences on lunar orientation show lags for the monthly and yearly periods that imply similar tidal quality factors at those periods [Williams et al., 2001, 2014; Williams and Boggs, 2015]. This result has been explained as due to dissipation in a deep partial melt layer [Harada et al., 2014, 2016; Matsumoto et al., 2015], a high-temperature mantle [Nimmo et al., 2012], or nonlinear anelasticity [Karato, 2013]. The LLR constraints are based on forcing periods of 1 month or longer; however, we are using equation (3) to approximate the lunar response in the elastic limit. Therefore, we adopt the range inferred from laboratory experiments at lunar mantle conditions and forcing periods ∼1–103s (𝛼 = 0.25 ± 0.15).
We convert the observed Love numbers to elastic Love numbers using equation (3), taking into account the uncertainties in k′
2. h
′
2, Q
′, and𝛼 (Table 1). This increases the uncertainties in the Love numbers significantly. For example, the uncertainty in the k2Love number increases from 0.9 % for the observed value (k′2= 0.02422 ± 0.00022) to 7.7% for the elastic value (k2 = 0.0220 ± 0.0017). For comparison, Khan et al. [2014] obtained
k2= 0.0232 ± 0.00022 (0.9%) for the elastic value assuming the same observed value. The difference arises for two reasons. First, we consider the entire range of possible𝛼 values, while Khan et al. [2014] assumed only a single value of 0.3. Second, we calculate the uncertainty of the elastic value taking into account the uncertainties of all the parameters in equation (3), while Khan et al. [2014] assume the same uncertainty for the elastic and observed values.
We compare the Love numbers computed using the simple anelastic correction described by equation (3) with those obtained using the viscoelastic model of Nimmo et al. [2012]. The elastic limit Love numbers in
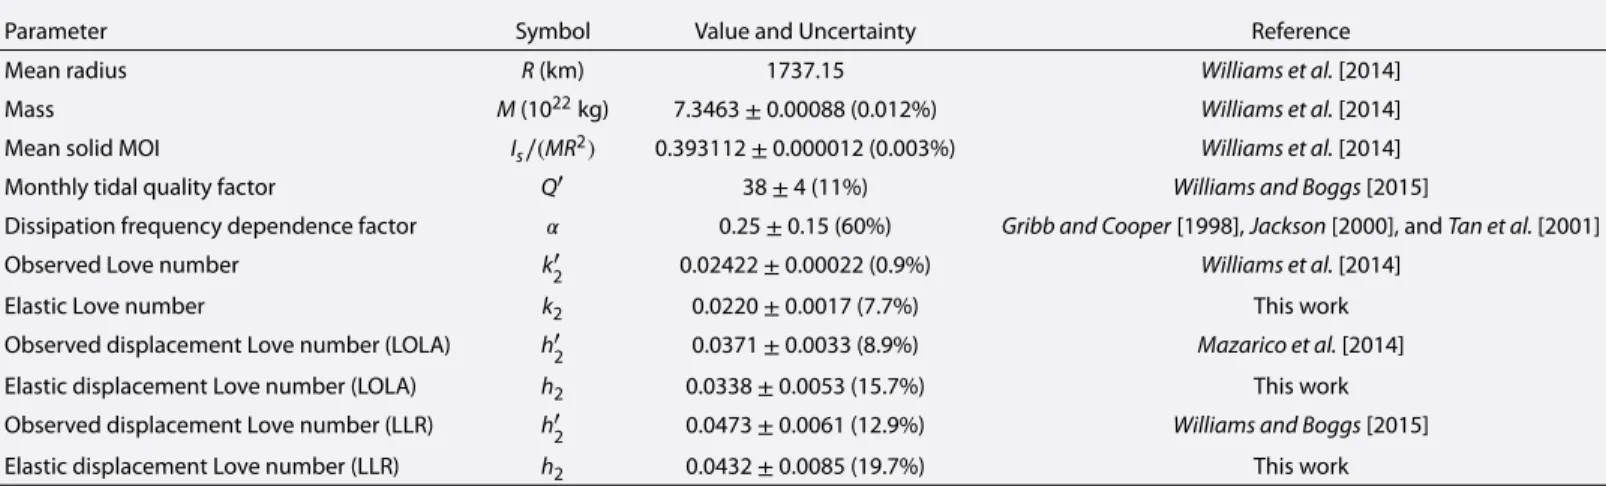
Figure 1. Marginal probability distributions of the model parameters for interior structures with (black edges) and without (white edges) a transition layer, using the mass, mean solid MOI, andk2, and (LLR)h2Love numbers as constraints (Table 1). Gray regions and error bars indicate the prior range and 1𝜎credible region (Table 2). The parameter space was sampled using107MCMC iterations with four parallel chains.
their model, k2= 0.0224 and h2= 0.0377, are consistent with the simple anelastic correction to the observed Love numbers, k2= 0.0220 ± 0.0017 and h2= 0.0371 ± 0.0033.
For a given interior structure, we compute the elastic Love numbers k2and h2using the classical propagator matrix method [e.g., Sabadini and Vermeersen, 2004]. The presence of a liquid outer core requires a special treatment because this causes the solid inner core and mantle to be mechanically decoupled but gravitational coupled. We use the method of Jara-Orué and Vermeersen [2011] to take into account this decoupling.
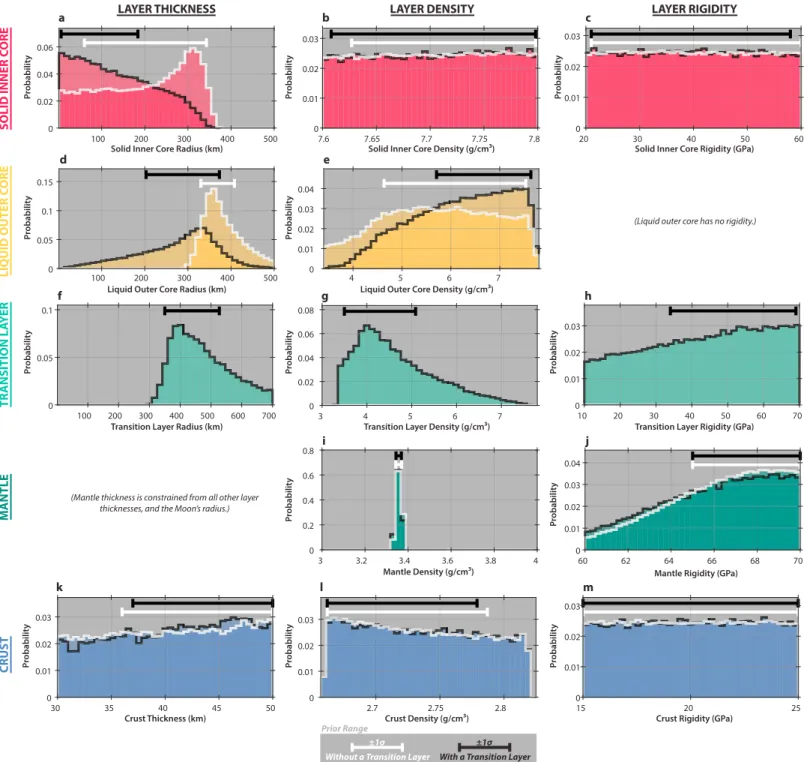
Figure 2. The 2-D marginal probability distributions of the model parameters for interior structures (a–f ) with and (g–l) without a transition layer, using the mass, mean solid MOI, andk2, and (LLR)h2Love numbers as constraints (Table 1). On each panel, the probability distribution is rescaled to a range of 0–1. Subfigures span the assumed prior range. Insets in Figures 2d, 2i, and 2j show magnified views. The parameter space was sampled using107MCMC iterations with four parallel chains.
3. Results
Table 2 and Figures 1 and 2 summarize the main results. We consider models with and without a transition layer and h2Love number constraints based on LOLA [Mazarico et al., 2014] and LLR [Williams and Boggs, 2015] observations. The results using the two different h2Love number constraints are nearly identical (compare Figures 1 and S4 in the supporting information and Figures 2 and S5), and we focus on results using the LLR constraint in the main text. Table 2 summarizes the assumed prior range, expected value, and the 1𝜎 credible region using both h2Love number constraints. Figure S1 shows the mean layer, mean density, and mean rigidity distribution as a function of depth. Figure S2 shows the probability distribution of rigidity and density as a function of depth.
Interior structure parameters that have a larger effect on the observed mass and mean solid MOI are generally better constrained because their uncertainties are smaller than those of the elastic Love numbers by orders of magnitude (Table 1). Independently of the presence of a transition layer, the mantle density is tightly con-strained near the mean density of the Moon because the mantle occupies a large fraction of the total volume. Assuming an interior structure with a transition layer, the solid inner core radius is constrained to 136+48
−134km,
the liquid outer core radius and density are constrained to 275+98
−72and 6193 +1443
−486 kg m
−3, and the transition layer thickness and density are constrained to 194+66
−186km and 4676 +410
−1179kg m
−3. Assuming an interior struc-ture without a transition layer, the solid inner core radius is constrained to 203+140−143km, and the liquid outer core radius and density are constrained to 381+28
−51and 5726 +1805
−1092kg m
−3.
The elastic Love numbers decrease as the rigidity of the interior layers increase, providing a constraint on these parameters. Independently of the presence of a transition layer, the mantle rigidity is constrained to 66+4
−1GPa,
with a preference for the high values in this range (Figure 1j). Assuming an interior structure with a transition layer, its rigidity is constrained to 43+26
−9 GPa, also with a preference for the high values in this range (Figure 1h). The solid inner core and crust rigidities are not constrained by the elastic Love numbers (Figures 1c and 1m). Figure 2 illustrates different correlations between model parameters by showing 2-D probability distributions. The 1-D probability distributions in Figure 1 can be obtained by integrating the 2-D distributions in Figure 2. As discussed above, the correlations arise predominantly due to the mass and mean solid MOI constraints. For example, the liquid outer core thickness decreases as the solid inner core radius increases (Figures 2a and 2g), and the liquid outer core density decreases as the liquid outer core radius increases (Figures 2b and 2h), as expected from the mass constraint. The probability distributions for an interior structure without a transition layer are better resolved using the same number of MCMC iterations, as expected due to the smaller number of model parameters. Once again, the mantle density is tightly constrained near the mean density of the Moon (Figures 2d, 2i, and 2j).
4. Discussion
Given the large uncertainties in the elastic Love numbers relative to those of the mass and mean solid MOI (Table 1), it is useful to consider the likely model parameters using only the latter as constraints. Table 2 and Figure S6 summarize the results for this inversion. Adding the Love numbers as additional constraints has a small effect, as expected (compare Figures 1 and S6). However, the elastic Love numbers provide constrains on rigidities, which are not constrained by the mass or the mean solid MOI.
Our results differ significantly from those of Yan et al. [2015], who also considered liquid outer core density and radius constraints using the mass and MOI. The discrepancies are not unexpected given the differences in the assumed prior ranges. Yan et al. [2015] considered crust thickness and density ranges of 30–50 km and 2900–3150 kg m−3, and a mantle density range of 3100–3300 kg m−3. We assume the same prior range for the crust thickness; however, we assume a prior crust density range of 26600–2820 kg m−3based on recent GRAIL constraints [Besserer et al., 2014] and a prior mantle density range of 3000–4000 kg m−3. These differences lead to large discrepancies because the mean solid MOI is sensitive to the crust and mantle densities. In fact, the prior crust density ranges do not intersect, and the mantle density range considered by Yan et al. [2015] is outside our inferred 1𝜎 credible region (3357+12
−13kg m
−3). The discrepancies between the two studies illustrate the large effect of incorporating improved crust density constraints from the GRAIL mission.
The mantle and crust constraints are not sensitive to the presence of a transition layer (Figures 1i–1m). This suggests that the presence of this layer cannot be justified using only the constraints used in this paper, which we confirm using Bayesian model comparison (supporting information). Given the observed mass, mean
solid MOI, and k2and h2Love numbers, the probability of an interior structure with a transition layer is 50% and 51% using the LLR and LOLA h2constraints, respectively. Therefore, the constraints used in this paper are insufficient to demonstrate the presence or absence of a transition layer.
The solid inner core radius, liquid outer core radius, and density constraints (Table 2) are consistent, within error bars, with previous estimates based on mass, moment of inertia, k2Love number, tidal dissipation qual-ity factor, seismic, and magnetic field constraints [Hood et al., 1999; Khan et al., 2004; Garcia et al., 2011; Weber
et al., 2011; Shimizu et al., 2013; Williams et al., 2014; Matsumoto et al., 2015]. The solid inner core radius
constraint (Figure 1a) is also consistent with the typical values≳100 km in recent thermal evolution models due to core crystallization [Zhang et al., 2013; Laneuville et al., 2014; Scheinberg et al., 2015]. The liquid outer core radius and density constraints for an interior structure without a transition layer (Figures 1d and 1e) are consistent with the seismic, mass, MOI, and k2Love number constraints of [Garcia et al., 2011] (380+40−40km and
5200+1000
−1000kg m−3), who assumed a similar interior structure. The low density of the liquid outer core in this
case requires the presence of light alloying elements like sulfur.
Following up on suggestions of partial melting at the bottom of the mantle by early seismic studies [Nakamura et al., 1973, 1974], recent studies argue for the presence of a low rigidity (≲30 GPa) layer over-lying the liquid outer core [Weber et al., 2011; Khan et al., 2014; Williams et al., 2014; Matsumoto et al., 2015;
Harada et al., 2016]. In contrast, we conclude that if such a layer is present, low rigidity is not favored by the
observed mass, MOI, and tidal Love numbers k2and h2. Figure 1h illustrates that the probability of the transi-tion layer rigidity favors a value similar to that of the mantle, with a maximum probability value ∼70 GPa and an expected value of 43+26
−9 GPa. This is consistent with the results of Nimmo et al. [2012], who concluded that there was no requirement for a low-velocity layer at the base of the mantle that is distinct from the overlying mantle to explain the seismic and monthly tidal dissipation factor (Q) and the tidal Love numbers k2and h2. Similarly, the reference model of Garcia et al. [2011] based on seismic, mass, MOI and Love number constraints does not include such a layer.
Previous studies suggesting the presence of a low rigidity layer use observational constraints that are not used in this paper (e.g., seismic, tidal quality factor, and electromagnetic sounding data) that could provide inde-pendent constraints on the interior structure. Weber et al. [2011], Williams et al. [2014], and Harada et al. [2016] considered forward models with a low rigidity transition layer and did not solve the inverse problem. Khan
et al. [2014] solved the inverse problem using mass, MOI, k2Love number, and electromagnetic sounding con-straints. However, they do not provide the probability distributions of the radius, density, and shear velocity of the interior layers. Furthermore, as discussed in section 2.2, Khan et al. [2014] assumed a larger elastic k2 Love number with an uncertainty that does not reflect the weak constraint on the frequency dependence of the tidal quality factor.
Matsumoto et al. [2015] solved the inverse problem using seismic, tidal quality factor, mass, MOI, and k2Love number constraints. They conclude that these constraints favor models with a low viscosity (∼ 3 × 10¹⁶Pa s) and low shear wave velocity transition layer. Their 95% credible regions for the transition layer density (3500+15
−15kg m−3) and shear wave velocity (2.9
+0.5
−0.5km s−1) correspond to rigidities in the range ∼20–42 GPa.
This range is consistent, within error bars, with our expected rigidity range (43+26
−9 GPa). However, our proba-bility distribution (Figure 1h) favors a rigidity similar to that of the mantle (∼70 GPa). Matsumoto et al. [2015] did not consider high rigidity transition layers on the basis that this requires a liquid outer core radius larger than the upper bound of 400 km found by Shimizu et al. [2013] using electromagnetic sounding data. We car-ried out an inversion with prior ranges that are consistent with those assumed by Matsumoto et al. [2015], including a prior liquid outer core radius range of 1–400 km (Table 2 and Figure S7). Changing the prior ranges affects the probability distribution, as expected. However, a transition layer rigidity similar to that of the man-tle (∼70 GPa) remains more likely (Figure S7h). We apply a simple anelastic correction to the observed Love numbers, while Matsumoto et al. [2015] use a viscoelastic model to compute the Love numbers at the tidal forcing period. The latter requires specifying the viscosity of all the interior layers, and this increases the num-ber of free parameters significantly. For example, our models with a transition layer contain 13 free parameters, while the models of Matsumoto et al. [2015] contain 24 free parameters. The smaller number of free parame-ters allows us to resolve probability distributions better (e.g., compare Figure 2b with Figure 3b of Matsumoto
et al. [2015]). This may explain why we obtain a unimodal probability distribution for the liquid outer core
of Matsumoto et al. [2015]). Alternatively, the differences between our results and those of Matsumoto et al. [2015] may be due to the additional tidal quality and seismic constraints used in Matsumoto et al. [2015]. As discussed above, the observational constraints used in this paper are insufficient to demonstrate the pres-ence of a transition layer. However, if such a layer exists, our inversions constrain its density to 4676+410
−1179kg m−3
(Table 2 and Figure 1g). Models of magma ocean crystallization [e.g., Snyder et al., 1992] show that crystalliza-tion of the lunar magma ocean would lead to late-stage products rich in ilmenite and high-Ca pyroxene, pos-sibly mixed with a smaller amount of Fe-rich olivine. Such an assemblage has a density of 3700 − 3800 kg m−3, substantially less buoyant than earlier, underlying magma ocean cumulates with a density ∼3300 kg m−3. This inverted density stratigraphy gave rise to the idea that the high-density cumulates would sink through the underlying mantle [Ringwood and Kesson, 1976; Hess and Parmentier, 1995; Elkins-Tanton, 2012]. Some of the sinking Fe- and Ti-rich material would be left behind as pods in the mantle to hybridize it and create the source regions for mare basalts, but most would sink through the mantle to form a layer above the metallic core. The density of the resulting cumulate layer at the base of the mantle depends strongly on the fraction of the magma ocean that had solidified at the time of cumulate pile overturn; this fraction can be quantified in terms of the remaining amount of interstitial liquid. In models of a 1000 km thick lunar magma ocean, the basal density after overturn is 3420 kg m−3for 10% interstitial liquid at the time of overturn, 3500 kg m−3for 5% interstitial liquid, and 3640 kg m−3for 1% interstitial liquid [Elkins-Tanton et al., 2011]. Our density models do not include density structure in the radius range 800–1000 km, and thus, our results for cumulate density cannot be directly compared to the relationship between cumulate density and interstitial liquid percentage for the 1000 km thick magma ocean modeled by Elkins-Tanton et al. [2011]. Nevertheless, the basic trade-off between basal density and interstitial liquid at the time of overturn will also apply to other magma ocean thicknesses. In our models in which a high-density transition layer is present, its most probable value is about 4000 kg m−3(Figure 1g), which would favor a very small amount of interstitial liquid at the time of magma ocean overturn. However, because our results permit models in which there is no transition layer at the base of the mantle, we cannot draw a firm conclusion about the details of a lunar magma ocean overturn.
5. Summary and Conclusions
We constrain the likely interior structure parameters of the Moon by solving the inverse problem using the observed mass, mean solid MOI, and elastic tidal Love numbers k2and h2as observational constraints. These constraints are insufficient to demonstrate the presence or absence of a transition layer between the liquid outer core and mantle. Therefore, we consider interior structures with and without this layer. The probability distributions, expected values, and uncertainties of all the model parameters are summarized in Table 2 and Figure 1. The mass and mean solid MOI provide the strongest constraints due to their small uncertainties relative to those of the elastic Love numbers.
The inferred solid inner core radius, liquid outer core radius, and density are consistent, within error bars, with previous estimates based on mass, moment of inertia, k2Love number, tidal dissipation quality factor, seismic, and electromagnetic induction constraints. In contrast to previous studies suggesting the presence of a low rigidity (≲30 GPa) transition layer, we conclude that if such a layer exists, its rigidity is more likely to be similar to that of the mantle (∼70 GPa) given the observational constraints used in this paper.
Simulations of the Moon formation from debris ejected by a large impact with the early Earth use the mass of the core as a critical constraint [e.g., Canup, 2012; ´Cuk and Stewart, 2012]. Despite the weak constraints on the
solid inner core properties, the stronger constraints on the liquid outer core properties allow us to constrain the total (solid and liquid) core mass. The total core mass fraction relative to the lunar mass is constrained to 0.0098+0.0066
−0.0094and 0.0198 +0.0026
−0.0049for interior structures with and without a transition layer, respectively, narrow-ing the range of possible giant impact formation scenarios. Core crystallization is a likely source of energy for powering a dynamo in the Moon’s past, and our constraints on the inner core size and liquid core density can be used to constrain the thermal evolution of the Moon’s core.
Observations of both the real and imaginary parts of the Love numbers may improve the constraints on the solid inner core and transition layer properties. However, incorporating these constraints requires adding the viscosity of all the interior structure layers as free parameters. This increases the number of model parameters significantly, which leads to less resolved probability distributions unless the number of inversion iterations is also increased significantly. Our results rely on the assumption of spherical symmetry. However, the observed
hemispheric asymmetry likely extends to the interior [e.g., Qin et al., 2012; Zhang et al., 2013; Laneuville
et al., 2013], and this affects the Moon’s response to tidal forcing [Qin et al., 2014]. The effect of hemispheric
asymmetries on tidal forcing and the corresponding Love numbers should be considered in future work.
References
Anderson, D. L., and J. B. Minster (1979), The frequency dependence of Q in the Earth and implications for mantle rheology and Chandler wobble, Geophys. J. R. Astron. Soc., 58, 431–440.
Antonangeli, D., G. Morard, N. C. Schmerr, T. Komabayashi, M. Krisch, G. Fiquet, and Y. Fei (2015), Toward a mineral physics reference model for the Moon’s core, Proc. Natl. Acad. Sci. U.S.A., 112, 3916–3919.
Benjamin, D., J. Wahr, R. D. Ray, G. D. Egbert, and S. D. Desai (2006), Constraints on mantle anelasticity from geodetic observations, and implications for the J2 anomaly, Geophys. J. Int., 165, 3–16.
Besserer, J., F. Nimmo, M. A. Wieczorek, R. C. Weber, W. S. Kiefer, P. J. McGovern, J. C. Andrews-Hanna, D. E. Smith, and M. T. Zuber (2014), GRAIL gravity constraints on the vertical and lateral density structure of the lunar crust, Geophys. Res. Lett., 41, 5771–5777, doi:10.1002/2014GL060240.
Bills, B. G., and D. P. Rubincam (1995), Constraints on density models from radial moments: Applications to Earth, Moon, and Mars,
J. Geophys. Res., 100(E12), 26,305–26,315.
Canup, R. M. (2012), Forming a Moon with an Earth-like composition via a giant impact, Science, 338, 1052–1055.
´Cuk, M., and S. T. Stewart (2012), Making the Moon from a fast-spinning Earth: A giant impact followed by resonant despinning,
Science, 338, 1047–1052.
Elkins-Tanton, L. T. (2012), Magma Oceans in the inner solar system, Annu. Rev. Earth Planet. Sci., 40, 113–139.
Elkins-Tanton, L. T., S. Burgess, and Q.-Z. Yin (2011), The lunar magma ocean: Reconciling the solidification process with lunar petrology and geochronology, Earth Planet. Sci. Lett., 304, 326–336.
Gagnepain-Beyneix, J., P. Lognonné, H. Chenet, D. Lombardi, and T. Spohn (2006), A seismic model of the lunar mantle and constraints on temperature and mineralogy, Phys. Earth Planet. Inter., 159, 140–166.
Garcia, R. F., J. Gagnepain-Beyneix, S. Chevrot, and P. Lognonné (2011), Very preliminary reference Moon model, Phys. Earth Planet. Inter.,
188, 96–113.
Gregory, P. C. (2005), Bayesian Logical Data Analysis for the Physical Sciences: A Comparative Approach With ‘Mathematica’ Support, Cambridge Univ. Press, Cambridge, U. K.
Gribb, T. T., and R. F. Cooper (1998), Low-frequency shear attenuation in polycrystalline olivine: Grain boundary diffusion and the physical significance of the Andrade model for viscoelastic rheology, J. Geophys. Res., 103(B11), 27,267–27,279.
Harada, Y., S. Goossens, K. Matsumoto, J. Yan, J. Ping, H. Noda, and J. Haruyama (2014), Strong tidal heating in an ultralow-viscosity zone at the core-mantle boundary of the Moon, Nat. Geosci., 7, 569–572.
Harada, Y., S. Goossens, K. Matsumoto, J. Yan, J. Ping, H. Noda, and J. Haruyama (2016), The deep lunar interior with a low-viscosity zone: Revised constraints from recent geodetic parameters on the tidal response of the Moon, Icarus, 276, 96–101.
Hess, P. C., and E. M. Parmentier (1995), A model for the thermal and chemical evolution of the Moon’s interior: Implications for the onset of mare volcanism, Earth Planet. Sci. Lett., 134, 501–514.
Hood, L. L., D. L. Mitchell, R. P. Lin, M. H. Acuna, and A. B. Binder (1999), Initial measurements of the lunar induced magnetic dipole moment using Lunar Prospector Magnetometer data, Geophys. Res. Lett., 26, 2327–2330.
Jackson, I. (2000), Laboratory measurement of seismic wave dispersion and attenuation: Recent progress, in Earth’s Deep Interior: Mineral
Physics and Tomography From the Atomic to the Global Scale, vol. 117, edited by S. Karato et al., pp. 265–289, AGU, Washington, D. C.
Jara-Orué, H. M., and B. L. A. Vermeersen (2011), Effects of low-viscous layers and a non-zero obliquity on surface stresses induced by diurnal tides and non-synchronous rotation: The case of Europa, Icarus, 215, 417–438.
Karato, S. (2013), Geophysical constraints on the water content of the lunar mantle and its implications for the origin of the Moon,
Earth Planet. Sci. Lett., 384, 144–153.
Khan, A., and K. Mosegaard (2001), New information on the deep lunar interior from an inversion of lunar free oscillation periods,
Geophys. Res. Lett., 28, 1791–1794.
Khan, A., and K. Mosegaard (2002), An inquiry into the lunar interior: A nonlinear inversion of the Apollo lunar seismic data, J. Geophys. Res.,
107(E6), 5036, doi:10.1029/2001JE001658.
Khan, A., K. Mosegaard, and K. L. Rasmussen (2000), A new seismic velocity model for the Moon from a Monte Carlo inversion of the Apollo lunar seismic data, Geophys. Res. Lett., 27, 1591–1594.
Khan, A., K. Mosegaard, J. G. Williams, and P. Lognonné (2004), Does the Moon possess a molten core? Probing the deep lunar interior using results from LLR and Lunar Prospector, J. Geophys. Res., 109, E09007, doi:10.1029/2004JE002294.
Khan, A., J. A. D. Connolly, A. Pommier, and J. Noir (2014), Geophysical evidence for melt in the deep lunar interior and implications for lunar evolution, J. Geophys. Res. Planets, 119, 2197–2221, doi:10.1002/2014JE004661.
Laneuville, M., M. A. Wieczorek, D. Breuer, and N. Tosi (2013), Asymmetric thermal evolution of the Moon, J. Geophys. Res. Planets, 118, 1435–1452, doi:10.1002/jgre.20103.
Laneuville, M., M. A. Wieczorek, D. Breuer, J. Aubert, G. Morard, and T. Rückriemen (2014), A long-lived lunar dynamo powered by core crystallization, Earth Planet. Sci. Lett., 401, 251–260.
Lognonné, P., and C. Johnson (2015), Planetary seismology, in Treatise on Geophysics, edited by G. Schubert, pp. 65–120, Elsevier, Oxford, U. K.
Matsumoto, K., R. Yamada, F. Kikuchi, S. Kamata, Y. Ishihara, T. Iwata, H. Hanada, and S. Sasaki (2015), Internal structure of the Moon inferred from Apollo seismic data and selenodetic data from GRAIL and LLR, Geophys. Res. Lett., 42, 7351–7358, doi:10.1002/2015GL065335. Mazarico, E. M., M. K. Barker, G. A. Neumann, M. T. Zuber, and D. E. Smith (2014), Detection of the lunar body tide by the lunar orbiter laser
altimeter, Geophys. Res. Lett., 41, 2282–2288, doi:10.1002/2013GL059085.
Nakamura, Y., D. Lammlein, G. Latham, M. Ewing, J. Dorman, F. Press, and N. Toksoz (1973), New seismic data on the state of the deep lunar interior, Science, 181, 49–51.
Nakamura, Y., G. Latham, D. Lammlein, M. Ewing, F. Duennebier, and J. Dorman (1974), Deep lunar interior inferred from recent seismic data,
Geophys. Res. Lett., 1, 137–140.
Nimmo, F., U. H. Faul, and E. J. Garnero (2012), Dissipation at tidal and seismic frequencies in a melt-free Moon, J. Geophys. Res., 117, E09005, doi:10.1029/2012JE004160.
Acknowledgments
The GRAIL mission is supported by NASA’s Discovery Program and is performed under contract to the Massachusetts Institute of Technology and the Jet Propulsion Laboratory, California Institute of Technology. A portion of the research described in this paper was carried out at the Jet Propulsion Laboratory of the California Institute of Technology, under a contract with the National Aeronautics and Space Administration. Government sponsorship is acknowledged. The data used are listed in the references and tables.
Qin, C., A. C. Muirhead, and S. Zhong (2012), Correlation of deep moonquakes and mare basalts: Implications for lunar mantle structure and evolution, Icarus, 220, 100–105.
Qin, C., S. Zhong, and J. Wahr (2014), A perturbation method and its application: Elastic tidal response of a laterally heterogeneous planet,
Geophys. J. Int., 199, 631–647.
Ringwood, A. E., and S. E. Kesson (1976), A dynamic model for mare basalt petrogenesis, in Proceedings of 7th Lunar Science Conference,
Houston, Texas, 15-19 March, pp. 1697–1722, Pergamon Press, New York.
Sabadini, R., and B. Vermeersen (2004), Global Dynamics of the Earth: Applications of Normal Mode Relaxation Theory to Solid-Earth
Geophysics, Kluwer Acad., Dordrecht, Netherlands.
Scheinberg, A., K. M. Soderlund, and G. Schubert (2015), Magnetic field generation in the lunar core: The role of inner core growth, Icarus,
254, 62–71.
Shimizu, H., M. Matsushima, F. Takahashi, H. Shibuya, and H. Tsunakawa (2013), Constraint on the lunar core size from electromagnetic sounding based on magnetic field observations by an orbiting satellite, Icarus, 222(1), 32–43.
Shito, A., S. Karato, and J. Park (2004), Frequency dependence of Q in Earth’s upper mantle inferred from continuous spectra of body waves,
31, L12603, doi:10.1029/2004GL019582.
Smith, M. L., and F. A. Dahlen (1981), The period and Q of the Chandler wobble, Geophys. J. Int., 64, 223–281.
Snyder, G. A., L. A. Taylor, and C. R. Neal (1992), A chemical model for generating the sources of mare basalts—Combined equilibrium and fractional crystallization of the lunar magmasphere, Geochim. Cosmochim. Acta, 56(10), 3809–3823.
Tan, B. H., I. Jackson, and J. D. Fitz Gerald (2001), High-temperature viscoelasticity of fine-grained polycrystalline olivine, Phys. Chem. Miner.,
28(9), 641–664.
Weber, R. C., P.-Y. Lin, E. J. Garnero, Q. Williams, and P. Lognonné (2011), Seismic detection of the lunar core, Science, 331, 309–312. Wieczorek, M. A., et al. (2013), The crust of the Moon as seen by GRAIL, Science, 339(6120), 671–675.
Williams, J. G., and D. H. Boggs (2015), Tides on the Moon: Theory and determination of dissipation, J. Geophys. Res. Planets, 120, 689–724, doi:10.1002/2014JE004755.
Williams, J. G., D. H. Boggs, C. F. Yoder, J. T. Ratcliff, and J. O. Dickey (2001), Lunar rotational dissipation in solid body and molten core,
J. Geophys. Res., 106, 27,933–27,968.
Williams, J. G., et al. (2014), Lunar interior properties from the GRAIL mission, J. Geophys. Res. Planets, 119, 1546–1578, doi:10.1002/2013JE004559.
Yan, J., L. Xu, F. Li, K. Matsumoto, J. A. P. Rodriguez, H. Miyamoto, and J. M. Dohm (2015), Lunar core structure investigation: Implication of GRAIL gravity field model, Adv. Space Res., 55, 1721–1727.
Zhang, N., E. M. Parmentier, and Y. Liang (2013), A 3-D numerical study of the thermal evolution of the Moon after cumulate mantle overturn: The importance of rheology and core solidification, J. Geophys. Res. Planets, 118, 1789–1804, doi:10.1002/jgre.20121. Zuber, M. T., et al. (2013), Gravity Field of the Moon from the Gravity Recovery and Interior Laboratory (GRAIL) mission, Science, 339,
![[PDF] Tutoriel informatique d Architecture des Ordinateurs pdf | Cours informatique](data:image/gif;base64,R0lGODlhAQABAIAAAP///wAAACH5BAEAAAAALAAAAAABAAEAAAICRAEAOw==)