Publisher’s version / Version de l'éditeur:
Optics Express, 25, 21, pp. 25435-25446, 2017-10-05
READ THESE TERMS AND CONDITIONS CAREFULLY BEFORE USING THIS WEBSITE. https://nrc-publications.canada.ca/eng/copyright
Vous avez des questions? Nous pouvons vous aider. Pour communiquer directement avec un auteur, consultez la
première page de la revue dans laquelle son article a été publié afin de trouver ses coordonnées. Si vous n’arrivez pas à les repérer, communiquez avec nous à PublicationsArchive-ArchivesPublications@nrc-cnrc.gc.ca.
Questions? Contact the NRC Publications Archive team at
PublicationsArchive-ArchivesPublications@nrc-cnrc.gc.ca. If you wish to email the authors directly, please see the first page of the publication for their contact information.
This publication could be one of several versions: author’s original, accepted manuscript or the publisher’s version. / La version de cette publication peut être l’une des suivantes : la version prépublication de l’auteur, la version acceptée du manuscrit ou la version de l’éditeur.
For the publisher’s version, please access the DOI link below./ Pour consulter la version de l’éditeur, utilisez le lien DOI ci-dessous.
https://doi.org/10.1364/OE.25.025435
Access and use of this website and the material on it are subject to the Terms and Conditions set forth at
Through-the-coating femtosecond laser inscription of very short fiber
Bragg gratings for acoustic and high temperature sensing applications
Hnatovsky, Cyril; Grobnic, Dan; Mihailov, Stephen J.
https://publications-cnrc.canada.ca/fra/droits
L’accès à ce site Web et l’utilisation de son contenu sont assujettis aux conditions présentées dans le site LISEZ CES CONDITIONS ATTENTIVEMENT AVANT D’UTILISER CE SITE WEB.
NRC Publications Record / Notice d'Archives des publications de CNRC:
https://nrc-publications.canada.ca/eng/view/object/?id=ce2e966f-aea4-4184-9459-8ce610b1741a https://publications-cnrc.canada.ca/fra/voir/objet/?id=ce2e966f-aea4-4184-9459-8ce610b1741aThrough-the-coating femtosecond laser
inscription of very short fiber Bragg gratings
for acoustic and high temperature sensing
applications
C
YRILH
NATOVSKY,
*D
ANG
ROBNIC,
ANDS
TEPHENJ. M
IHAILOVNational Research Council of Canada, Security and Disruptive Technologies, 100 Sussex Dr., Ottawa, ON, K1A 0R6, Canada
*Cyril.Hnatovsky@nrc-cnrc.gc.ca
Abstract: Very short Type I and Type II Bragg gratings, on the order of 100 µm in length, are written through the protective polyimide coating of high NA and standard single mode silica optical fibers with infrared femtosecond pulses and a phase mask. By exploiting the transverse walk-off of apertured diffracted beams produced by the phase mask and a slit placed proximate the mask, complex grating structures are fabricated and characterized. These gratings are suitable for structural health monitoring based on acoustic measurements or localized high-temperature measurements.
© 2017 Optical Society of America
OCIS codes: (060.3738) Fiber Bragg gratings, photosensitivity; (060.7140) Ultrafast processes in fibers; (110.0180) Microscopy; (140.3390) Laser materials processing.
References and links
1. N. E. Fisher, D. J. Webb, C. N. Pannell, D. A. Jackson, L. R. Gavrilov, J. W. Hand, L. Zhang, and I. Bennion, “Ultrasonic hydrophone based on short in-fiber Bragg gratings,” Appl. Opt. 37(34), 8120–8128 (1998). 2. N. Takahashi, K. Yoshimura, and S. Takahashi, “Detection of ultrasonic mechanical vibration of a solid using
fiber Bragg grating,” Jpn. J. Appl,” Phys. Part 1 39, 3134–3138 (2000).
3. D. C. Betz, G. Thursby, B. Culshaw, and W. J. Staszewski, “Acousto-ultrasonic sensing using fiber Bragg gratings,” Smart Mater. Struct. 12(1), 122–128 (2003).
4. C. Davis, D. Robertson, C. Brooks, P. Norman, C. Rosalie, and N. Rajic, “Reduced length fibre Bragg gratings for high frequency acoustic sensing,” Meas. Sci. Technol. 25(12), 125105 (2014).
5. B. Soller, D. Gifford, M. Wolfe, and M. Froggatt, “High resolution optical frequency domain reflectometry for characterization of components and assemblies,” Opt. Express 13(2), 666–674 (2005).
6. K. O. Hill and G. Meltz, “Fiber Bragg grating technology fundamentals and overview,” J. Lightwave Technol.
15(8), 1263–1276 (1997).
7. P. J. Lemaire, R. M. Atkins, V. Mizrahi, and W. A. Reed, “High pressure H2 loading as a technique for achieving
ultrahigh UV photosensitivity and thermal sensitivity in GeO2 doped optical fibres,” Electron. Lett. 29(13),
1191–1193 (1993).
8. J. Thomas, N. Jovanovic, R. G. Becker, G. D. Marshall, M. J. Withford, A. Tünnermann, S. Nolte, and M. J. Steel, “Cladding mode coupling in highly localized fiber Bragg gratings: modal properties and transmission spectra,” Opt. Express 19(1), 325–341 (2011).
9. K. Chah, V. Voisin, D. Kinet, and C. Caucheteur, “Surface plasmon resonance in eccentric femtosecond-laser-induced fiber Bragg gratings,” Opt. Lett. 39(24), 6887–6890 (2014).
10. A. Martinez, I. Y. Khrushchev, and I. Bennion, “Direct inscription of Bragg gratings in coated fibers by an infrared femtosecond laser,” Opt. Lett. 31(11), 1603–1605 (2006).
11. S. J. Mihailov, D. Grobnic, and C. W. Smelser, “Efficient grating writing through fibre coating with femtosecond IR radiation and phase mask,” Electron. Lett. 43(8), 442–443 (2007).
12. D. Grobnic, S. J. Mihailov, C. W. Smelser, and R. T. Ramos, “Ultrafast IR Laser Writing of Strong Bragg Gratings Through the Coating of High Ge-Doped Optical Fibers,” IEEE Photonics Technol. Lett. 20(12), 973– 975 (2008).
13. S. J. Mihailov, D. Grobnic, R. B. Walker, C. W. Smelser, G. Cuglietta, T. Graver, and A. Mendez, “Bragg grating writing through the polyimide coating of high NA optical fibres with femtosecond IR radiation,” Opt. Commun. 281(21), 5344–5348 (2008).
14. M. Bernier, F. Trépanier, J. Carrier, and R. Vallée, “High mechanical strength fiber Bragg gratings made with infrared femtosecond pulses and a phase mask,” Opt. Lett. 39(12), 3646–3649 (2014).
15. A. Martinez, M. Dubov, I. Khrushchev, and I. Bennion, “Direct writing of fibre Bragg gratings by femtosecond laser,” Electron. Lett. 40(19), 1170–1172 (2004).
#305216 Journal © 2017
https://doi.org/10.1364/OE.25.025435 Received 21 Aug 2017; revised 20 Sep 2017; accepted 24 Sep 2017; published 5 Oct 2017
16. K. Zhou, M. Dubov, C. Mou, L. Zhang, V. K. Mezentsev, and I. Bennion, “Line-by-Line Fiber Bragg Grating Made by Femtosecond Laser,” IEEE Photonics Technol. Lett. 22(16), 1190–1192 (2010).
17. P. Lu, S. J. Mihailov, H. Ding, D. Grobnic, R. Walker, D. Coulas, C. Hnatovsky, and A. Y. Naumov, “Plane-by-plane inscription of grating structures in optical fibers,” presented at 25th International Conference on Optical Fiber Sensors (2017), paper 103234M.
18. R. J. Williams, R. G. Krämer, S. Nolte, and M. J. Withford, “Femtosecond direct-writing of low-loss fiber Bragg gratings using a continuous core-scanning technique,” Opt. Lett. 38(11), 1918–1920 (2013).
19. S. J. Mihailov, C. W. Smelser, P. Lu, R. B. Walker, D. Grobnic, H. Ding, G. Henderson, and J. Unruh, “Fiber Bragg gratings made with a phase mask and 800-nm femtosecond radiation,” Opt. Lett. 28(12), 995–997 (2003). 20. C. Smelser, S. Mihailov, and D. Grobnic, “Formation of Type I-IR and Type II-IR gratings with an ultrafast IR
laser and a phase mask,” Opt. Express 13(14), 5377–5386 (2005).
21. C. Hnatovsky, D. Grobnic, D. Coulas, M. Barnes, and S. J. Mihailov, “Self-organized nanostructure formation during femtosecond-laser inscription of fiber Bragg gratings,” Opt. Lett. 42(3), 399–402 (2017).
22. A. V. Dostovalov, A. A. Wolf, A. V. Parygin, V. E. Zyubin, and S. A. Babin, “Femtosecond point-by-point inscription of Bragg gratings by drawing a coated fiber through ferrule,” Opt. Express 24(15), 16232–16237 (2016).
23. C. Hnatovsky, D. Grobnic, and S. J. Mihailov, “Nonlinear photoluminescence imaging applied to femtosecond laser manufacturing of fiber Bragg gratings,” Opt. Express 25(13), 14247–14259 (2017).
24. O. E. Martinez, “Pulse distortions in tilted pulse schemes for ultrashort pulses,” Opt. Commun. 59(3), 229–232 (1986).
25. Z. Bor, B. Racz, G. Szabo, M. Hilbert, and H. A. Hazim, “Femtosecond pulse front tilt caused by angular dispersion,” Opt. Eng. 32(10), 2501–2504 (1993).
26. A. A. Maznev, T. F. Crimmins, and K. A. Nelson, “How to make femtosecond pulses overlap,” Opt. Lett.
23(17), 1378–1380 (1998).
27. C. W. Smelser, S. J. Mihailov, D. Grobnic, P. Lu, R. B. Walker, H. Ding, and X. Dai, “Multiple-beam interference patterns in optical fiber generated with ultrafast pulses and a phase mask,” Opt. Lett. 29(13), 1458– 1460 (2004).
28. C. W. Smelser, D. Grobnic, and S. J. Mihailov, “Generation of pure two-beam interference grating structures in an optical fiber with a femtosecond infrared source and a phase mask,” Opt. Lett. 29(15), 1730–1732 (2004). 29. M.-C. Wu and R. S. Rogowski, “Fabrication of self-apodized short-length fiber Bragg gratings,” Appl. Opt.
42(25), 5017–5023 (2003).
30. J. W. Goodman, Introduction to Fourier optics, Roberts and Company Publishers, 2005, chapter 3. 31. D. Grobnic, S. J. Mihailov, R. Lausten, and C. Hnatovsky, “High Temperature Stable Fiber Bragg Gratings
(FBGs) Inscribed Through Polyimide Coating of Optical Fibers Using a Phase Mask,” Photonics and Fiber Technology 2016 (ACOFT, BGPP, NP), Sept. 5–8, 2016, Sydney, Australia, paper BM3B.2.
32. C. W. Smelser, F. Bilodeau, B. Malo, D. Grobnic, and S. J. Mihailov, “Novel Phase Mask Apparatus for “Through the Jacket” Inscription of FBGs in Unloaded SMF-28 Fiber,” in Bragg Gratings, Photosensitivity, and
Poling in Glass Waveguides (BGPP) (2010), paper BThD3.
33. S. J. Mihailov, C. W. Smelser, D. Grobnic, R. B. Walker, P. Lu, H. Ding, and J. Unruh, “Bragg Gratings Written in All-SiO2 and Ge-Doped Core Fibers With 800-nm Femtosecond Radiation and a Phase Mask,” J. Lightwave
Technol. 22(1), 94–100 (2004).
1. Introduction
Very short fiber Bragg gratings (FBGs) have already found applications in high-frequency acoustic sensing, where the gauge length of the FBG has to be shorter than half the wavelength of the strain field induced in the fiber core [1–4]. Another area where reduced-length FBGs may be used is high-spatial-resolution temperature sensing for harsh environments (up to 1000°C). Even though spatial resolution as fine as 10 μm in temperature/strain measurements was claimed with optical frequency-domain reflectometry and optical coherence-domain reflectometry [5], these techniques require relatively long data acquisition times (seconds) and in this respect are unsuitable for situations when the object under examination changes its characteristics on a smaller time scale.
Traditionally, the refractive index modulation inside an FBG is achieved by exposing the fiber to ultraviolet (UV) laser radiation [6]. Beside the fact that some photosensitization of the fiber core is required to enhance index change by UV light [7], the buffer coating on the optical fiber (i.e., acrylate or polyimide) is not transparent at the UV laser wavelength. As a consequence, several steps are typically involved in the fabrication of an FBG using the UV-laser technology, namely, i) photosensitization of the fiber and ii) removal of the protective coating and its reapplication after grating inscription. The latter steps in the process can
introduce structural flaws to the fiber surface, which weakens its ultimate strength and long-term reliability of the resultant FBG.
On the other hand, femtosecond (fs) laser-based FBG inscription technology circumvents all these problems due to the very nature of how ultrashort pulses interact with transparent dielectrics. Indeed, nonresonant multiphoton absorption of laser light inside transparent media can be easily achieved with focused pulses. The material surrounding the focal volume remains unaffected by the light passing through it, which allows one to write structures at any depth in a fiber in a 3-D fashion [8, 9]. For this reason, FBGs can be inscribed in almost any optical fiber through the protective coating if the pulses are focused sufficiently tightly [10– 14].
Using fs-lasers, FBGs can be produced i) by point-by-point [15], line-by-line [16], plane-by-plane [17], and continuous writing [18], when the fs-laser beam induces changes in the fiber in a sequential fashion or ii) when a length of the fiber is irradiated simultaneously through a phase mask [19]. The latter technique is faster, more accurate and, importantly, allows one to fabricate both Type I or Type II FBGs using the same laser by simply changing its beam parameters (i.e., pulse duration and pulse energy) [20, 21].
On the other hand, the mentioned sequential fs-writing techniques allow one to fabricate FBGs of nominally any length, including those that are very short [22], whereas the phase mask technique has been so far restricted to the inscription of millimeter- or centimeter-long FBGs due to the relatively large diameter of the fs-laser beam. Here, we demonstrate how the phase mask technique can be adapted to inscribe much shorter Type I and Type II gratings through the protective fiber coating with a slit-apertured fs-laser beam by exploiting the transverse walk-off of the diffracted beams that are generated by the phase mask. Using the transverse walk-off effect and the alignment technique based on nonlinear microscopy [23] one can accurately adjust the FBG length by simply varying the mask-to-fiber distance.
2. Theoretical background
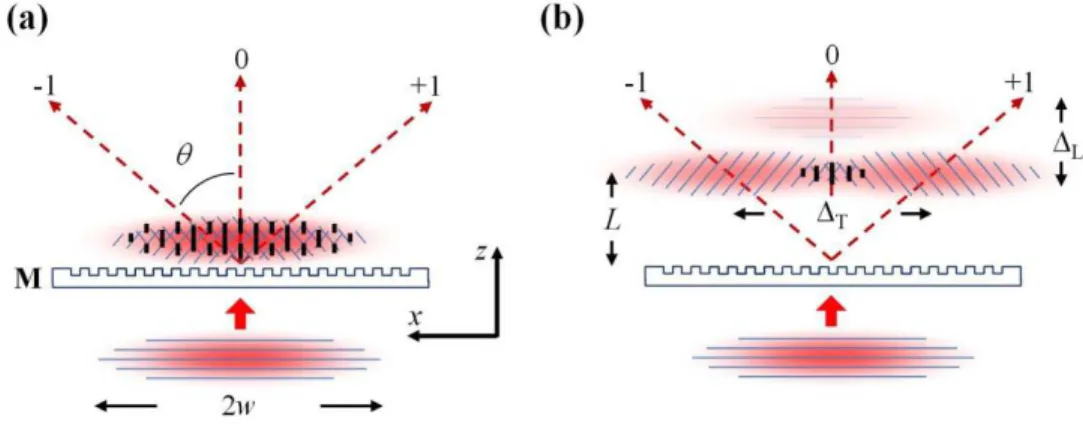
Interference patterns produced with fs-pulses and a phase mask (i.e., phase diffraction grating) can be described by a plane-wave model that takes the coherence properties and the bandwidth of the laser source into account. Consider a spatially unchirped and untilted fs-pulse falling onto a phase mask. The fs-pulse front is assumed to be parallel to the mask. After interaction of the pulse with the phase mask, a set of diffracted pulses is formed. The pulse fronts of the pulses in different diffraction orders remain parallel to the phase mask but, except for the 0th diffraction order, they are no longer parallel to their phase fronts, i.e., the diffracted pulses have become tilted [24–26]. A situation when the phase mask with a pitch d produces only the 0th and the 1st diffraction orders is presented in Fig. 1. Immediately after the mask, the diffracted pulses fully overlap and generally form a Talbot interference pattern, see Fig. 1(a) [27]. As the diffracted pulses propagate farther and farther away from the mask, the overlap along the z-axis becomes weaker. This effect is called the longitudinal walk-off [28]. The magnitude of the longitudinal walk-off ΔL is given by ΔL = L(1-cos(θ))/cos(θ),
where L is the distance from the phase mask to the peaks of the pulses diffracted in the 1st order and θ = sin−1(λ/d) is the diffraction angle corresponding to the central fs-laser wavelength λ. At a certain L, the pulses in the 0th and 1st diffraction orders stop overlapping altogether (Fig. 1(b)). In this case, the pulses diffracted into the ± 1-orders produce a pure two-beam interference pattern. Importantly, within the 1st diffraction order the overlap between the −1-order and + 1-order also becomes weaker as L is increased and the diffraction orders of the phase mask move away from each other. This is the transverse walk-off (ΔT in
Fig. 1(b)). The transverse walk-off for the 1st diffraction order can be calculated according to the following expression:
( )
T 2 tanL θ .
Fig. 1. Interference of ultrashort pulses after a phase mask that produces only the 0th and 1st diffraction orders. (a) A complex Talbot-like interference pattern formed near the phase mask (M) when the distance L from M is small. (b) Transverse (ΔT) and longitudinal (ΔL) walk-offs
become pronounced as L is increased. The pulse phase fronts are schematically depicted with blue lines.
In order to inscribe a very short FBG through the fiber protective coating three issues have to be simultaneously addressed. Firstly, the fs-pulses should be focused tightly to ensure that the light intensity at the polymer coating be much lower than at the fiber core. This is required because the laser damage threshold of polymers is typically several times lower than that of fused silica glass. Secondly, unless the mask features a very good 0th diffraction order suppression, the longitudinal walk-off ΔL should be sufficiently large to move the focus of the
0th order pulse away from the fiber surface or, conversely, very small to keep the 0th order focus well inside the fiber cladding. For a 1.07 μm-pitch phase mask (i.e., a mask used to inscribe FBGs with the first order resonance at ~1550 nm in standard telecom fiber), the diffraction angle θ for laser radiation centered at λ = 800 nm is large (i.e., ~49°) and the second scenario can be realized only when the fiber is placed a few tens of micrometers away from the mask. Thirdly, some beam shaping has to be applied to the output fs-laser beam, which typically has a quasi-Gaussian cross-sectional intensity profile, in order to confine the interference pattern along the x-axis to ~100 μm.
The following semi-quantitative analysis illustrates the latter point. Consider an untilted fs-pulse propagating along the z-axis (as in Fig. 1) with a Gaussian intensity profile in the xy-plane given by:
(
)
2( )
2( )
, .
GO
I x y =C G x G y (2)
where C is a normalization constant,
( )
2 2exp( / )
G x = −x w ,
( )
2 2exp( / )
G y = −y w , and w denotes the fs-beam waist radius at the 1/e2 level. These notations imply that the observation plane intersects the instantaneous spatial position of the peak of the pulse along the z-axis and the dependence of w on z is neglected. The pulse is incident on an ideal phase mask that produces only the ± 1-orders (i.e., the 0th diffraction order is fully suppressed) whose field amplitudes are equal and the phases are the same. The grooves of the mask are assumed to be parallel to the y-axis (Fig. 1). The time-averaged intensity distribution after the mask can then be written as:
(
)
(
(
)
(
)
)
2 2(
)
2( )
T T , 0.5 / 2 / 2 cos 2 / . G I x y = C G x− Δ +G x+ Δ πx d G y (3)provided that the observation plane intersects the peaks of the diffracted pulses. The extent of the fringes along x described by the cosine term is determined by the product of G(x-ΔT/2)
which ΔT is chosen. The maximum intensity in the fringe pattern is achieved when ΔT = 0 and
will gradually decrease as ΔT is increased. Keeping in mind that an FBG can be only
produced in regions where the fringe pattern is formed the shortest grating that can be written occurs when ΔT = 0. Taking into account that w is typically a few millimeters, writing very
short FBGs using Gaussian fs-pulses becomes difficult. With increasing ΔT, the unmodulated
non-overlapping portions of the beam begin to dominate. As grating writing is ultimately an intensity threshold effect [20], unmodulated beam portions will have higher intensities than their interfering regions making grating writing through the coating impossible without coating damage.
The simplest approach to better delineate the interference region is to decrease the width of the fs-beam along the x-axis by sampling the Gaussian beam with a narrow slit (i.e., oriented along the y-axis). This approach will produce a quasi-flat top beam intensity. Sub-millimeter length gratings have been inscribed this way using UV laser sources and phase masks [29]. With this approach, however, diffraction of the light on the slit plays a crucial role in defining the pulse intensity at the mask.
We consider a slit whose width 2s is smaller than the fs-beam diameter (i.e., 2w) and whose length is much larger than the beam diameter. Additionally, we assume that i) the slit width is much greater than the wavelength λ of illuminating light, ii) the fs-laser radiation is quasi-monochromatic and iii) the laser beam is perfectly spatially coherent. We analyze diffraction on the slit using the scalar theory of diffraction, which means that the electric field of the diffracted fs-laser pulse is characterized by a single scalar quantity. This is tantamount to saying that the results will be the same no matter how the fs-laser pulse is polarized. The latter assumption is justified by the fact that the size of the slit is much larger than the wavelength and the vectorial electromagnetic coupling effects, which occur at the slit edges and extend a distance of only a couple of wavelengths into the slit, can be completely ignored [30].
When the distance D from the slit to the observation plane is small, i.e., D < s, the rigorous Rayleigh-Sommerfeld formulation should be employed. When D >> (s4/8λ)1/3, the Fresnel approximation is quite adequate to analyze diffraction [27, 28].
The time-averaged intensity along the x-axis in a plane orthogonal to the fs-beam axis can then be written as
(
)
( )
2 2 1 , ( ) F I x y =C F x G y , where( )
( )
( ) 2 ' ' '. s i x x D s F x G x e dx π λ − − − =
(4)and C1 denotes a normalization constant. After the mask, due to the transverse walk-off, the
time-averaged intensity distribution becomes
(
)
(
)
2 2(
)
2( )
1 T T
, 0.5 / 2 ( / 2) cos 2 / .
F
I x y = C F x− Δ +F x+ Δ πx d G y (5)
if we assume, as before, that the observation plane intersects the peaks of the diffracted pulses. The interference fringes, which are spaced at d/2 and responsible for the FBG formation, will only appear at locations where the interference term in the previous expression is non-vanishing, i.e., where
(
)
*(
)
*T/ 2 ( T/ 2) T/ 2 ( T/ 2) 0.
F x− Δ F x+ Δ +F x− Δ F x+ Δ ≠ (6) In Fig. 2, we present the results of simulations based on the above formalism. We consider a limit situation when the slit width 2s = 1.4 mm is comparable to the distance from the slit to the observation plane D = 5 mm. The observation plane coincides with the grooved face of the phase mask. For these parameters, diffraction effects are relatively weak and the width of the diffraction pattern along the x-axis in the observation plane (red trace in Fig. 2) is approximately given by 2s. After the mask the −1-order and + 1-order become displaced
along the x-axis with respect to each other due to the transverse walk-off effect, with the region where the interference fringes are formed (black trace in Fig. 2) shrinking as L is increased. Because L << D, we assume that the intensity profile of the incident pulse at the mask and the intensity profile of the −1-order and + 1-order at a distance L behind the phase mask are the same. The intensity profile in the region where these pulses overlap (blue trace in Fig. 2) is quasi-flat-top, if one disregards the high-frequency modulation originating from the diffraction on the slit. We also note that the maximum light intensity in the interference pattern is respectively two and four times higher than that in the original pulse and the wings surrounding the central flat-top spike. By choosing a 500 µm value for L we ensure a ΔL~250
μm longitudinal walk-off and thus move the focus of the 0th order pulse out of the fiber protective coating. On the other hand, according to Eq. (1), the transverse walk-off ΔT for L =
500 µm is ~1.13 mm, which nominally allows us to localize the interference pattern along the
x-axis over a span 2s-ΔT ~270 μm. This scenario thus provides a plausible recipe to fabricate
very short FBGs in standard 125 μm-diameter coated fibers.
3. Experiment and Results 3.1 Laser-writing setup
An 80 fs Ti-sapphire regenerative amplifier operating at a central wavelength of λ = 800 nm was used in the experiments. The linearly polarized Gaussian beam (w = 3.5 mm) was focused through a phase mask (M; pitch either 1.057 μm or 1.071 μm; ~70% of the total diffracted power is in the 1st orders and ~30% is in the 0th order for both masks) into the optical fiber (OF) core using a plano-convex acylindrical lens (AL; focal distance 12 mm; the curved surface of AL is designed to reduce spherical aberration in one dimension), with the resultant line-shape laser focus being aligned parallel to the fiber axis (Fig. 3). The beam-shaping slit S was placed between AL and M, as depicted in Fig. 3. The linear polarization of the femtosecond beam was oriented perpendicular to the mask grooves. Type I FBGs for high-frequency acoustic sensing were written in polyimide-coated high-Germanium content optical fiber from Fibercore (SM1500(4.2/125)P), while Type II FBGs for high temperature sensing were written in polyimide-coated single mode optical fiber from Fibercore (SM1500(9/125)P). To inscribe the gratings, the laser beam was swept periodically across the fiber core at ~3 μm/s by dithering AL using a piezo-actuated translation stage.
x-coordinate, µm In ten si ty IF (x, y = con st ), a rb. u . 1500 1000 500 0 500 1000 1500 0 0.5 1
Fig. 2. Intensity profile of a Fresnel diffraction pattern formed after a 1.07 μm-pitch phase mask. The macroscopic intensity profile is depicted in blue. The black line shows regions where the d/2-spaced interference fringes are located. The intensity profile of the incident pulse at the phase mask is in red. In our simulation, w = 3.5 mm, s = 0.7 mm, D = 5 mm, L = 0.5 mm, and λ = 800 nm. The 0th diffraction order is assumed to be fully suppressed.
3.2 Writing beam diagnostics and fiber alignment
The intensity distribution in the focused fs-beam after the mask was imaged by means of a high numerical aperture (i.e., NA = 0.8) objective lens [23]. In Fig. 3 this technique is referred to as the direct imaging (DI) at λ = 800 nm. The optical path between S and the grooved surface of the 1.071 μm-pitch phase mask M was estimated at ~5 mm and the slit width 2s was ~1.4 mm, to experimentally reproduce the simulations in the previous section. The z-coordinate of AL was adjusted to focus the ± 1-orders at L~500 μm after M. The longitudinal walk-off ΔL was measured to be within 260-270 μm. The images were recorded using a
CMOS camera at a < 1 mW laser power and a 1 kHz pulse repetition rate.
The measured xy-intensity distribution of the focused slit-apertured fs-beam in the 1st diffraction order is presented in the top panels of Figs. 4(a) and (b). The intensity plots shown in the lower panels of Figs. 4(a) and (b) (i.e., intensity I(x)) were obtained by sectioning the corresponding xy-intensity distributions along the x-axis. In the ~250 μm region where the −1-order and + 1-−1-order overlap and interference fringes are formed the normalized intensity I(x) is ~1. At the edge of this region I(x) drops to ~0.25, as predicted. We also note that the intensity spikes in the blue trace in Fig. 2 are not observed in the experimental data. This can be attributed to the ~13 nm FWHM spectral bandwidth of the fs-pulses and also the fact that the edges of the slit are rugged and not exactly parallel. The model does not take these effects into account.
x
y
z
M
λ
AL
λ
2OF
DFM
λ
2NPM
λ
1DI
λ
S
Fig. 3. A schematic of the FBG inscription setup based on a slit-apertured femtosecond laser beam with a central wavelength λ = 800 nm. The intensity distribution after the phase mask M is visualized using direct imaging (DI) at λ = 800 nm. The fiber alignment is performed using nonlinear photoluminescence microscopy (NPM) at λ1 ~400 nm [21]. Characterization of the resultant FBGs is performed using dark-field microscopy (DFM) at λ2 = 637 nm [21].
As it was mentioned earlier, tight focusing of the fs-beam is required to inscribe FBGs through the protective fiber coating. In this case, alignment of the sharp line-shape laser focus with respect to the fiber core becomes a critically important stage in the laser-writing process. In our previous studies [23] we showed that the alignment procedure can be facilitated by monitoring nonlinear photoluminescence signal arising from the beam-fiber interaction. In Fig. 3 this technique is referred to as nonlinear photoluminescence microscopy (NPM) at λ1 = 400 nm.
Figure 5 demonstrates how the extent of the interference pattern in the polyimide-coated Fibercore single mode optical fiber can be controlled using the transverse walk-off effect by simply changing the distance from the mask to the fiber. To record the images, the fs-laser pulse repetition rate was 1 kHz and the pulse energy was kept at ~70 μJ. At such pulse energy
the material modification in the fiber core results only in a weak refractive index modulation (i.e., Δn = 5 × 10⁻⁶
), while the NPM-assisted alignment is still easily achievable.
The sequence of images in Fig. 5 was recorded by translating the fiber along z in 50 μm steps away from the mask and recording the respective transverse 2-D nonlinear photoluminescence intensity patterns with a CMOS camera. Because nonlinear photoluminescence is a precursor of multiphoton ionization, which occurs at higher pulse energies, the NPM images in Fig. 5 are expected to quite accurately represent the length of the resultant FBGs [23]. 0 0.5 1 0 20 40 60 80 0 0.5 1 0 20 40 60 80 x-coordinate, µm In ten sit y I (x ) x-coordinate, µm In ten si ty I (x ) (a) (b) y x y x
Fig. 4. Effects of the transverse walk-off on the focal light intensity distribution of a slit-apertured fs-beam in the 1st diffraction order. (a) shows the measured xy-intensity in the middle of the region where the + 1 and −1 diffraction orders overlap. (b) shows the measured
xy-intensity at the left edge of the region in (a). The scale along the axis, y-axis, and the
x-axis in the pertinent plots in (a) and (b) is the same.
3.3 Type I very short FBGs for high-frequency acoustic sensing
Non-destructive damage/defect detection based on high-frequency acoustic sensing requires the use of 200-300 μm-long low-loss Type I FBGs to probe the radiating elastic wave field. The wavelength of the elastic wave field has to be appreciably larger than the gauge length of the FBG to avoid a non-uniform strain along the FBG, which will result in an irregular reflection spectrum [4].
In order to increase the light-induced refractive index modulation in the fiber core, high-Germanium content optical fiber was used for the inscription of very short Type I FBGs. The grating length was adjusted using the transverse walk-off and NPM, as discussed earlier in the text. Dark-field optical microscopy (DFM in Fig. 3) at λ2 = 637 nm was employed for the visualization of laser-induced changes in the fiber under consideration [21]. Briefly, the
DFM-technique is based on launching visible probe light into the fiber core and collecting
scattered light originating from the laser-modified regions.
The FBGs in the polyimide-coated high-Germanium content fiber were produced using 120 μJ pulses at a 1 kHz repetition rate. During the grating inscription, the evolution of the grating reflectivity was continuously monitored using an erbium broadband source and an
optical spectrum analyzer. In order to inscribe an ~1 dB-strong (in transmission) grating, 3 × 10⁵ 120 μJ laser pulses had to be deposited into the fiber core. The pulse repetition rate was kept at 1 kHz. A DFM image, the reflection and transmission spectra, and the thermal stability curve of such a grating are presented in Fig. 6.
x z L = 650 µm 145 µm L = 600 µm L = 550 µm L = 500 µm M
Fig. 5. Controlling the overlap of diffracted fs-pulses after the mask using the transverse walk-off effect. Blue lines are the induced nonlinear photoluminescence originating from the interaction of the infrared fs-pulses with the core of the polyimide-coated Fibercore SM1500(9/125)P optical fiber.
Based on the grating length, the refractive index modulation inside it is ~10−3. The ~300 μm length is sufficient to make the grating relatively strong (i.e., ~0.8 dB in transmission), while such a length also allows one to probe acoustic fields in the MHz-range. The stability curve of the grating, see Fig. 6(c), indicates that annealing for 24 hours at 150 °C not only will give long term stability to the grating for room temperature operation but will also make it quasi-stable at 150 °C. Type I gratings written through the protective polyimide coatings of single mode fibers have been shown to have mechanical reliability approaching that of the pristine fiber [14], making these very short gratings suitable for acoustic-based structural health monitoring where the strain fields approach 50,000 microstrains [4] in amplitude.
3.4 Type II very short FBGs for high temperature sensing
In order to inscribe Type II gratings in the polyimide-coated Fibercore single mode fiber, an alignment procedure similar to the one presented for the Type I very short gratings was used. The laser beam exposure parameters used for the grating inscription were however different. After the alignment, the laser pulse energy was set at 250 µJ and the repetition rate was
reduced to 5 Hz to minimize the thermal load on the fiber. Under these conditions, very short (130 µm long) high temperature stable gratings (i.e., Type II gratings) were produced by depositing ~2·102 laser pulses into the fiber. During the writing process, the evolution of the grating structure was monitored using DFM. The control that nonlinear photoluminescence monitoring and DFM add to the inscription process also allows for the fabrication of more complex structures such as Fabry-Perot (F-P) grating cavities, as shown in Fig. 7(a), and grating arrays, as shown in Fig. 7(b).
-25 -20 -15 -10 -5 0 -1 -0.8 -0.6 -0.4 -0.2 0 1520 1540 1560 Wavelength, nm Tr ansm is sion l o ss, d B Ref lecti on l o ss , d B (a) (b) x z 142 µm No rmal iz e d re fl ecti v ity Time, h 0.8 0.9 1 0 50 100 150 200 0.85 0.95 0 5 c)
Fig. 6. A Type I FBG for high-frequency acoustic sensing written inside the high-Germanium content polyimide-coated fiber from Fibercore. (a) An optical image of a Type I FBG. DFM reveals the position and extent (~300 μm) of the grating. (b) The reflection and transmission spectra of the grating in (a). (c) The thermal stability curve of the grating in (a) at 150 °C.
To create the F-P cavity, the fiber was translated laterally after the first grating inscription. From the spectral plot of Fig. 7(a) the free spectral range (FSR) of the F-P cavity is 2.143 nm at a central wavelength of 1550 nm. This corresponds to an optical frequency separation of 2.67·1011 Hz. For an FBG based etalon, the FSR is:
/ 2 eff .
v c n l
Δ = (7)
where c is the velocity of light in a vacuum, neff is the effective index of the guided mode and
l is the separation between grating structures. Considering that the phase mask pitch used to
write a single grating element was 1.071 µm and the Bragg resonance peak occurs at 1552.0 nm, the neff of the guided mode is 1.450. From Eq. (5), the inter-grating separation is then 387
µm, which is consistent with the DFM image of the grating separation in Fig. 7(a).
We also note that much lower intensities of visible light are needed to visualize Type II FBGs compared with Type I FBGs using the DFM technique. Specifically, to obtain the DFM
image in Fig. 6(a) ~1 mW of red light at λ2 = 637 nm was coupled into the fiber core, whereas only 10-20 μW of the red light was required to record the DFM images in Fig. 7, with the CMOS camera settings being the same in both cases.
-25 -20 -15 -10 -5 0 1530 1540 1550 1560 1570 -20 -15 -10 -5 0 1520 1530 1540 1550 1560 (a) (b) Wavelength, nm Reflec tio n lo ss, d B Wavelength, nm Re fl e cti on l o ss, dB x z 145 µm
Fig. 7. A Type II FBGs for high-temperature sensing written inside the single mode polyimide-coated fiber from Fibercore. (a) A Fabry-Perot cavity formed by two Type II FBGs with the same period. The DFM image shows the separation and extent of the two FBGs. The reflection spectrum of the cavity (i.e., right panel of (a)) is in blue, the spectrum of the left FBG is in red. (b) A temperature sensor array formed by two Type II FBGs with different periods. The reflection spectrum of the sensor is in the right panel.
To test the high temperature stability of the Type II F-P cavity presented in Fig. 7(a), it was isochronally annealed in 100 °C steps from room temperature to 1000 °C, as seen in Fig. 8(a). The annealing test was done in a Lindberg high temperature furnace. An external thermocouple was used to confirm the accuracy of the furnace thermocouple measurement. The spectra of the F-P cavity at room temperature and at 1030 °C (after 2 days of annealing at this temperature) are shown in Fig. 8(b).
-25 -20 -15 -10 -5 0 1535 1545 1555 1565 1575 Ref lecti on l o ss, dB Wavelength, nm 0 5 10 15 0 200 400 600 800 1000 Temperature, °C Wa ve le n g th sh ift , n m
(b)
(a)
Fig. 8. Temperature sensing based on the Fabry-Perot cavity (F-P) shown in Fig. 7(a). (a) The shift of the F-P Bragg wavelength with temperature during annealing up to 1000 °C. (b) The spectrum of the F-P cavity at room temperature (blue trace) and at to 1030 °C (red trace).
Generally, through-the-coating inscription of fiber gratings using 800 nm radiation is enhanced by using a phase mask that produces a fundamental Bragg resonance in the fiber [28] but at the same time has good zero order suppression [31], as well as by using tight focusing optics that create a large differential in intensity between the fiber coating or jacket and the fiber core, such as a multiple lens system [32] or an adapted acylindrical lens that dramatically reduces spherical aberration present in short focal length cylindrical lenses [14].
In this work, all the FBGs were written with pure silica phase masks that would produce a fundamental Bragg resonance but whose diffraction efficiency in the 1st order is only 70%. Because the mask pitch approaches that of the irradiation wavelength, the best zero order suppression that can be realized through precision etching of pure silica alone is > 20% [33]. It is therefore necessary to separate the 0th- and 1st-order foci along the beam propagation direction via the longitudinal walk-off effect [28] thus placing certain constraints on the fiber-to-phase mask distance in order to avoid the multiple diffracted order interference depicted in Fig. 1 (a). The imposed minimum fiber-phase mask distance then imposes a lower limit on the slit width used to aperture the fs-beam. Phase masks with well suppressed 0th-order but that can also produce a fundamental Bragg resonance, such as those manufactured by Ibsen
Photonics, are expected to provide more flexibility in using slit-apertured fs-beams to inscribe
very short FBGs inside polyimide-coated fibers, as the constraint on minimum slit width is removed.
4. Conclusions
Very short Type I and Type II Bragg gratings, at the level of 100 µm, were inscribed through the polyimide coating of high NA and standard telecom single mode optical fibers using infrared femtosecond radiation and the phase mask method. The low-loss Type I gratings written through the coating are ideally suited for concatenation into sensor arrays for acoustically based structural health monitoring applications, while the short-length Type II devices are ideally suited to measure highly localized temperature gradients.


![[PDF] Support de formation informatique de Ruby on Rails détaillé - Cours informatique](data:image/gif;base64,R0lGODlhAQABAIAAAP///wAAACH5BAEAAAAALAAAAAABAAEAAAICRAEAOw==)