Publisher’s version / Version de l'éditeur:
Vous avez des questions? Nous pouvons vous aider. Pour communiquer directement avec un auteur, consultez la
première page de la revue dans laquelle son article a été publié afin de trouver ses coordonnées. Si vous n’arrivez pas à les repérer, communiquez avec nous à PublicationsArchive-ArchivesPublications@nrc-cnrc.gc.ca.
Questions? Contact the NRC Publications Archive team at
PublicationsArchive-ArchivesPublications@nrc-cnrc.gc.ca. If you wish to email the authors directly, please see the first page of the publication for their contact information.
https://publications-cnrc.canada.ca/fra/droits
L’accès à ce site Web et l’utilisation de son contenu sont assujettis aux conditions présentées dans le site
LISEZ CES CONDITIONS ATTENTIVEMENT AVANT D’UTILISER CE SITE WEB.
Proceedings of the Second International Conference on Underground Mining
Technology, pp. 273-284, 2020-11-04
READ THESE TERMS AND CONDITIONS CAREFULLY BEFORE USING THIS WEBSITE. https://nrc-publications.canada.ca/eng/copyright
NRC Publications Archive Record / Notice des Archives des publications du CNRC :
https://nrc-publications.canada.ca/eng/view/object/?id=a28f5a32-2d9d-4009-94d6-8af10ca5b44b https://publications-cnrc.canada.ca/fra/voir/objet/?id=a28f5a32-2d9d-4009-94d6-8af10ca5b44b
NRC Publications Archive
Archives des publications du CNRC
This publication could be one of several versions: author’s original, accepted manuscript or the publisher’s version. / La version de cette publication peut être l’une des suivantes : la version prépublication de l’auteur, la version acceptée du manuscrit ou la version de l’éditeur.
For the publisher’s version, please access the DOI link below./ Pour consulter la version de l’éditeur, utilisez le lien DOI ci-dessous.
https://doi.org/10.36487/ACG_repo/2035_12
Access and use of this website and the material on it are subject to the Terms and Conditions set forth at
Ground support loading monitored with Rock Bolt Sensor (RBS™) and
relationship to nearby production and seismicity
Smith-Boughner, Lindsay; Anderson, Zara; Sun, Zhigang; Levesque, Daniel;
Kruger, Silvio; Quenneville, Yves; Jalbout, Ali; Szirti, Jonathan; Royer,
Ground support loading monitored with Rock Bolt Sensor
(RBS™) and relationship to nearby production and seismicity
L Smith-Boughner ESG Solutions, CanadaZ Anderson ESG Solutions, Canada
Z Sun National Research Council of Canada, Energy, Mining and Environment Research Centre, Canada D Levesque National Research Council of Canada, Energy, Mining and Environment Research Centre,
Canada
S Kruger National Research Council of Canada, Energy, Mining and Environment Research Centre, Canada Y Quenneville National Research Council of Canada, Energy, Mining and Environment Research Centre,
Canada
A Jalbout IAMGOLD, Canada
J Szirti Newmont Corporation, Canada R Royer National Resources Canada, Canada R Lacroix National Resources Canada, Canada
Abstract
The National Research Council of Canada has developed a novel ultrasound based Rock Bolt Sensor (RBS™) to monitor load, deformation, and integrity of rock bolts. Several RBSs were deployed to monitor bolts in the roof of an intersection of two drifts and with another region of monitoring tens of metres away in the roof of the drift. The intersection spanned two rock types with different stiffness characteristics. The region was also covered by an extensive seismic system with a mixture of triaxial geophones and both triaxial and uniaxial accelerometers.
Using three weeks of recorded data, the loading on 12 bolts was monitored during the production of several nearby stopes and analysed alongside the recorded seismicity. A significant increase in loading on the bolts in the roof was recorded when production occurred within 40 m of the instrumented intersection despite several other stopes producing more significant seismicity following blasting. The load was also taken up asymmetrically, with more substantial changes in load occurring in the bolts in the greywacke.
During the study period, several large seismic events occurred within 500 m of the study area. Seismic moment tensor analysis was conducted on several of the seismic events to estimate the mechanism of failure and, using seismic stress inversion, the orientation of the observed fractures was estimated and the directions of principal stress.
There was a strong increase in the load on the bolts located in the intersection, across the two different formations, several hours after a large seismic event occurred on that contact several hundred metres away. This work showed a connection between loading on the bolt and large changes in the local stress field due to nearby production and significant seismicity along structures in the region. In addition to monitoring the loading of the rock bolts, the Rock Bolt Sensor can be utilised to better understand the coseismic and post-seismic deformation within the mine and improve models of the local stress field.
1
Introduction
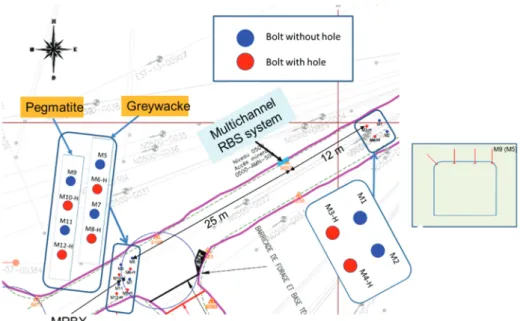
As more and more mines move deeper, managing and designing for seismic hazard is increasingly difficult. Seismic hazard management has many facets. This study focuses on the relationship between load on the support and seismicity. Instrumented rock bolts are one tool for evaluating load on the bolt and understanding how these loads change. With nearby seismicity, the dynamic load on the bolt is difficult to assess (see Potvin & Wesseloo 2013 for a summary of these design challenges). By combining the seismic and Rock Bolt Sensor data, we seek to evaluate load changes on the bolt and increase our understanding of the stress changes in that region and the stress on the excavation as a result of seismicity and production. This study focuses on the sensors monitored with a multichannel RBS system (MHub) on Level 500 (shown in Figure 1) at a hard rock mine at three locations. Measurements were recorded hourly on the MHub in this region. The sensors were installed in bolts across a pegmatite and greywacke contact. Mechanical properties vary in the different units, making stress transfer across the units quite complicated. The contact acts as a stress riser.
Figure 1 Plan of site 500-AMN-500 and layout of instrumented rock bolts showing locations of bolt installations with and without pre-drilled holes
This study is a unique opportunity to study coseismic, post-seismic and interseismic deformation and stress changes. Interseismic deformations are those that occur over long time scales and longer time periods. Coseismic deformations and displacements occur during the seismic event (i.e. rapid changes). Following the seismic event, post-seismic changes occur in displacement and deformation in response to the changing stresses following the large seismic event. In addition to the size and location of the seismic event, we can also estimate the mechanism of failure using seismic moment tensor inversion.
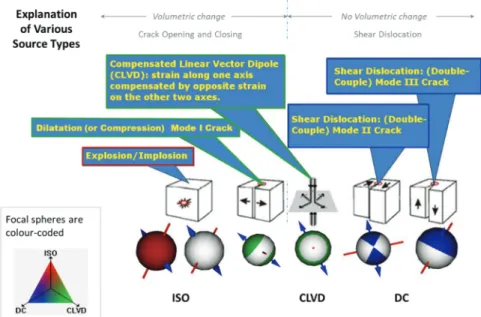
The method provides a model of the mechanics of the rock failure from the seismic radiation pattern. The seismic moment tensor inverts the amplitude of the seismic waves and the direction of their first motion (towards the sensor – positive first motion; away from the sensor – negative first motion) for compressional and horizontally and vertically polarised shear waves to model the mechanics of failure (Trifu et al. 2000). Depending on the environment, different assumptions can be used for the mechanics of failure. For tectonic events, most seismic events are largely the result of shear slip along a planar structure. This is modelled using a double couple (DC) source. In a mining environment, seismic events can also be generated by more complex modes of failure, where the total slip of the seismic event may not be along a fault. To allow for this, a more general form of the seismic moment tensor is used. This general solution includes components of shear slip (DC) as well as compensated-linear-vector-dipole and isotropic volumetric change (ISO). A simplified version of these failure types is shown in Figure 2.
Ground support loading monitored with Rock Bolt Sensor (RBS™) and relationship to nearby production and seismicity
L Smith-Boughner et al. Ground support loading monitored with Rock Bolt Sensor (RBS™)
and relationship to nearby production and seismicity
Figure 2 Types of failure modelled by the general moment tensor
The seismicity and Rock Bolt Sensor recordings are analysed below first, as time series and later incorporating the seismic moment tensor inversions for a sample of the seismic events. The seismic data was recorded using an extensive system of triaxial and uniaxial accelerometers as well as geophones. This system was used to detect and locate seismicity throughout the mine. For the seismic moment tensor inversions, only triaxial geophones were used.
2
Seismicity and production during the analysis period
A comparison was made of the seismic data to the Rock Bolt Sensor data from the installation in the mine. This region has the MHub operating on 12 channels.
To consider the relationship between nearby seismicity and changes in the loading on the bolt, we consider all blasts and events within a 100 m radius of the intersection where the eight-channel RBS system was installed, shown in Figure 3 with the block volume used to limit the data.
During this period, there were 13 production blast sequences near the RBS. The seismic system recorded 633 seismic events and 199 triggers associated with blasting (Figure 3). The time series of this data is shown in Figure 4.
Figure 4 Magnitude and timing of seismic events and blasts during the analysis period
However, only three of those blast sequences relate to significant changes in the loading of the bolt: • 14 January at approximately 18:00, below and to the northeast of the intersection, approximately
50 m away. This was followed by two large seismic events with moment magnitudes above 1.0 (see Kanamori 1983 for more details about the moment magnitude scale).
• 29 January at approximately 06:00, 40 m to the southeast of the intersection and at the same level. • 9 February at approximately 06:00, in the same location as the 29 January blasting.
As mentioned above, only three of the 13 production blast sequences relate to significant changes in the loading of the bolts and, as shown later, are generally within 50 m of the intersection of the drift with the eight-channel RBS equipment installed. These are discussed in more detail in the following section.
3
Rock Bolt Sensor measurements and seismicity
The analysis focused on the correlation with changes in load on the entire length of the bolt. The seismic event location accuracy is greater than the distance between the bolts and the length of the bolt, making any inferences along the points of the bolt more challenging. Load changes of up to six tonnes force (tf) were recorded on the Rock Bolt Sensor during the analysis period, shown in Figure 5 for the eight-channel system and in Figure 6 for the four channel system, away from the intersection. All figures in these images are shown with different y-axis limits on the left hand side to highlight the subtle variations in loading on the bolts and plotted with the seismicity within the monitoring block for reference.
Figure 5 Schematic of load and seismicity for Level 500 MBHub. Vertical axis on the left indicates the load in tonnes force for each installed bolt (each plot shown with different vertical axis limits to highlight timing of changes). Horizontal axis indicates the moment magnitude of the seismic events within 100 m of the bolt.
Ground support loading monitored with Rock Bolt Sensor (RBS™) and relationship to nearby production and seismicity
L Smith-Boughner et al. Ground support loading monitored with Rock Bolt Sensor (RBS™)
and relationship to nearby production and seismicity
Figure 6 Other RBSs on Level 500, with seismicity. Vertical axis on the left indicates the load in tonnes force for each installed bolt (each plot shown with different vertical axis limits to highlight timing of changes). Horizontal axis indicates the moment magnitude of the seismic events within 100 m of the bolt
For the eight-channel system installed across the pegmatite/greywacke contact (shown in Figure 5), the timing of the changes in load is similar for all seven sensors and generally corresponds to periods with blasting within the study volume.
However, the magnitude of the change in load varies, with bolts deployed in the roof showing a larger change in load over the monitoring period. Overall, the east side of the bolt deployment, those in the greywacke, show a larger change in the load over the monitoring period. During the monitoring period, the load increases on most of the bolts but shows a short-term decrease in load on bolt M7, installed on the southeast side of the intersection. This short-term decrease lasts only a few days before increasing again in early February. For the four-channel system installed roughly 37 m to the east (Figure 6) the RBSs recorded a change of at most 3.5 tf. The bolts on the west side showed a much larger change than those on the east, which showed little appreciable change in loading during the monitoring period. The bolts on the west showed changes in loading at similar times to the bolts monitored with the eight-channel system.
4
Spatial relationship between seismicity and the load on the Rock Bolt
Sensors
To better understand why the load recorded on the bolts changed, the relationship between the seismicity and the loading of the eight-channel system is discussed in further detail. In Figure 7, the load on the bolts is shown plotted against the distance from the centre of the monitoring region to the location of the recorded seismic events and blasts.
F ig u re 7 L o a d o n th e b o lt (l e ft y -a x is ) v e rs u s d is ta n ce o f e v e n t in m e tr e s fr o m th e c e n tr e o f th e e ig h t-ch a n n e l sy st e m ( ri g h t y -a x is )
Ground support loading monitored with Rock Bolt Sensor (RBS™) and relationship to nearby production and seismicity
L Smith-Boughner et al. Ground support loading monitored with Rock Bolt Sensor (RBS™)
and relationship to nearby production and seismicity
As mentioned previously, only three of the blast sequences within the monitoring region resulted in substantial changes in load on the rock bolt sensors. These sequences, on 14 January, 29 January and 9 February were all within 40 m of the Rock Bolt Sensor installation. At each of these times, a short-term increase in the loading rate began to occur on most of the bolts.
The largest change in the loading rate that was recorded during the monitoring period occurred on 18 January. Bolts in the centre of the intersection on the east side—the greywacke side of the contact (channel 6 and 7 in the Figure 7)—showed a very rapid increase in load of 1–2 tf with no nearby blasting. From the nearby seismicity and production, it is unclear what caused such a sudden change in the load on the bolts installed in the greywacke side of the contact.
To better understand this, we consider the seismicity throughout the mine which occurred between 18 and 21 January.
5
Large seismic events throughout the mine: 18–21 January
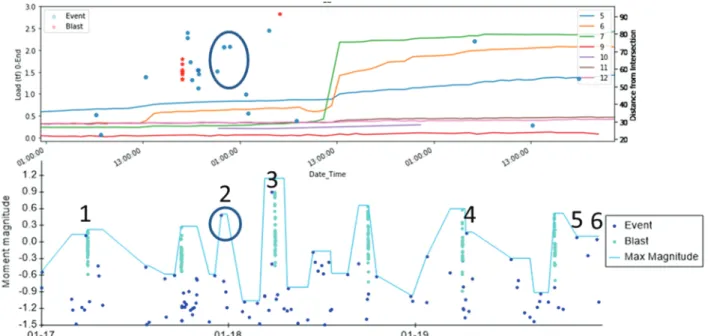
To better understand why the load recorded by bolts installed in the greywacke increased around 18 January, we examine the larger seismic events which occurred during this time and found a sequence of seismic events with Mw > 0 which occurred along the pegmatite/greywacke boundary. The location and timing of these events is shown in Figure 8, with the approximate locations of the RBS installation shown with red circles.
Figure 8 Large seismic events between 17–21 January. (a) Time series; (b) Plan view of seismic events; (c) Looking along greywacke pegmatite boundary (red circles show approximate location of RBS installations)
The sequence of seismic events along the contact began on 17 January. The second event in the sequence occurred on the pegmatite side of the contact adjacent to the RBS installation. An increase in the load on the RBSs installed in the greywacke side of the intersection began on 18 January 2019 (channel 6, shown as the orange line in Figure 9). The largest seismic event of the sequence, event #3, occurred in the morning of 18 January and was later followed by three smaller seismic events; two of which occurred approximately 100 m to the northeast of the RBS installation, at a similar elevation to the RBS installation. Several hours later, there was a sharp change in load on the RBSs in the middle of the drift (channels 6 (orange) and 7 (green) in Figure 9), both in the greywacke. This sharp change does not coincide with any seismicity within a 200 m cubic volume near the Rock Bolt Sensor installation (shown in Figure 3).
Figure 9 Top: Seismicity within 100 m of the monitoring region plotted against the load on the bolts; Bottom: Mine-wide seismicity during this time period. The numerals indicate the events referenced in Figure 8
The change in loading does not appear to directly correlate with large magnitude seismic events. However, along the greywacke and pegmatite, there were two larger seismic events which may have initiated stress redistributions along the greywacke/pegmatite contact. Further investigation is needed to identify why there was such a sudden change in loading here.
6
Selection of seismic moment tensors
To analyse the relationship between the seismicity and the load on the rock bolts throughout the study period, we focus on a high quality dataset of 18 seismic events for further analysis using seismic moment tensor inversion. The events chosen had lower location uncertainty and higher signal-to-noise ratios than other events. For this selected dataset, there is a concentration of seismicity near the location of the multichannel RBS system. Most seismicity and mine activities are on the east side of the greywacke/pegmatite contact. While some of these seismic events are related to production activities while others, close to the RBS installation, may be related to other stress changes.
Seismic moment tensor inversion was produced for each of these events, with the results shown on the left of Figure 10. In this image, the P-wave radiation patterns modelled for each of the selected events is shown as a ‘beach ball’—the white regions indicate motion outwards at the source, and the blue regions indicate motion inward at the source.
Ground support loading monitored with Rock Bolt Sensor (RBS™) and relationship to nearby production and seismicity
L Smith-Boughner et al. Ground support loading monitored with Rock Bolt Sensor (RBS™)
and relationship to nearby production and seismicity
Figure 10 Left: Selection of seismic moment tensors, with direction of compressional (tensional) strain shown with red (blue) arrows. Right: Coloured by the time of the event, location of the RBS installation shown with red circles
The moment tensor results also confirm that most of the seismicity is generated by the closure of shear/tensile cracks (Figure 11), a common mechanism of failure for seismicity subsequent to blasting, as the rock weakens from the blasting. For each seismic moment tensor, there are two potential orientations for the failure surface; both of these are shown in Figure 11, scaled by the estimated source radius for the seismic event. The largest of these events has a potential failure plane which matches the strike and dip of the pegmatite/greywacke contact.
(a) (b)
Figure 11 Showing both potential fracture planes and principal compression (red) and tension (blue) axis for the seismic moment tensors, numbed by time of occurrence. (a) Plan view; (b) Looking along contact
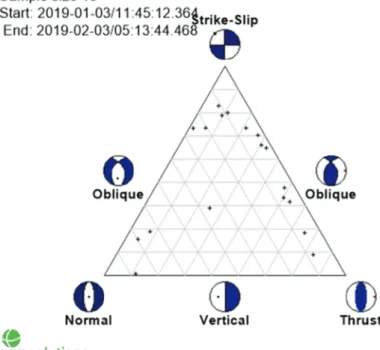
From the directions of the principal compressional and tensional axes (Figure 12), there is strike/slip faulting occurring along the greywacke/pegmatite contact for these moderate-to-small magnitude events ( -1.0 to 0.6 Mw for the seismic moment tensor inversion events). These results suggest that some of the selected seismicity near the greywacke/pegmatite contact, north of the RBS installation, could be related to stress redistributions along the contact.
Figure 12 Faulting-type diagram for the 18 seismic events shown in Figure 10
7
Discussion and conclusion
The study showed a strong correlation to blasting within 50 m of the RBSs and large changes in load on the rock bolts. Some of the large changes in load on the bolt were not correlated with either production blasting or the occurrence of seismic events within 100 m of the analysis region. A wider search radius was used when investigating the large displacement on the 18th of July and no correlation was found.
Seismic moment tensor analysis was used to help capture the overall failure mechanism of the seismicity and indicated that there was movement along the pegmatite/greywacke contact.
One example of this occurred on 18 January. There were some larger seismic events to the northeast, 350 m away from the intersection that occurred near the contact at this time, with subsequent seismicity along the contact but closer to the RBS system.
Limited information about the production during this time was incorporated into this study. More precise details about the locations of production and tonnage produced during this time period could assist in the interpretation of the relative changes on the instrumented bolts and how the stress load is taken up by the rock bolts in the roof of the excavation.
In future studies, more rapid sampling of the RBS data (this study used a one-hour sampling rate) and a longer study duration could allow for more detailed investigations of the time relationship between distant seismicity and post-seismic stress changes that could impact the ground support. This could provide additional insight into the relationship between coseismic and post-seismic stress changes in the mine and assist in understanding seismic hazard and risk.
The study has shown the great potential for the Rock Bolt Sensor and its integrated use with seismic and production data in the design and assessment of ground support and the management of stress within the mine.
Ground support loading monitored with Rock Bolt Sensor (RBS™) and relationship to nearby production and seismicity
L Smith-Boughner et al. Ground support loading monitored with Rock Bolt Sensor (RBS™)
and relationship to nearby production and seismicity
Acknowledgement
Technical supports by David Rocheleau, Antoine Hamel, Daniel Gagnon, Francis Boismenu, Tony Vaillancourt, Caroline Hoang and Gaétan Veilleux at the National Research Council of Canada and Daniel Côté at CanmetMINING are greatly appreciated.
References
Kanamori, H 1983, ‘Magnitude scale and quantification of earthquakes’, Tectonophysics, vol. 93, iss. 3–4, pp. 185–199.
Potvin, Y & Wesseloo, J 2013, ‘Towards an understanding of dynamic demand on ground support’, in Y Potvin & B Brady (eds), Proceedings of the Seventh International Symposium on Ground Support in Mining and Underground Construction, Australian Centre for Geomechanics, Perth, pp. 287–304, https://doi.org/10.36487/ACG_rep/1304_18_Potvin
Trifu, C-I, Angus, D & Shumila, V 2000, ‘A fast evaluation of the seismic moment tensor for induced seismicity’, Bulletin of the Seismological Society of America, vol. 90, iss. 6, pp. 1521–1527.
Ground support loading monitored with Rock Bolt Sensor (RBS™) and relationship to nearby production and seismicity
L Smith-Boughner et al. Ground support loading monitored with Rock Bolt Sensor (RBS™)
and relationship to nearby production and seismicity