HAL Id: hal-01586849
https://hal.archives-ouvertes.fr/hal-01586849
Submitted on 27 Oct 2020
HAL is a multi-disciplinary open access
archive for the deposit and dissemination of
sci-entific research documents, whether they are
pub-lished or not. The documents may come from
teaching and research institutions in France or
abroad, or from public or private research centers.
L’archive ouverte pluridisciplinaire HAL, est
destinée au dépôt et à la diffusion de documents
scientifiques de niveau recherche, publiés ou non,
émanant des établissements d’enseignement et de
recherche français ou étrangers, des laboratoires
publics ou privés.
(2-butanone) in tropical, boreal, temperate and marine
environments
M. Yáñez-Serrano, A. C. Nölscher, E. Bourtsoukidis, B. Derstroff, N. Zannoni,
V. Gros, M. Lanza, J. Brito, S. M. Noe, E. House, et al.
To cite this version:
M. Yáñez-Serrano, A. C. Nölscher, E. Bourtsoukidis, B. Derstroff, N. Zannoni, et al.. Atmospheric
mixing ratios of methyl ethyl ketone (2-butanone) in tropical, boreal, temperate and marine
environments. Atmospheric Chemistry and Physics, European Geosciences Union, 2016, 16 (17), pp.10965
-10984. �10.5194/acp-16-10965-2016�. �hal-01586849�
© Author(s) 2016. CC Attribution 3.0 License.
Atmospheric mixing ratios of methyl ethyl ketone (2-butanone) in
tropical, boreal, temperate and marine environments
A. M. Yáñez-Serrano1,2,a, A. C. Nölscher1,b, E. Bourtsoukidis1, B. Derstroff1, N. Zannoni3, V. Gros3, M. Lanza4, J. Brito5, S. M. Noe6, E. House7, C. N. Hewitt7, B. Langford8, E. Nemitz8, T. Behrendt1,c, J. Williams1, P. Artaxo5, M. O. Andreae1,9, and J. Kesselmeier1
1Biogeochemistry and Air Chemistry Departments, Max Planck Institute for Chemistry, P.O. Box 3060,
55020 Mainz, Germany
2Instituto Nacional de Pesquisas da Amazônia (INPA), Av. André Araújo 2936, Manaus-AM, 69083-000, Brazil 3Laboratoire des Sciences du Climat et de l’Environnement, LSCE/IPSL, CEA-CNRS-UVSQ, Université Paris-Saclay,
91191 Gif-sur-Yvette, France
4IONICON Analytik GmbH, Eduard-Bodem-Gasse 3, 6020, Innsbruck, Austria
5Instituto de Física, Universidade de São Paulo (USP), Rua do Matão, Travessa R, 187, CEP 05508-900, São Paulo-SP, Brazil 6Institute of Agricultural and Environmental Sciences, Estonian University of Life Sciences, Kreutzwaldi 1,
51014 Tartu, Estonia
7Lancaster Environment Centre, Lancaster University, Lancaster, LA1 4YQ, UK 8Centre for Ecology & Hydrology, Penicuik, EH26 0QB, UK
9Scripps Institution of Oceanography, University of California San Diego, La Jolla, CA 92037, USA anow at: Department of Ecosystem Physiology, University of Freiburg, 79085 Freiburg, Germany
bnow at: Division of Geological and Planetary Sciences, California Institute of Technology, Pasadena, CA 91125, USA cnow at: Department of Biogeochemical Processes, Max Planck Institute for Biogeochemistry, Hans-Knöll-Str. 10,
07745 Jena, Germany
Correspondence to:A. M. Yáñez-Serrano (a.yanezserrano@mpic.de)
Received: 12 April 2016 – Published in Atmos. Chem. Phys. Discuss.: 25 April 2016 Revised: 10 August 2016 – Accepted: 17 August 2016 – Published: 6 September 2016
Abstract. Methyl ethyl ketone (MEK) enters the atmosphere following direct emission from vegetation and anthropogenic activities, as well as being produced by the gas-phase ox-idation of volatile organic compounds (VOCs) such as n-butane. This study presents the first overview of ambient MEK measurements at six different locations, characteris-tic of forested, urban and marine environments. In order to understand better the occurrence and behaviour of MEK in the atmosphere, we analyse diel cycles of MEK mixing ra-tios, vertical profiles, ecosystem flux data, and HYSPLIT back trajectories, and compare with co-measured VOCs. MEK measurements were primarily conducted with proton-transfer-reaction mass spectrometer (PTR-MS) instruments. Results from the sites under biogenic influence demonstrate that vegetation is an important source of MEK. The diel cy-cle of MEK follows that of ambient temperature and the
forest structure plays an important role in air mixing. At such sites, a high correlation of MEK with acetone was ob-served (e.g. r2=0.96 for the SMEAR Estonia site in a re-mote hemiboreal forest in Tartumaa, Estonia, and r2=0.89 at the ATTO pristine tropical rainforest site in central Ama-zonia). Under polluted conditions, we observed strongly en-hanced MEK mixing ratios. Overall, the MEK mixing ra-tios and flux data presented here indicate that both biogenic and anthropogenic sources contribute to its occurrence in the global atmosphere.
1 Introduction
Methyl ethyl ketone (C4H8O; MEK, also known as
2-butanone, 2-butanone, methyl acetone, butan-2-one, methyl-propanone and ethyl methyl ketone) is an oxygenated volatile organic compound (OVOC). Its occurrence in the atmosphere has been reported over a wide range of environments (Ceci-nato et al., 2002; Hellén et al., 2004; Ho et al., 2002; Kim et al., 2015; McKinney et al., 2011; Singh et al., 2004) with typical mixing ratios of 0.03–4 ppb (Ciccioli and Mannozzi, 2007; Kim et al., 2015). Although often being measured alongside other volatile organic compounds (VOCs), atmo-spheric MEK has received little attention to date. The pho-tochemistry of acetone may serve as an example of how ke-tones affect the composition and chemistry of the atmosphere by delivering free radicals to the upper troposphere (Colomb et al., 2006; Finlayson-Pitts and Pitts, 2000; McKeen et al., 1997) and thus increasing the ozone formation potential and altering the oxides of nitrogen (NOx)regime (Ciccioli and
Mannozzi, 2007; Folkins et al., 1998; Prather and Jacob, 1997). This understanding may be transferred to MEK, as this molecule is structurally similar to acetone, with a com-parable absorption spectrum (Martinez et al., 1992). Several studies report that the mixing ratio of MEK in the free tro-posphere is roughly one-quarter of that of acetone (Moore et al., 2012; Singh et al., 2004). However, MEK is about an or-der of magnitude more reactive than acetone with respect to the hydroxyl radical (OH) (Atkinson, 2000), which makes it a compound of interest in ongoing discussions about the in-ability to fully account for the reactivity of OH (Nölscher et al., 2016).
There are several known but poorly characterised sources of MEK to the atmosphere. Terrestrial vegetation (Bracho-Nunez et al., 2013; Brilli et al., 2014; Davison et al., 2008; De Gouw et al., 1999; Isidorov et al., 1985; Jardine et al., 2010; Kirstine et al., 1998; König et al., 1995; McKinney et al., 2011; Ruuskanen et al., 2011; Song and Ryu, 2013; Steeghs et al., 2004; Wilkins, 1996; Yáñez-Serrano et al., 2015), fungi (Wheatley et al., 1997) and bacteria (Song and Ryu, 2013; Wilkins, 1996) are known to emit MEK. It is also emitted directly by several anthropogenic sources, including anthropogenic biomass burning (Andreae and Merlet, 2001), solvent evaporation (Kim et al., 2015; Legreid et al., 2007) and vehicle exhaust (Bon et al., 2011; Brito et al., 2015; Liu et al., 2015; Verschueren, 1983). In addition, MEK can be formed via the atmospheric oxidation of other compounds (de Gouw et al., 2003; Jenkin et al., 1997; Neier and Strehlke, 2002; Sommariva et al., 2011).
Looking in more detail at biogenic sources, MEK emis-sions have been observed from different types of vegetation, including forest canopies (Brilli et al., 2014; Jordan et al., 2009b; Yáñez-Serrano et al., 2015), pasture (Davison et al., 2008; De Gouw et al., 1999; Kirstine et al., 1998) and clover (De Gouw et al., 1999; Kirstine et al., 1998). The MEK pro-duction and release mechanisms are manifold but poorly
un-derstood. Studies show higher MEK emissions after cutting and drying of leaves than under no-stress conditions (Davi-son et al., 2008; De Gouw et al., 1999). Due to the water solubility of MEK in leaves and on surfaces (Sander, 2015), Jardine et al. (2010) suggested MEK emissions to be depen-dent on evaporation from storage pools in leaves. It has been suggested that MEK takes part in tri-trophic signalling fol-lowing herbivore attack (Jardine et al., 2010; Song and Ryu, 2013). The roots of plants have also been found to release MEK in root–aphid interactions (Steeghs et al., 2004). De-caying plant tissue may also act as a source of MEK to the atmosphere (Warneke et al., 1999). Furthermore, some studies indicate the importance of MEK emissions by mi-crobes, such as Brevibacterium linens, Bacillus spp. and ther-mophilic Gram-positive actinomycetes bacteria (Song and Ryu, 2013; Wilkins, 1996), and fungi such as Trichoderma spp. (Wheatley et al., 1997).
MEK not only enters the atmosphere via direct emis-sions but also results from the atmospheric photooxidation of VOCs such as n-butane, 2-butanol, 3-methyl pentane and 2-methyl-1-butene (de Gouw et al., 2003; Jenkin et al., 1997; Neier and Strehlke, 2002; Sommariva et al., 2011). Although butane in the atmosphere comes predominantly from an-thropogenic sources (Kesselmeier and Staudt, 1999), some studies have reported emission of n-butane from vegetation (Donoso et al., 1996; Greenberg and Zimmerman, 1984; Hel-lén et al., 2006; König et al., 1995; Zimmerman et al., 1988). The MEK yield from n-butane oxidation is ∼ 80 % (Singh et al., 2004). It is important to note that no mechanistic pathways have been found for atmospheric MEK production from the dominant biogenic VOCs isoprene, α-pinene and β-pinene, as well as from methyl butenol oxidation (Rollins et al., 2009; Singh et al., 2004).
In the atmosphere MEK reacts mainly with OH (kOH=
1.15 × 10⁻¹²cm3s−1) (Chew and Atkinson, 1996), while reactions with O3 and NO3 are very slow during the day
and hence negligible (Atkinson and Arey, 2003). MEK has a lifetime of 5.4 days at an OH concentration of 1.6 × 10⁶radicals cm−3, whereas isoprene and acetone have life-times of 8.2 h and 38 days, respectively, under the same con-ditions (Grant et al., 2008). The atmospheric degradation of MEK leads to acetaldehyde and formaldehyde formation. In the presence of NOx, MEK can lead to peroxyacetyl nitrate
(PAN) and ozone formation (Grosjean et al., 2002; Pinho et al., 2005). In the upper troposphere, MEK photolyses and re-generates OH (Atkinson, 2000; Baeza Romero et al., 2005; De Gouw et al., 1999), as does acetone, potentially increas-ing ozone formation.
Anthropogenic biomass burning leads to significant MEK emissions of about 2 Tg a−1 globally (Andreae and Merlet, 2001, and unpublished updates; Schauer et al., 2001). Fur-thermore, about 9 Tg a−1 of other C4 compounds is
emit-ted by biomass burning, which may act as MEK precur-sors. Another strong source of MEK is biofuel and char-coal combustion, with emissions of ∼ 830 mg kg−1 of dry
biomass (compared to an emission rate of ∼ 260 mg kg of dry mass for biomass burning of savannah and grassland veg-etation types; Andreae and Merlet, 2001). Despite the fact that biomass burning emission rates have been fairly well characterised, vehicular emissions, food cooking, industrial activities, cigarette smoke and other anthropogenic sources have not been characterised. Even though MEK is present in urban atmospheres, there are no observations of MEK emis-sions from vehicles. Most of the urban MEK is released to the atmosphere via evaporation from chemical plants and in-dustrial and household applications, as it is widely used as a solvent (e.g. in glues and as a paint thinner). It has a low toxi-city and is not carcinogenic (National Center for Biotechnol-ogy, 2015). As its manufacturing has been increasing in the last 10 years, global atmospheric mixing ratios have probably increased as well.
Here we report recent findings on MEK from six different sites, including biogenic- and anthropogenic-dominated en-vironments, in order to understand MEK sources in different environments. Our large dataset allows a closer view of this important, almost ubiquitous species in Earth’s atmosphere.
2 Sites and methodology
The field sites compared in our study cover areas from pris-tine to remote anthropogenically influenced tropical forests, as well as boreal and Mediterranean regions. Measure-ments were performed using proton-transfer-reaction mass spectrometry (PTR-MS) and partly complemented by gas chromatography–flame ionisation detection (GC-FID) and gas chromatography–mass spectrometry (GC-MS) analytical techniques (Fig. 1, Table 1).
Online MEK measurements were performed with quadrupole PTR-MSs (Ionicon Analytic GmbH, Austria; Lindinger et al., 1998) at all sites except for CYPHEX, where a proton transfer reaction time-of-flight mass spec-trometer (PTR-ToF-MS, Ionicon Analytic GmbH, Austria; Jordan et al., 2009a) was used. The PTR-MSs were operated at standard conditions (2.2 mbar drift pressure, 600 V drift voltage, 142 Td for ATTO and SMEAR Estonia; 2.0 mbar drift pressure, 550 V drift voltage, 129 Td, for TT34; 2.2 mbar drift pressure, 600 V drift voltage, 135 Td for O3HP; 2.2 mbar drift pressure, 560 V drift voltage, 132 Td
for T2; and 2.2 mbar drift pressure, 600 V drift voltage, 137 Td for CYPHEX).
Periodic background measurements and weekly humid calibrations were performed at all sites. Gravimetrically pre-pared multicomponent standards were obtained from Apel & Riemer, USA, for ATTO, TT34, T2 and CYPHEX and from Ionicon Analytik GmbH, Austria, for O3HP and SMEAR
Es-tonia.
pristine tropical rainforest (Amazon, Brazil)
The Amazon Tall Tower Observatory (ATTO) site is lo-cated in central Amazonia, 150 km NE of Manaus, Brazil (Fig. 1), within a pristine primary tropical rainforest. The site is equipped with a tall tower (325 m) and two 80 m tow-ers. One of them (02◦08038.800S, 58◦59059.500W) is an 80 m walk-up tower, where the trace gas measurements take place. It is surrounded by a forest with a canopy height of ap-proximately 35 m and with at least 417 different tree species among 7293 screened trees of ≥ 10 cm diameter at breast height (DBH) in the twelve 1 ha inventoried plots (Andreae et al., 2015). The climate of this site is typical for tropical rainforests with a drier season (July–October) and a wet sea-son (December–April; Nobre et al., 2009).
Measurements for this study took place 18 February– 15 March 2014. They were carried out at seven different heights (0.05, 0.5, 4, 24, 53 and 79 m) with the PTR-MS switching sequentially between each height in 2 min inter-vals. The inlet lines were made of PTFE (9.5 mm OD), in-sulated and heated to 50◦C, and had PTFE particle inlet
fil-ters. More information about the gradient system and PTR-MS operation at ATTO can be found elsewhere (Nölscher et al., 2016; Yáñez-Serrano et al., 2015). The limit of detection (LOD) and uncertainty in the PTR-MS were 0.05 ppb and 34 %, respectively.
Additionally, ambient samples for offline measurements with GC-FID were taken on 11 March 2014 from 08:30 to 11:00 LT. They were collected at 24 m using a GSA SG-10-2 personal sampler pump and adsorber tubes (130 mg of Carbograph 1 (90 m2g−1) followed by 130 mg of Car-bograph 5 (560 m2g−1)). The size of the Carbograph par-ticles was in the range of 20–40 mesh. Carbograph 1 and 5 were provided by Lara s.r.l. (Rome, Italy). Samples were collected for 20 min with a flow of 167 mL min−1 passing about 3.3 L of ambient air through the adsorbent. Cartridges were transported to the laboratory for analysis by a Perkin Elmer Autosystem XL GC-FID. These samples generally matched the results of the PTR-MS. For details on sampling see Kesselmeier et al. (2002).
2.2 TT34: remote tropical rainforest (Amazon, Brazil)
The ZF2 site is located in the Reserva Biologica do Cuieiras in central Amazonia, 60 km NNW of Manaus (2◦35039.400S,
60◦12033.400W) within a remote primary tropical rainforest
(Fig. 1). The site is equipped with two towers, TT34 and the K34. The TT34 triangular tower is 40 m high and embedded within the forest with a canopy height of approximately 30 m. The biodiversity of this site is also high and the climate is very similar to that at the ATTO site. More information about the site can be found elsewhere (Karl et al., 2009; Martin et al., 2010).
Table 1. Measurement sites, site environment, sampling dates, methods used and sampling heights.
Site Characteristics Canopy height Time of sampling Technique Type of
measurement Measurement heights ATTO (Brazil) Pristine tropical rainforest
35 m dense veg. Feb/Mar 2014 PTR-MS
GC-FID (samples for of-fline analysis, collected volume = 3.34 L) Ambient 0.05, 0.5, 4, 24, 38, 53, 79 m 24 m TT34 (Brazil) Remote tropical rainforest
30 m dense veg. Sep 2013–Jul 2014 PTR-MS Ambient,
including canopy-scale fluxes 41 m SMEAR (Estonia) Remote hemibo-real forest 16–20 m dense veg.
Jun, Jul, Oct 2012 Oct 2012
GC-MS (samples for of-fline analysis, collected volume = 6 L) PTR-MS Ambient, plant, soil enclosure Ambient, plant enclosure 2, 20 m 16 m O3HP (France) Rural temperate forest
5 m sparse veg. May–Jun 2014 PTR-MS Ambient 2 m
T2 (Brazil) Mixed urban-and rainforest-influenced envi-ronment Influence from veg. nearby Feb–Apr 2014 Jul–Oct 2014 PTR-MS Ambient 14 m CYPHEX (Cyprus) Mixed marine, rural environment influenced by aged air masses
None, on top of a hill
Jul–Aug 2014 PTR-TOF-MS Ambient 8 m
Measurements for this study were made from 1 Septem-ber 2013 to 20 July 2014 at 41 m, at a fast rate (0.5 Hz) for virtual disjunct eddy covariance (vDEC) flux derivations techniques (Karl et al., 2002; Langford et al., 2009; Rinne et al., 2002). The high-resolution data were further aver-aged to give 30 min concentration and flux data. Wind vector data were obtained with a sonic anemometer (Gill R3, USA) mounted at the top of the tower close to the PTR-MS in-let. The PTR-MS inlet line was made of PFA (12.7 mm OD) (PFA-T8-062-100, Swagelok) and was insulated and heated to 40◦C inside the air-conditioned cabin. The LOD and uncertainty averaged 30 min concentrations measurements were 0.18 ppb and 6 %, respectively.
2.3 Station for Measuring Ecosystem-Atmosphere Relations, SMEAR Estonia: remote hemiboreal forest (Tartumaa, Estonia)
The Station for Measuring Ecosystem-Atmosphere Relations (SMEAR Estonia) site is located in the Järvselja Experi-mental Forestry station in Tartumaa, SE Estonia (58◦160N 27◦160E), within a remote hemiboreal zone, far from major anthropogenic disturbances (Noe et al., 2011; Fig. 1). The site is equipped with a tower of 24 m height. The surround-ing canopy is about 16–20 m in height and the remote hemi-boreal forest consists of a mixture of tree species, with Nor-way spruce (Picea abies) dominating. The climate is boreal
with a growing season of 170–180 days. More information about the site can be found elsewhere (e.g. Bourtsoukidis et al., 2014a; Noe et al., 2011, 2016).
The measurements were made between 3 and 17 Octo-ber 2012. Sampling was done using a dynamic, automated glass enclosure with measurement cycles of 36 s. The inlet line (9.5 mm OD) was made of glass and was insulated and heated to 70◦C. A dynamic exchange enclosure was used to
measure emission rates from a Norway spruce branch located in the upper canopy at 16 m. While the focus of this study was the quantification of emission rates of MEK from a Norway spruce tree, ambient mixing ratios were derived as well us-ing the box model described in Bourtsoukidis et al. (2014b). The LOD and uncertainty of the PTR-MS were 0.04 ppb and 28 %, respectively.
Furthermore, at SMEAR Estonia, offline measurements with a GC-MS were carried out for periods of 3 days each in June and July 2012, with samples taken every 4 h at two heights (2 and 20 m). Samples for GC-MS analysis were also taken from cuvettes enclosing some common plant species at the site (Table 1). In addition, VOC emissions from soil litter were monitored monthly. The air samples were drawn into multi-bed stainless steel cartridges (10.5 cm length, 3 mm in-ner diameter, Supelco, Bellefonte, PA, USA) filled with Car-botrap C 20/40 mesh (0.2 g), Carbopack C 40/60 mesh (0.1 g) and Carbotrap X 20–40 mesh (0.1 g) adsorbents (Supelco). Even though the site usually experiences low ozone
mix-TT34 ATTO T2 O3HP SMEAR CYPHEX
Red: primary anthropogenically affected
Green: primary biogenically affected
Figure 1. World map showing the location of the different sites. The names are colour-coded to show whether they have primarily biogenic influence (green) or a primarily anthropogenic influence (red). Source: outline world map, http://www.outline-world-map.com/ political-white-world-map-b6a, last access: 1 September 2016.
ing ratios of 10–30 ppb (Noe et al., 2012), a catalytic Cu(II) ozone scrubbing system (Sun et al., 2012) was applied. Three constant-flow air sample pumps (1003-SKC, SKC Inc., Hus-ton, TX, USA) and one multisample constant-flow air sample pump (224-PCXR8, SKC Inc., Huston, TX, USA) allowed four samples to be collected at the same time. Each sample took 30 min with a flow of 200 mL min−1concentrating 6 L of ambient air onto the adsorbent. More information can be found elsewhere (Noe et al., 2012).
2.4 Observatoire de Haute Provence, O3HP: rural
Mediterranean temperate forest (Provence, France)
The oak observatory (O3HP, https://o3hp.obs-hp.fr) at
the “Observatoire de Haute Provence” (OHP, http://www. obs-hp.fr/welcome.shtml) is located within a rural Mediter-ranean temperate forest in the French MediterMediter-ranean re-gion, 60 km north of Marseille, the closest large city (43◦55054.000N, 5◦42043.900E; Fig. 1). A 10 m mast was set up inside the oak forest with a canopy height of ap-proximately 5 m. The O3HP site is dominated by Quercus
pubescensWilld. (75 % of trees) and Acer monspessulanum L. (25 %) forming a sparse canopy, while Cotinus coggy-griaScop. and other grass species constitute the understorey canopy. The climate at the site is typical Mediterranean, with dry and hot summers and humid and cool winters. More in-formation about the site can be found elsewhere (Genard-Zielinski et al., 2015; Kalogridis et al., 2014).
The measurements took place during 29 May– 12 June 2014 as part of the CANOPÉE project (Biosphere-atmosphere exchange of organic compounds: impact of intra-canopy processes). Ambient measurements were carried out at 2 m (inside the canopy) on consecutive days in intervals of 5 min. The 9.5 mm OD Teflon inlet lines were
insulated and heated above ambient temperature and had no particle filter. The LOD and uncertainty of the PTR-MS were 0.11 ppb and 20 %, respectively. In addition, light non-methane hydrocarbons (from ethane to hexane) were measured with a GC-FID (Chromatotec, Saint-Antoine, France) in line with the PTR-MS as described in Zannoni et al. (2016).
2.5 T2: mixed urban- and rainforest-influenced environment (Amazon, Brazil)
The T2 site is part of a set of experimental sites within the GoAmazon project to study the effect of the pollution plume from the city of Manaus on the otherwise pristine Amazonian atmosphere. The T2 site is located 8 km downwind, i.e. to the west, of Manaus (3◦8021.1200S, 60◦7053.5200W; Fig. 1). Given its location, near Manaus and across the Rio Negro, air mass transport to the sampling site is strongly modulated by a river breeze, alternating between mostly biogenic conditions, resulting from the surrounding forest, and the city emissions. The climate is tropical and similar to that at the ATTO and ZF2 sites.
The measurements for this study took place between 15 February and 15 November 2014. They were carried out at 12 m above the laboratory container with 30 min cycles. The inlet line was made of insulated Teflon (9.5 mm OD) with-out a PTFE particle filter. The LOD and uncertainty of the PTR-MS were 0.02 ppb and ∼ 30 %, respectively.
30 25 20 15 10 Temperature ºC 00:00 18:00 Local time 2000 1500 1000 500 0 PAR µmol m -2 s -1 00:00 18:00 dat 0.4 0.3 0.2 0.1 0.0 MEK ppb 00:00 18:00 dat
ATTO SMEAR Estonia O3HP
Figure 2. Hourly average diel cycles of MEK at the ATTO (left), SMEAR Estonia (middle) and O3HP (right) sites, for the period of
measurements (wet season 2014 for ATTO at 38 m October 2014 for SMEAR Estonia at 16 m, and May and June 2014 for O3HP at 2 m). Hourly mean diel cycles of temperature and PAR are also shown in red and grey, respectively. Error bars represent the standard deviations.
2.6 CYPHEX: mixed marine, rural environment influenced by aged air masses (Cyprus)
The Cyprus Photochemistry Experiment (CYPHEX) cam-paign took place at a site located in the NW inshore part of Cyprus, in the Paphos region (34◦57050.000N, 32◦22037.000E) (Fig. 1). The site experiences mixed marine and rural emis-sions influence. The climate is Mediterranean, warm and dry, and shrubs and small trees dominate the sparse vegetation.
The measurements took place during July and Au-gust 2014 without a single rain event. Instruments were in-stalled inside containers and connected to a stack inlet that reached up 5 m above the container roofs. Air was drawn through the 8 m stack inlet of 0.5 m with high flow rate (10 L min−1)to minimise wall losses. The subsampling in-let line was made of Teflon (13 mm OD), was insulated and heated to 35◦C, and had a PTFE inlet particle filter. The LOD and uncertainty of the PTR-MS were 0.02 ppb and 11 %, re-spectively.
3 Results
3.1 Sites dominated by biogenic emissions
All the pristine or remote sites studied were characterised by relatively low mixing ratios of nitrogen oxides (NOx)
(< 3 ppb of nitrogen dioxide (NO2) for O3HP (Kalogridis
et al., 2014; Zannoni et al., 2016), 0.2–0.8 ppb of NOx for
SMEAR Estonia, and < 1 ppb NOxfor the Amazon
rainfor-est (Kuhn et al., 2010)). The diel cycles of MEK at these sites followed a comparable pattern (Fig. 2), where MEK mixing ratios were highest in the middle of the day, fol-lowing the maxima of light and air temperature. The dom-inant source at these sites was considered to be biogenic. Mixing ratios of MEK correlated well with ambient tem-perature (r2=0.57 (ATTO), r2=0.83 (SMEAR), r2=0.47 (O3HP)), while it was less well correlated with
photosynthet-ically active radiation (PAR) (r2=0.23 (ATTO), r2=0.26
(SMEAR), r2=0.67 (O3HP)). This suggests that ambient
temperature predominantly influenced MEK emission rates from plants.
The vertical observations at ATTO revealed a strong diel variability in the magnitude and vertical distribution of MEK mixing ratios throughout the forest canopy and in the atmo-sphere above. Figure 3 shows an example of an hourly verti-cal profile of MEK for 1 day (7 March 2014) from 13:00 to 15:00 LT, from the ground to the atmosphere, suggesting that the canopy top is the major source of MEK at the site on such days. Similar concentration gradients were found for 83 % (for the afternoon hours) and 45 % (for the morning hours) of all days of measurements. In addition, MEK mixing ratios decreased significantly beneath the canopy towards the for-est floor, possibly due to dry deposition or generally smaller vegetation emissions due to less light and temperature. How-ever, a possible production from the ozonolysis of alkanes or bidirectional plant exchange cannot be ruled out. For a seasonal comparison, Yáñez-Serrano et al. (2015) reported 0.43 ppb of MEK for the dry season (September 2013) and 0.13 ppb of MEK for the wet season (February–March 2013) at 38 m. Curiously, at 24 m, MEK mixing ratios for the wet season were 0.38 ppb, very close to the measured values for this study. Possible differences in canopy structure temper-ature and solar radiation among years may be the cause for this discrepancy.
At the TT34 rainforest site, ecosystem-scale fluxes were directly calculated from the PTR-MS measurements using the method of virtual disjunct eddy covariance (vDEC) (Karl et al., 2001; Fig. 4). The fluxes averaged over the entire 11-month measurement period (covering parts of both the dry and the wet season) clearly demonstrate an emission of MEK by the rainforest during daytime with the highest emissions around noon, and no emissions during nighttime. In terms of seasonal variation, MEK mixing ratios were observed to be higher during the dry season (September–October 2013, ∼0.6 ppb) and lower during the wet season (January–April, ∼0.2 ppb) (data not shown).
60 40 20 0 Height m 0.50 0.25 0.00 MEK ppb ATTO 7 March 2014 PTR-MS 13:00 PTR-MS 14:00 PTR-MS 15:00
Figure 3. Hourly average vertical profiles of MEK mixing ratios at ATTO for 7 March 2014 for 13:00 LT (dashed lines), 14:00 LT (dotted and dashed lines) and 15:00 LT (thick lines). Error bars of vertical profiles are the standard deviations.
Online ambient mixing ratios of MEK, as measured by the PTR-MS in the hemiboreal forest at the SMEAR Estonia site during autumn 2012, were on average 0.15 ± 0.04 ppb (range 0.09–0.25 ppb). These mixing ratios are almost a factor of 2 lower than ATTO and O3HP during daytime hours. This
dif-ference among boreal forests, with growing season ending in October, broadleaved tropical (ATTO) and temperate (O3HP)
forests could be partly related to the temperature dependence of MEK emissions apparently common among all biogenic sites.
The rural Mediterranean temperate forest site at O3HP
dif-fers significantly from the tropical rainforest (ATTO, TT34) or the hemiboreal forest (SMEAR Estonia, Fig. 1). The trees at O3HP are predominantly Quercus pubescens, a high
iso-prene emitter (Keenan et al., 2009). At this site, the exchange of air through the forest canopy is enhanced because the canopy is sparse. As shown in Fig. 2, ambient MEK mix-ing ratios measured inside the canopy (2 m) increased with temperature in the morning. During the day, increased forest emissions of MEK seemed to balance the rise of the bound-ary layer depth, resulting in a plateau until sunset. The fluc-tuation of MEK after sunset may be understood as a result of a ceased source revealing the deposition as it can scarcely be explained by gas-phase chemistry or the reduced nocturnal boundary layer height.
During the CANOPÉE campaign at the O3HP site,
addi-tional GC-FID samples were taken at 2 m, allowing mea-surements of several anthropogenic light hydrocarbons, in-cluding n-butane. This sampling was performed in parallel to the PTR-MS measurements. All samples contained n-butane, which typically has an anthropogenic origin with an average mixing ratio of 0.071 ± 0.09 (much lower mixing ratios than MEK), indicating there is no significant source of n-butane nearby. Hence, MEK at the O3HP site could not be related to
Figure 4. Hourly average MEK fluxes at the TT34 tower for the period September 2013–July 2014. The light-green circles repre-sent means and associated error bars are 1 standard deviation. The central line of the box plots (dark green) indicates the median, the bottom and top lines are the 25th and 75th percentile, respectively, and whiskers are the 5th and 95th percentiles. Red dashed lines in-dicate the propagated limit of detection calculated according to the method outlined by Langford et al. (2015).
the atmospheric oxidation of n-butane. Furthermore, the ab-sence of a correlation with other anthropogenic tracers leads us to conclude that MEK at this site was predominantly of biogenic origin.
The measurements obtained by PTR-MS at the presented sites dominated by biogenic emissions were occasionally confirmed by GC-FID and GC-MS, which are compound-selective. At ATTO the same range of MEK mixing ratios for the same hour of the day and height for the GC-FID and the PTR-MS measurements was found, indicating that the PTR-MS signal was only or at least dominated by MEK. To identify sources, canopy measurements at SMEAR Es-tonia were complemented by emission measurements us-ing cuvettes with GC-MS identification. Common hemibo-real forest species, such as Quercus robur, Tilia cordata, Sorbus aucuparia, Betula pubescens and Picea abies, were screened for VOC emissions. The highest emissions of MEK were found from Tilia cordata and Picea abies (Table 2). The data are consistent with those reported by Bourtsoukidis et al. (2014b), who measured an emission rate of MEK of 2.6 ± 2.2 ng g−1(dw needles)s−1from Picea abies using PTR-MS. The GC-MS technique obtained a very similar value of 2.3 ng g−1(dw needles)s−1. MEK emissions from Picea abies were relatively small compared to other VOCs emitted by the same plant species such as total monoterpenes and acetone, which reached 93.2 and 27.6 ng g−1(dw needles)s−1, respectively (Bourtsoukidis et al., 2014b). In addition to plant sources, the emissions rates of MEK from leaf litter were quantified using a GC-MS. MEK litter emissions, with a monthly
av-Table 2. Emission rates of MEK for typical hemiboreal plant species and soil litter measured by GC-MS technique at the SMEAR site. Plant species and Mean Standard Standard Median Number of
soil cuvettes µg m−2h−1 deviation error µg m−2h−1 data points µg m−2h−1 µg m−2h−1 for statistics Quercus robur 8.12 – – – 1 Tilia cordata 12.93 4.89 3.46 12.93 3 Sorbus aucuparia 9.08 – – – 1 Betula pubescens 9.36 5.10 2.94 8.21 3 Picea abies 13.76 5.05 2.91 15.51 3 Leaf litter 7.00 3.37 2.11 6.58 24
erage of 7 µg m−2h−1, were of comparable magnitude to the emissions rates of MEK from the screened hemiboreal forest tree species, including Quercus robur or Sorbus aucuparia, which emitted 8–9 µg m−2h−1of MEK (Table 2).
3.2 Anthropogenically influenced sites
Anthropogenically influenced sites are characterised by air masses that have passed over polluted cities or industrialised regions. This air typically has elevated mixing ratios of NOx,
other products of fossil fuel combustion such as aromatic compounds, and carbon monoxide (CO), as well as higher aerosol loading. Regional biomass burning plumes can also be a source of anthropogenic input to air masses and are here considered anthropogenic.
The T2 dataset was sorted for polluted periods (air masses loaded with CO, black carbon, high aerosol loading, aro-matic compounds) and non-polluted periods. Periods with CO higher than 130 ppb during the tropical wet season and higher than 160 ppb during the dry season were considered polluted. As shown in Fig. 5, MEK mixing ratios strongly increase with pollution. The T2 site in Brazil is located on the bank of the Rio Negro and is affected by both the tropical rainforest (biogenic) and the megacity of Manaus (anthro-pogenic). The location of the T2 site downwind of Manaus and upwind of the rainforest minimises the biogenic influ-ence. MEK mixing ratios were generally lower for the clean conditions at T2 than mixing ratios found at ATTO or TT34 (Figs. 2 and 5). Nevertheless, the mixing ratios of MEK dur-ing polluted conditions (0.7 ± 0.33 ppb durdur-ing dry season at 13:00 LT) reached or even exceeded those at the other trop-ical rainforest sites (0.32 ± 0.13 ppb at 13:00 LT for ATTO and 0.45 ± 0.28 ppb at TT34; Figs. 2 and 5). Presumably, an-thropogenically affected air as transported across the Rio Ne-gro from the city of Manaus (∼ 2 million inhabitants; IBGE, 2014) generated a plume with a mixture of anthropogenic MEK directly emitted in Manaus or MEK formed by oxida-tion of, for example, n-butane during transport. The general trend observed in Fig. 6 is an increase in MEK mixing ratios when easterly winds came from Manaus (located to the east of T2). However, there were times when winds blew from the north, and incident air masses passed through large
rainfor-est areas, in which TT34 is included; these air masses then crossed the river and arrived at the site. During these times, when air masses were mostly dominated by biogenic emis-sions, MEK enhancement reached on average 0.2 ppb.
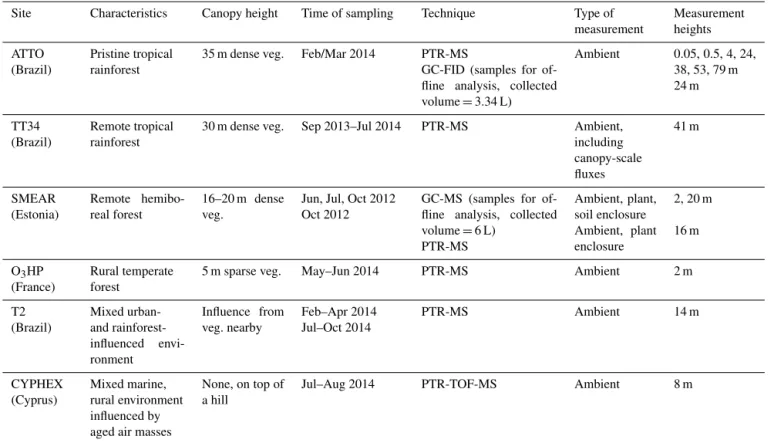
Mixing ratios of MEK at T2 were found to be significantly enhanced during polluted conditions for both dry and wet season (Fig. 7). The relative enhancement within polluted pe-riods at 13:00 LT ranged around a factor of 1.5 for the wet season and of 1.8 for the dry season. During the dry sea-son, the day-to-day variability was more intense, as reflected by the standard deviations which increased by 360 % for the clean conditions and 410 % for the polluted conditions rela-tive to the wet season clean and polluted values, respecrela-tively. This may indicate a difference in the sources and sinks reg-ulating MEK mixing ratios among the different seasons. Ex-amples of this difference could be an increase in MEK due to biomass burning, more abundant during the dry season, or changes in the deposition rates due to changes in rain fre-quency.
The CYPHEX campaign took place at Ineia, north-west Cyprus, at a location that has very little significant vegeta-tion nearby. The air masses that pass through the site are ei-ther from western Europe, passing across France and Spain and then the Mediterranean Sea, or from south-eastern Eu-rope (e.g. Turkey, Greece). During the CYPHEX campaign, the hourly median MEK mixing ratios did not show any dis-tinct diel cycle or relations to temperature or net radiation (Fig. 5), strongly suggesting that no significant local sources were present. Furthermore, backward air mass trajectories, as calculated by the HYSPLIT model (NOAA Air Resources Laboratory, USA; Stein et al., 2015) (Fig. 8), can be used to delineate times when Cyprus was affected by easterly and westerly flow. These trajectories were started at 650 m height with the ensemble mode. The periods (east, west) were cho-sen on the basis of the FLEXPART model. Further informa-tion can be found in Derstroff et al. (2016). On average, east-erly air masses contained 0.13 ± 0.03 ppb, whereas westeast-erly masses contained 0.08 ± 0.02 ppb. This difference can be due to differences in source strength, to the greater duration of boundary layer transport from the west and hence marine up-take, or to photochemical loss during transport.
1000 800 600 400 200 0 P A R m o l m s -2-1 00:00 06:00 12:00 18:00 30 28 26 24 22 20 Temperature ºC 00:00 06:00 12:00 18:00 Local time 0.5 0.4 0.3 0.2 0.1 0.0 MEK ppb T2 MEK polluted MEK clean CYPHEX µ
Figure 5. Hourly average diel cycles of MEK at the T2 (left) and CYPHEX (right) sites, for the period of measurements (wet season 2014 for T2 at 14 m, July and August 2014 for CYPHEX at 12 m). For T2 a separation between polluted (dotted black line) and clean (thick blue line) air masses was done. Hourly mean diel cycles of temperature and PAR are also shown in red and grey, respectively. Error bars represent the standard deviations.
1 2 3 30 210 60 240 90 270 120 300 150 330 180 0 0.05 0.10 0.15 0.20 0.25 0.30 0.35 MEK ppb 5 4 3 2
Figure 6. Polar surface plot for average MEK mixing ratios at a given wind direction (angle, 1–5 m s−1)and wind speed (radius).
3.3 Compilation of measurement data
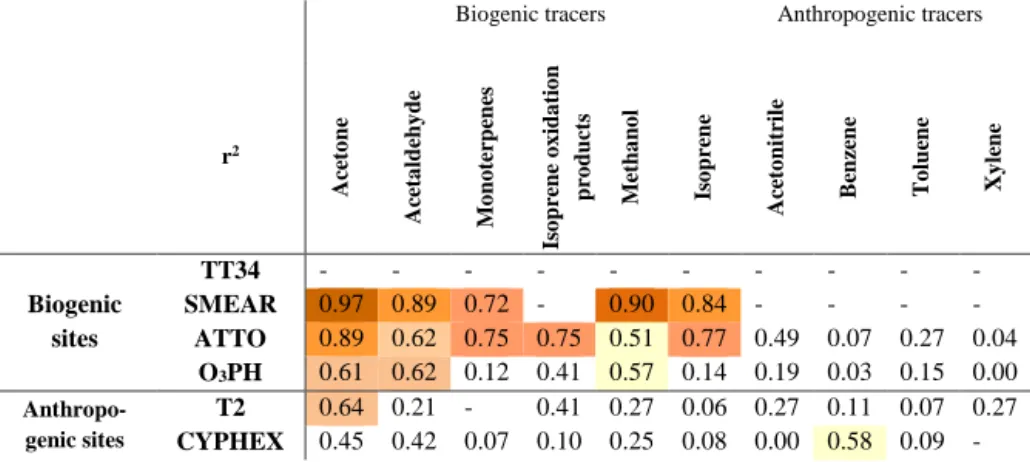
In order to investigate the origin and characteristics of MEK in the atmosphere, we calculated the correlation coeffi-cient (r2)between the mixing ratios of MEK and other co-measured VOC species for each site (Table 3). This coeffi-cient is the ratio of the variability in the MEK mixing ra-tios to the variability in the other VOC mixing rara-tios avail-able for each site. The correlation between MEK and other VOC helps to identify possible similarities such as com-mon sources, sinks, chemical mechanisms, or transport pro-cesses. However, this comparison does not necessarily claim links between the various compounds. Acetone, acetalde-hyde, monoterpenes, isoprene, isoprene oxidation products and methanol are regarded as being mainly of biogenic origin especially in forested areas (Kesselmeier and Staudt, 1999; Laothawornkitkul et al., 2009). Nevertheless, acetone, ac-etaldehyde and methanol may have additional sources in-cluding direct and secondary anthropogenic emissions that cannot be neglected even at clean environments (Goldstein
1.0 0.8 0.6 0.4 0.2 0.0 MEK ppb 00:00 06:00 12:00 18:00 Local time
Dry season clean air masses Wet season clean air masses
Dry season polluted air masses Wet season polluted air masses
Figure 7. Hourly average concentrations of MEK in ppb for the clean conditions (blue) and the polluted conditions (red) at the T2 site. Dashed lines represent the dry season and thick lines represent the wet season. Error bars represent the standard deviation.
and Schade, 2000; Yáñez-Serrano et al., 2015). Compounds such as benzene, toluene, xylene and acetonitrile are con-sidered typical anthropogenic tracers (Andreae and Merlet, 2001; Finlayson-Pitts and Pitts Jr., 1997).
In general, biogenic sites, namely ATTO, SMEAR Esto-nia, and O3HP, showed relatively high correlations between
MEK and almost all biogenic VOCs (r2>0.5). Exceptions appear in the r2 values for O3HP. For instance, the
high-est correlation coefficient (r2)was found for MEK and ace-tone at the SMEAR site (r2=0.97). A high correlation co-efficient could indicate that the atmospheric processes gov-erning acetone and MEK abundance are likely very simi-lar (Zhou and Mopper, 1993). In SMEAR Estonia, overall high correlations were found between MEK and the oxy-genated compounds, acetone, acetaldehyde and methanol, as
West East West East West East West
Figure 8. Timeline of MEK mixing ratios divided into periods when the air was coming from either eastern or western Europe. The HYSPLIT backward trajectories from 14 July and 28 August 2014 are shown based on the origin of the air masses. The black line represents the average of the whole campaign.
well as with monoterpenes and isoprene. At ATTO, corre-lations were only slightly lower. The correlation coefficient (r2) calculated for the O3HP observations were generally
lower than for ATTO and SMEAR Estonia, further influ-enced by the higher turbulent mixing due to sparser vege-tation, leading to fastest transport to the atmosphere. Never-theless, the good correlations of MEK with typical biogeni-cally emitted compounds, such as isoprene, isoprene oxida-tion products, monoterpenes, methanol and acetone, corrob-orated the biogenic origin of MEK emissions at the biogenic sites.
At the anthropogenically influenced sites, T2 and CYPHEX, correlation coefficient (r2)for the biogenic com-pounds were generally lower, apart from the r2 (0.64 and 0.45, respectively) between MEK and acetone. It is important to note that although T2 is a mixed anthropogenic and bio-genic site, the correlation coefficient (r2)was high for MEK and acetone but very low for the rest of the biogenic com-pounds. For the anthropogenic compounds, T2 had an r2of 0.27 for MEK and acetonitrile and MEK and xylene. Further-more, the data from the Cyprus site showed poor correlation of MEK with any biogenic compound but a correlation coef-ficient of r2=0.58 for MEK and toluene, an anthropogenic tracer.
4 Discussion
4.1 PTR-MS measurements
Most of the measurements in this study were performed with a quadrupole PTR-MS, a technique that monitors se-lected VOC ions, online and with fast time response. A dis-advantage is the separation by masses with a mass resolu-tion of only 1 amu. For some masses, several compounds and/or compound fragments may be detected as one signal. The quadrupole PTR-MS signal at m/z 73 is attributed to MEK, but may have contributing signals of water clusters (de Gouw and Warneke, 2007), butanal (Inomata et al., 2010; McKinney et al., 2011; Slowik et al., 2010; Warneke et al., 2007), acrylic acid (de Gouw et al., 2003), 2-methyl propanal (Baraldi et al., 1999; Jardine et al., 2010), and methyl glyoxal (Holzinger et al., 2007; Jordan et al., 2009b). We have tried to take into account possible interferences by using different analytical techniques and supplementary information. At the SMEAR Estonia site, the accompanying GC-MS observa-tions validated the signal for MEK. Additionally, the GC-FID samples taken at ATTO corroborated the signal for MEK at this site. Nevertheless, we try to give a short overview below about the interferences of other trace gases with the PTR-MS identification of MEK.
A. M. Yáñez-Serrano et al.: Atmospheric mixing ratios of methyl ethyl ketone (2-butanone) 10975
Table 3. Correlation coefficients (r2)of MEK with other co-measured VOC at the sites investigated. The correlations above 0.5 are colour-coded with warmest colours for highest correlation coefficients. Correlation coefficients (r2)for the TT34 site in Amazonia are missing due to lack of data.
cuvettes µg m-2 h-1 deviation
µg m-2 h-1 µg m-2 h-1 µg m-2 h-1 points for statistics
Quercus robur 8.12 - - - 1 Tilia cordata 12.93 4.89 3.46 12.93 3 Sorbus aucuparia 9.08 - - - 1 Betula pubsecens 9.36 5.10 2.94 8.21 3 Picea abies 13.76 5.05 2.91 15.51 3 Leaf litter 7.00 3.37 2.11 6.58 24
Table 3: Correlation coefficients (r2) of MEK with other co-measured VOC at the sites investigated. The
correlations above 0.5 are colour coded with warmest colours for highest correlation coefficients.
Correla-tion coefficients (r2) for the TT34 site in Amazonia are missing due to lack of data.
Biogenic tracers Anthropogenic tracers
r2 Ac eto n e Ac eta ld eh y d e Mo n o te rp en es Is o p re n e o x id a ti o n p ro d u cts Meth a n o l Is o p re n e Ac eto n itrile Be n ze n e To lu en e Xy lene Biogenic sites TT34 - - - - SMEAR 0.97 0.89 0.72 - 0.90 0.84 - - - - ATTO 0.89 0.62 0.75 0.75 0.51 0.77 0.49 0.07 0.27 0.04 O3PH 0.61 0.62 0.12 0.41 0.57 0.14 0.19 0.03 0.15 0.00 Anthropo-genic sites T2 0.64 0.21 - 0.41 0.27 0.06 0.27 0.11 0.07 0.27 CYPHEX 0.45 0.42 0.07 0.10 0.25 0.08 0.00 0.58 0.09 -
Table 3: Literature compilation of MEK mixing ratios measurements in different ecosystems around the globe from a wide range of atmospheric environments.
Reference MEK mixing
ratio in ppb Type of environment Reported data
Height from
surface Time of measurement
Zhou and Mopper, 1993 0.03 Caribbean ocean Cruise data, total average 10m October 1988
Ho et al., 2002 0.14 Hong Kong urban centre annual average 6m April 2000-April 2001
Cecinatto et al., 2002 0.15 Algeria rural residential site Daytime average Not specified January 2001 Cecinatto et al., 2002 0.23 Algeria rural residential site Daytime average Not specified August 2001
Feng et al., 2004 2.11 China urban site Evening time Not specified August–September 2002 Hellen et al., 2004 0.073 Finnish boreal forest site Diel average 1 m March-April 2003
Sighn et al., 2004 0.12 Tropospheric pacific ocean Non specified 0-2km February-April 2001
Legreid et al., 2007 0.2* Swiss urban site Annual average 8 m Throughout 2005
Davison et al., 2007 0.8* Swiss permanent grassland site Daytime average 1.2 m June 2005
Methyl glyoxal is a likely contributor to the observed signal at the PTR-MS protonated mass m/z 73, especially in areas where there are high levels of isoprene. It is formed following the oxidation of methyl vinyl ketone and methacrolein, which are both isoprene oxidation products (Calvert and Madronich, 1987; Lee et al., 2006). Supported by GC-FID measurements and relatively low isoprene lev-els during the wet season (Yáñez-Serrano et al., 2015), we can assume that the contribution of methyl glyoxal to this mass was insignificant at the rainforest sites (ATTO and TT34). Despite the high isoprene emissions at O3HP, the
cor-relation between MEK and the isoprene oxidation products was low (r2=0.41), suggesting that methyl glyoxal did not significantly contribute to the signal at m/z 73. During the CYPHEX campaign the PTR-ToF-MS could unambiguously distinguish between MEK and methyl glyoxal (at 73.0648 and 73.0284 amu, respectively).
Even though a contribution of butanal to m/z 73 of up to 65 % (Lindinger et al., 1998) and 20 % (Williams et al., 2001) has been reported previously, most butanal fragments on m/z 57 (Ionicon Analytic GmbH). Acrylic acid, a marine compound (Liu et al., 2016) that may interfere at m/z 73, was probably not of relevance at sites under biogenic in-fluence. However, in the case of anthropogenically influ-enced sites, such as T2, interferences may have been of rele-vance. Karl et al. (2007) and Ciccioli et al. (2014) measured tropical biomass burning emissions and found that m/z 73 is comprised of 74 % MEK and 23 % 2-methyl propanal (73.1057 amu). Even though none of the sites presented in this study was severely influenced by biomass burning, we cannot completely rule out a possible direct emission of 2-methyl propanal by plants, which is of lower magnitude than from biomass burning (Hafner et al., 2013; Jardine et al., 2010; Karl et al., 2005a). Due to the standard operation conditions of the PTR-MS under our measurement condi-tions, we neglected water clusters as they are regarded to
be insignificant (McKinney et al., 2011; Yáñez-Serrano et al., 2015). To summarise these issues, we note that several studies have concluded m/z 73 to originate from MEK only (Bourtsoukidis et al., 2014b; Crutzen et al., 2000; De Gouw et al., 1999, 2000; Holzinger et al., 2000; Karl et al., 2001, 2005a; Kim et al., 2015; Millet et al., 2015; Steeghs et al., 2004). Based on these considerations and the similarity of magnitudes measured by the PTR-MS as compared with the GC results, we assume m/z 73 is representative of the atmo-spheric MEK present.
4.2 The biogenic MEK
The data obtained at the biologically influenced sites demon-strated that MEK was emitted by vegetation. This is clearly supported by the canopy-scale net flux observations of MEK at the TT34 rainforest site (Fig. 4) as well as the diel cy-cles of the mixing ratios at the other biogenically influenced sites (Fig. 2). Furthermore, the leaf-level cuvette measure-ments at SMEAR Estonia also corroborated the MEK emis-sion by vegetation. In addition, a contribution by other bio-genic sources such as dead and decaying plant matter was also observed at SMEAR Estonia to be of similar magnitude to boreal plant species emissions and indicative of a source from plant litter, in accordance with the results from Warneke et al. (1999) that measured MEK emission from the abiotic processes of plant decaying matter. This is not the case for the tropical sites where vertical profiles show that canopy emis-sions dominate.
High correlation coefficients suggested strong relations between the emission processes for MEK and other bio-genic compounds (Table 3). A similar approach has been used previously by Goldstein and Schade (2000) to unveil the sources of acetone. Similarly, Davison et al. (2008) found a high correlation coefficient between MEK and acetone of r2=0.87 and a relatively poor correlation between MEK
and monoterpenes (r2=0.54). They surmised that good cor-relations indicated a common origin for biogenically emit-ted compounds. Furthermore, a resemblance of the pattern of acetone and MEK has been reported for the ATTO site be-fore (Yáñez-Serrano et al., 2015). In our study, we found high correlation coefficients (r2)for MEK with acetone and MEK with temperature, and lower r2 for MEK and compounds such as isoprene and monoterpenes for all the biogenic sites (Table 3). This could indicate that MEK forest sions are more related to processes resembling acetone emis-sions and temperature-dependent processes, rather than light-and temperature-dependent emission mechanisms, as for iso-prene and monoterpenes (Jardine et al., 2015; Kesselmeier and Staudt, 1999).
Plant physiological production pathways have been re-ported for MEK formation. MEK can be formed, similarly to acetone, as a by-product of a cyanohydrin lyase reac-tion during cyanogenesis (Fall, 2003; Vetter, 2000). This chemical defence pathway was also identified in clover by Kirstine et al. (1998) and de Gouw et al. (1999) as a re-sult of mechanical stress, and can be of special importance for tropical rainforests (Miller et al., 2006). On the other hand, in places such as SMEAR Estonia, dominating plant species are not cyanogenic, and other processes for MEK formation are probably more dominant. In pine trees, ace-tone is produced from light-dependent and independent pro-cesses that can be associated with the decarboxylation of acetoacetate occurring in microorganisms and animals (Fall, 2003), from oxidation of fatty acids leading to ketone emis-sions (Niinemets et al., 2014), from pyruvic acid leading to acetyl-CoA (Kesselmeier and Staudt, 1999), or from unchar-acterised biochemical reactions (Fall, 2003). Such processes could also be related to MEK emissions.
Even though extensive laboratory measurements are needed to identify the dominant plant process or processes responsible for MEK emission, this study demonstrated the role that temperature can exert on such emissions. Hence, forests around the world may act as very different sources for atmospheric MEK. This can be seen for boreal forests (SMEAR Estonia), with distinctly lower temperatures, where MEK levels were significantly lower. However, other fac-tors must be considered (Schade et al., 2011), such as leaf area index (LAI) and plant species composition, as well as the environmental factors, water availability and mechanical stress, the latter having already been observed by de Gouw et al. (1999) to act as a driver for MEK emissions.
Due to its relatively long atmospheric lifetime (∼ 5 days for the reaction with OH; Grant et al., 2008), MEK is expected to accumulate in the atmosphere until removal. Hence, atmospheric mixing ratios can reflect seasonality and changes in dominating sources, affected by radiation, tem-perature and phenology, from more biogenic dominance dur-ing the wet season to transport phenomena and oxidation processes of primarily emitted compounds from regional biomass burning, as was seen in 2013 at the ATTO site
(Yáñez-Serrano et al., 2015). Moreover, a possible produc-tion from certain terpenes through ozonolysis cannot be ex-cluded (Holzinger et al., 2005). Additionally, the canopy structure seems to be important for air mixing and trans-port, as seen for the O3HP site with an apparently faster
mixing due to sparser vegetation and consequent dampen-ing of the amplitude of the diel cycle. Furthermore, due to its oxygenated nature, partitioning to and from aqueous sur-faces is likely, including deposition and surface reactions. Its high water solubility might allow dissolution within leaf wa-ter (Sander, 2015), triggering bidirectional exchange of MEK (Karl et al., 2005b; McKinney et al., 2011; Niinemets et al., 2014). Due to its high solubility in water and its relatively long lifetime, MEK could potentially influence gas–aqueous reactions on aerosol surfaces (Nozière, 2005). This has been shown indirectly by the production of methyl glyoxal after its oxidation by OH, having implications for the formation of organics in the aerosol aqueous phase (Rodigast et al., 2016).
4.3 The anthropogenic MEK
A clear difference could be observed between the anthro-pogenic and biogenic influenced sites presented in this study. The T2 site represented a site with mixed influence by urban area and tropical rainforest. Affected by anthropogenic and biogenic sources, ambient mixing ratios of MEK were higher than at the pristine ATTO rainforest site. Polluted episodes (from the Manaus plume) with an increase in MEK could be distinguished for both the wet and the dry season, suggest-ing a short-range transport of air masses. On the other hand, when the wind is blowing from the north, MEK mixing ratios were also present, showing an influence from biogenic forest emissions (Fig. 7), thus having a mix of biogenic and anthro-pogenic influence at the T2 site. A strong seasonality of MEK mixing ratios at T2 reflected biomass burning as a common occurrence in the Amazon region during the dry season (Ar-taxo et al., 2013). In addition to MEK, a higher contribution of butanal affecting m/z 73 (Inomata et al., 2010; Karl et al., 2007) might be possible, although MEK has been reported to have a much higher emission factor (range from 0.17 to 0.83) than butanal (range from 0.04 to 0.21) for biomass burning (Andreae and Merlet, 2001).
We regarded CYPHEX as an anthropogenically influenced site with weak or no apparent direct sources but which was affected by anthropogenic air masses after long-range transport over marine areas. Losses by transport over the sea and chemical decomposition led to the lowest averaged MEK mixing ratios of all compared sites. Correlation co-efficients (r2)of MEK with the biogenic tracers were rela-tively poor for T2 and CYPHEX. However, correlations were also poor for the anthropogenic tracers, although slightly bet-ter than at the biogenic sites. MEK showed highest corre-lation with acetone, indicating similar sources and fate in air mixing and chemistry processes. MEK transported over long distances (10 days) is lost by photochemical aging or
Table 4. Literature compilation of MEK mixing ratios measurements in different ecosystems around the globe from a wide range of atmo-spheric environments.
Reference MEK mixing Type of Reported Height from Time of ratio in ppb environment data surface measurement Zhou and Mopper
(1993)
0.03 Caribbean Sea Cruise data, total average
10 m October 1988
Ho et al. (2002) 0.14 Hong Kong urban cen-tre
Annual average 6 m April 2000–April 2001
Cecinato et al. (2002)
0.15 Algerian rural residen-tial site
Daytime average Not specified January 2001
Cecinato et al. (2002)
0.23 Algerian rural residen-tial site
Daytime average Not specified August 2001
Feng et al. (2004) 2.11 Chinese urban site Evening time Not specified August– September 2002 Hellén et al. (2004) 0.073 Finnish boreal forest
site
Diel average 1 m March–April 2003 Sighn et al. (2004) 0.12 Tropospheric Pacific
Ocean
Not specified 0–2 km February–April 2001
Legreid et al. (2007) 0.2a Swiss urban site Annual average 8 m Throughout 2005 Davison et al. (2008) 0.8b Swiss permanent
grass-land site
Daytime average 1.2 m June 2005
Grant et al. (2008) ∼0.5 Senegalese rural site Daytime average 6 m September 2006 Jordan et al. (2009b) 0.13 USA mixed rural site Interannual median
from 2005 to 2008
12 m From 2005 to 2008
Kim et al. (2015) ∼4 South Korean semi-rural site
Diel average 15 m June 2013
Yáñez-Serrano et al. (2015)
0.43 Brazilian tropical rain-forest site (ATTO)
Daytime average 38 m September 2013
Yáñez-Serrano et al. (2015)
0.13 Brazilian tropical rain-forest site (ATTO)
Daytime average 38 m February–March 2013
This study 0.39 Brazilian tropical rain-forest site (ATTO)
Daytime average 38 m February–March 2014
This study 0.39 Brazilian tropical rain-forest site (TT34)
Daytime average 41 m September 2013–July 2014 This study 0.19 Hemiboreal forest site
(SMEAR Estonia)
Daytime average 16 m October 2012
This study 0.30 French Mediterranean forest (O3HP)
Daytime average 2 m May–June 2014
This study 0.13 Brazilian mixed tropi-cal rainforest site (T2)
Daytime average 14 m February– October 2014 This study 0.11 Cyprian rural site
(CYPHEX)
Daytime average 8 m July–August 2014
deposition as evidenced by the lowest values reported from CYPHEX. This is despite known secondary photochemical sources, i.e. n-butane oxidation (Katzenstein et al., 2003; Kwok et al., 1996). Interestingly, even under polluted condi-tions, MEK did not correlate with aromatic compounds, ex-cept during CYPHEX, although this correlation deteriorated in the more aged westerly air masses. This can only be under-stood as a result of a very complex mixture of anthropogenic sources of MEK which vary from direct emission by indus-try (Legreid et al., 2007), gasoline combustion (Verschueren, 1983), biomass burning (Andreae and Merlet, 2001) and ve-hicular emissions (Brito et al., 2015). Furthermore, chemical processing during transport may contribute, such as oxida-tion of n-butane; however, the longer transport times during CYPHEX from the west corresponded to lower values.
5 Remarks and conclusions
The comparison of MEK mixing ratios in different parts of the world is necessary in order to understand how this ubiq-uitous compound occurs and behaves in the atmosphere. To summarise, Table 4 aims to provide a numerical compari-son of MEK mixing ratios reported around the globe. While MEK mixing ratios in our study are relatively constant, MEK has been measured in many different ecosystems ranging from 0.073 ppb to 4 ppb. Therefore, it is important to con-sider the variability in this compound as MEK can lead to PAN and ozone formation in the atmosphere (Pinho et al., 2005). Photochemical odd-hydrogen production in the up-per troposphere (Atkinson, 2000; Baeza Romero et al., 2005; De Gouw et al., 1999) can further enhance the MEK ozone forming potential (Folkins et al., 1998; Prather and Jacob, 1997). Of the widely used atmospheric chemistry models, only GEOS-Chem explicitly computes MEK but only with regard to anthropogenic origin. On the basis of the data pre-sented here from forest sites, it is necessary for atmospheric chemistry models to also include biogenic MEK emissions to better estimate its effects on the environment. Sites under biogenic influence showed marked diel variability, matching biogenic VOC emissions and temperature. Structural forest features seem to affect turbulent mixing and diluting of trace gases like MEK, as in the case of O3HP with patchy
vegeta-tion. MEK seemed to be produced in plants in a similar fash-ion to acetone, likely released during mechanical stress. Pos-sible pathways for productions in plants are oxidation of fatty acids, cyanogenesis, production from pyruvic acid leading to acetyl-CoA, and light-dependent and independent processes that can be associated with the decarboxylation of acetoac-etate occurring in microorganisms and animals.
This study presents the first compilation and compari-son of ambient measurements of MEK at different sites. MEK patterns and mixing ratios differ around the globe depending on sources and transport. Vegetation and litter have been identified as sources of MEK and magnitude of sources varied among the tropical rainforest, the Mediter-ranean temperate forest and the hemiboreal forest following a likely temperature dependence. However, via different filter-ing methodologies (CO filterfilter-ing and backward trajectories), the anthropogenic input from polluted regions, such as the mixed urban and tropical rainforest and mixed marine envi-ronment, is often found to be the dominant contribution.
6 Data availability
Even though the data are still not available in any public repository, as the authors are still working on other parts of the data collected during the campaigns, the data are avail-able upon request from the main author.
Acknowledgements. For ATTO, we thank the Max Planck Society and the Instituto Nacional de Pesquisas da Amazonia for contin-uous support. Furthermore, we acknowledge the support by the ATTO project (German Federal Ministry of Education and Re-search, BMBF funds 01LB1001A; Brazilian Ministério da Ciên-cia, Tecnologia e Inovação FINEP/MCTI contract 01.11.01248.00), UEA and FAPEAM, LBA/INPA, and SDS/CEUC/RDS-Uatumã. We would especially like to thank all the people involved in the lo-gistical support of the ATTO project, in particular Reiner Ditz and Hermes Braga Xavier. We acknowledge the micrometeorological group of INPA/LBA for their collaboration concerning the meteoro-logical parameters, with special thanks to Marta Sá, Antonio Huxley and Leonardo Oliveira. We would like to acknowledge Stefan Wolff for the construction, support and maintenance of the inlet system. We are grateful to Nina Knothe for logistical help. We would also like to thank Thomas Klüpfel for all the great support provided with the PTR-MS operation in the laboratory as well as in the field. This paper contains results of research conducted under the Tech-nical/Scientific Cooperation Agreement between the National Insti-tute for Amazonian Research, the State University of Amazonas, and the Max-Planck-Gesellschaft e.V.; the opinions expressed are the entire responsibility of the authors and not of the participating institutions.
For TT34, we thank the Natural Environment Research Coun-cil for funding the CLAIRE-UK project (reference NE/I012567/1), A. Valach, B. Davison and M. Shaw for assistance and A. R. MacKenzie for valuable discussions.
For SMEAR, we would like to acknowledge the EU Re-gional Development Foundation: “Environmental Conservation and Environmental Technology R&D Programme” project BioAtmos (3.2.0802.11-0043), “Internationalization of Science Programme” project INSMEARIN (10.1-6/13/1028), and the “Estonian Re-search Infrastructures Roadmap” project Estonian Environmental Observatory (3.2.0304.11-0395). We express our gratitude to the Archimedes Foundation (international programme DoRa) and the “Freunde und Förderer der Goethe Universität” that provided fund-ing to E. Bourtsoukidis for conductfund-ing research in Estonia. We
would like to additionally thank Dominika Radacki, Javier Roa-les, Beate Noe, Eero Talts, Ahto Kangur and Miguel P. Estrada for providing valuable help with the setup and transportation. Special thanks to Boris Bonn for the insightful discussions and comments during the production of this article.
For O3HP, the measurements presented in this study were
sup-ported by the European Commission’s 7th Framework Programme under grant agreement number 287382 “PIMMS”, as well as by ANR-CANOPEE and ChArMEx, CEA and CNRS. We acknowl-edge B. Bonsang and C. Kalogridis for the GC-FID measurements, J. P. Orts and I. Reiter for logistical support, and J. Lathière for managing the CANOPÉE project.
For T2, we thank Bruno Takeshi for all the logistical sup-port. Furthermore, we acknowledge the support by FAPESP grant 2013/25058-1 and 2013/05014-0.
For CYPHEX, the authors gratefully acknowledge the NOAA Air Resources Laboratory (ARL) for the provision of the HYS-PLIT transport and dispersion model and READY website (http://www.ready.noaa.gov) used in this publication.
The article processing charges for this open-access publication were covered by the Max Planck Society. Edited by: E. Harris
Reviewed by: two anonymous referees
References
Andreae, M. O. and Merlet, P.: Emission of trace gases and aerosols from biomass burning, Global Biogeochem. Cy., 15, 955–966, doi:10.1029/2000gb001382, 2001.
Andreae, M. O., Acevedo, O. C., Araùjo, A., Artaxo, P., Barbosa, C. G. G., Barbosa, H. M. J., Brito, J., Carbone, S., Chi, X., Cintra, B. B. L., da Silva, N. F., Dias, N. L., Dias-Júnior, C. Q., Ditas, F., Ditz, R., Godoi, A. F. L., Godoi, R. H. M., Heimann, M., Hoff-mann, T., Kesselmeier, J., KöneHoff-mann, T., Krüger, M. L., Lavric, J. V., Manzi, A. O., Lopes, A. P., Martins, D. L., Mikhailov, E. F., Moran-Zuloaga, D., Nelson, B. W., Nölscher, A. C., Santos Nogueira, D., Piedade, M. T. F., Pöhlker, C., Pöschl, U., Que-sada, C. A., Rizzo, L. V., Ro, C.-U., Ruckteschler, N., Sá, L. D. A., de Oliveira Sá, M., Sales, C. B., dos Santos, R. M. N., Sat-urno, J., Schöngart, J., Sörgel, M., de Souza, C. M., de Souza, R. A. F., Su, H., Targhetta, N., Tóta, J., Trebs, I., Trumbore, S., van Eijck, A., Walter, D., Wang, Z., Weber, B., Williams, J., Winderlich, J., Wittmann, F., Wolff, S., and Yáñez-Serrano, A. M.: The Amazon Tall Tower Observatory (ATTO): overview of pilot measurements on ecosystem ecology, meteorology, trace gases, and aerosols, Atmos. Chem. Phys., 15, 10723–10776, doi:10.5194/acp-15-10723-2015, 2015.
Artaxo, P., Rizzo, L. V., Brito, J. F., Barbosa, H. M. J., Arana, A., Sena, E. T., Cirino, G. G., Bastos, W., Martin, S. T., and Andreae, M. O.: Atmospheric aerosols in Amazonia and land use change: from natural biogenic to biomass burning conditions, Faraday Discuss., 165, 203–235, doi:10.1039/c3fd00052d, 2013. Atkinson, R.: Atmospheric chemistry of VOCs and NOx, Atmos.
Environ., 34, 2063–2101, doi:10.1016/s1352-2310(99)00460-4, 2000.
Atkinson, R. and Arey, J.: Gas-phase tropospheric chemistry of bio-genic volatile organic compounds: A review, Atmos. Environ., 37, S197–S219, doi:10.1016/S1352-2310(03)00391-1, 2003. Baeza Romero, M. T., Blitz, M. A., Heard, D. E., Pilling, M.
J., Price, B., Seakins, P. W., and Wang, L.: Photolysis of methylethyl, diethyl and methylvinyl ketones and their role in the atmospheric HOx budget, Faraday Discuss., 130, 73–88,
doi:10.1039/b419160a, 2005.
Baraldi, R., Rapparini, F., Rossi, F., Latella, A., and Ciccioli, P.: Volatile organic compound emissions from flowers of the most occuring and economically important species of fruit trees, Phys. Chem. Earth B, 24, 729–732, doi:10.1016/S1464-1909(99)00073-8, 1999.
Bon, D. M., Ulbrich, I. M., de Gouw, J. A., Warneke, C., Kuster, W. C., Alexander, M. L., Baker, A., Beyersdorf, A. J., Blake, D., Fall, R., Jimenez, J. L., Herndon, S. C., Huey, L. G., Knighton, W. B., Ortega, J., Springston, S., and Vargas, O.: Measurements of volatile organic compounds at a suburban ground site (T1) in Mexico City during the MILAGRO 2006 campaign: mea-surement comparison, emission ratios, and source attribution, Atmos. Chem. Phys., 11, 2399–2421, doi:10.5194/acp-11-2399-2011, 2011.
Bourtsoukidis, E., Williams, J., Kesselmeier, J., Jacobi, S., and Bonn, B.: From emissions to ambient mixing ratios: online sea-sonal field measurements of volatile organic compounds over a Norway spruce-dominated forest in central Germany, Atmos. Chem. Phys., 14, 6495–6510, doi:10.5194/acp-14-6495-2014, 2014a.
Bourtsoukidis, E., Bonn, B., and Noe, S. M.: On-line field measure-ments of BVOC emissions from Norway spruce (Picea abies) at the hemiboreal SMEAR-Estonia site under autumn conditions, Boreal Environ. Res., 19, 153–167, 2014b.
Bracho-Nunez, A., Knothe„ N. M., Welter, S., Staudt, M., Costa, W. R., Liberato, M. A. R., Piedade, M. T. F., and Kesselmeier, J.: Leaf level emissions of volatile organic compounds (VOC) from some Amazonian and Mediterranean plants, Biogeosciences, 10, 5855–5873, doi:10.5194/bg-10-5855-2013, 2013.
Brilli, F., Gioli, B., Zona, D., Pallozzi, E., Zenone, T., Fratini, G., Calfapietra, C., Loreto, F., Janssens, I. A., and Ceulemans, R.: Simultaneous leaf- and ecosystem-level fluxes of volatile organic compounds from a poplar-based SRC plantation, Agr. Forest Me-teorol., 187, 22–35, doi:10.1016/j.agrformet.2013.11.006, 2014. Brito, J., Wurm, F., Yáñez-Serrano, A. M., de Assunção, J. V., Godoy, J. M., and Artaxo, P.: Vehicular Emission Ratios of VOCs in a Megacity Impacted by Extensive Ethanol Use: Results of Ambient Measurements in São Paulo, Brazil, Environ. Sci. Tech-nol., 49, 11381–11387, doi:10.1021/acs.est.5b03281, 2015. Calvert, J. G. and Madronich, S.: Theoretical study of the initial
products of the atmospheric oxidation of hydrocarbons, J. Geo-phys. Res., 92, 2211, doi:10.1029/JD092iD02p02211, 1987. Cecinato, A., Yassaa, N., Di Palo, V., and Possanzini, M.:
Obser-vation of volatile and semi-volatile carbonyls in an Algerian ur-ban environment using dinitrophenylhydrazine/silica-HPLC and pentafluorophenylhydrazine/silica-GC-MS, J. Environ. Monitor., 4, 223–228, doi:10.1039/b110616n, 2002.
Chew, A. A. and Atkinson, R.: OH radical formation yields from the gas-phase reactions of O3with alkenes and monoterpenes, J.


![[DOC] Cours Windows 2000 : comptes d'utilisateurs](data:image/gif;base64,R0lGODlhAQABAIAAAP///wAAACH5BAEAAAAALAAAAAABAAEAAAICRAEAOw==)