HAL Id: hal-01260394
https://hal.archives-ouvertes.fr/hal-01260394
Submitted on 22 Jan 2016
HAL is a multi-disciplinary open access
archive for the deposit and dissemination of
sci-entific research documents, whether they are
pub-lished or not. The documents may come from
teaching and research institutions in France or
abroad, or from public or private research centers.
L’archive ouverte pluridisciplinaire HAL, est
destinée au dépôt et à la diffusion de documents
scientifiques de niveau recherche, publiés ou non,
émanant des établissements d’enseignement et de
recherche français ou étrangers, des laboratoires
publics ou privés.
Estimation of driver awareness of pedestrian based on
Hidden Markov Model
Minh Tien Phan, Vincent Frémont, Indira Thouvenin, Mohamed Sallak,
Véronique Cherfaoui
To cite this version:
Minh Tien Phan, Vincent Frémont, Indira Thouvenin, Mohamed Sallak, Véronique Cherfaoui.
Esti-mation of driver awareness of pedestrian based on Hidden Markov Model. IEEE Intelligent Vehicles
Symposium (IV 2015), Jun 2015, Seoul, South Korea. pp.970-975, �10.1109/IVS.2015.7225810�.
�hal-01260394�
Estimation of Driver Awareness of Pedestrian
based on Hidden Markov Model
Minh Tien Phan
1, Vincent Fremont
1, Indira Thouvenin
1, Mohamed Sallak
1and Véronique Cherfaoui
1Abstract—Understanding driver behaviors is an important need for the Advanced Driver Assistance Systems. In particular, the pedestrian detection systems become extremely distracting and annoying when they inform the driver with unnecessary warning messages. In this paper, we propose to study the driver behaviors whenever a pedestrian appears in front of the vehicle. A method based on the driving actions and the Hidden Markov Model (HMM) algorithm is developed to classify the driver awareness of pedestrian and the driver unawareness of pedestrian. The method is successfully validated using the collected data from the experiments that are conducted on a driving simulator. Furthermore, two simple methods based on the static parameters such as the Time-To-Collision and the Required Deceleration Parameter are also applied to our problem and are compared to the proposed method. The result shows a significant improvement of the HMM-based method compared to the simple ones.
Index Terms—Driver Behaviors; Pedestrian Safety; Situation Awareness; Driving Simulation; Hidden Markov Model.
I. INTRODUCTION
R
ESEARCH on pedestrian detection systems has become quite active in both academia and automotive industry [9]. These systems can reliably detect the pedestrian in front of the vehicle and inform the driver of there presences. However, due to the lack of knowledge on the driver states, they can become extremely distracting and annoying when they detect pedestrians. Therefore, taking into account the driver behaviors in order to inform him at the right moment is a challenging task for such a system to work more efficiently. Recently, researchers have been investigating the driver abnormal state detection such as fatigue, somnolence or distraction detection [5][4][16][2]. These studies can be somehow applied to the pedestrian warning systems but they do not cover all the dangerous situations related to pedestrians because they don’t consider the particular driving context. The proposed problem is to analyze the driver behaviors in a particular situation related to pedestrians and to detect if the driver is unaware of them.The work presented in [7] was related to the scope of this paper. Based on the driving data, the authors proposed a probabilistic model in which they calculated the probability of an deceleration reaction is caused in response to driver’s awareness of a pedestrian. However, a deceleration reaction is insufficient to confirm the driver awareness of a pedestrian
1Sorbonne universités, Université de technologie de Compiègne, CNRS
7253 UMR/Heudiasyc. CS 60319, 60203 Compiègne cedex, France, e-mail: minh.phan@hds.utc.fr
because it could be a simple reaction to control the vehicle speed. Car driving is a complex activity that involves every levels of human cognition and requires an important level of situation awareness (SA) [6].
In this study, we focus on observing the driving actions such as accelerating, braking and steering whenever the driver is aware of pedestrian (DAP) or unaware of pedestrian (DUP). Hence, we proposed a method that uses two Hidden Markov Models (HMM) to represent the DAP and the DUP and a likelihood ratio threshold to classify them. Indeed, the HMM is considered to be a suitable tool to model the driver states through time and to recognize the significant temporal data patterns. Its formulation decomposes conveniently the DUP or the DAP into the distinct atomic levels which incorporates driving actions with a specified duration. This paper also compare this method with the two simple methods based on the relationship between observations such as the Time-To-Collision (TTC), or the Required Deceleration Pa-rameter (RDP). An experiment is performed with our driving simulator platform and the collected data are used for the performances analysis of the methods.
The paper is organized as follows: Part II presents the driver behaviors inference problem and the different factors involved in the decision making. In Part III, two simple methods based on the TTC and the RDP are presented follow by the proposed approach based on the HMM. In Part IV, we describe the experiment with its protocols and how we collected the data. In Part VI, we present some statistical results in two validation approaches. Finally, a conclusion with some future work is provided in part VII.
II. PROBLEMSTATEMENT
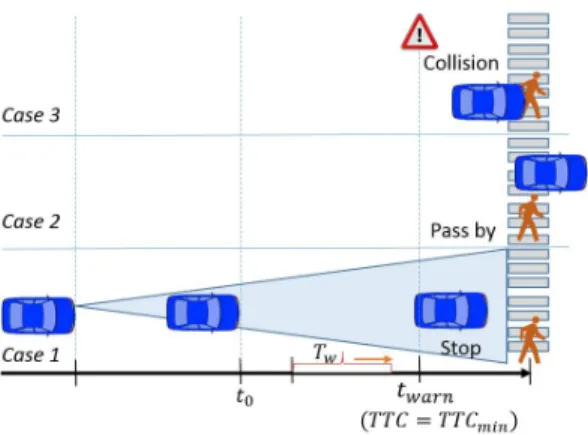
Let us consider a situation where a pedestrian appears at a certain distance in front of the vehicle. We consider different situations where the pedestrian is in different states (walking, standing, running) at different traffic positions (on lane, crossing mark, side walk). We suppose that the pedestrian can cross the road at any moment and the situation becomes dangerous. The objective is to recognize the driver unawareness of that pedestrian. For example, a driver who intents to stop in front of the pedestrian or to pass by the pedestrian safely is considered to be aware of that pedestrian. The driving actions are tracked as early as possible whenever the pedestrian is recognized by the pedestrian detection system (at t0 for example). The measurements
the driver behaviors as Awareness of Pedestrian (DAP) or Unawareness of Pedestrian (DUP). Different values of Tware
analyzed in the algorithm development; a larger Tw requires
more computational cost and might also include irrelevant measurements.
In case the driver is unaware of the pedestrian (DUP), the system will warn him at twarn which corresponds to the
critical moment when the Time-To-Collision (T T C) reaches the its minimum T T Cmin (Fig 1).
Figure 1. Case 1 and 2, the driver is supposed to be aware of pedestrian. If the driver is unaware of pedestrian (case 3), a warning is activated at T T Cmin
III. APPROACHES
A. Simple Methods
1) Time-to-Collision based: One of the most intuitive approaches to detect the driver unawareness is to use the time-to-collision (T T C). This type of temporal property is usually used for road traffic safety analysis [12]. Indeed, the TTC is defined as: “The time required for two vehicles to collide if they continue at their present speed and on the same path” [10]. It is simply calculated as: T T C =|V r
v−Vp|.
Where Vv and Vp are the vehicle current speed and the
pedestrian speed respectively, r is the distance between the vehicle and the pedestrian. For this method of classification, the T T C value is computed when the vehicle’s deceleration crosses a predefined threshold which indicates a reaction of the driver when he is aware of the pedestrian. Then the driver is classified as DUP if T T C < T T Cth where T T Cthis the
threshold presenting the time given for the driver to stop safely in front of the pedestrian after a deceleration. This static parameter can be adjusted to change how conservative the algorithm is in its classifications.
2) Required Deceleration Parameter based: The second simple technique is to use the Required Deceleration Param-eter (RDP). In [18][1], the RDP was used for classifying the driver as compliant or violating at road intersection. The idea is to provide the deceleration needed for the vehicle to stop safely knowing its distance to an obstacle and its current speed. It is defined as : RDP = 2rgV2 where g is the gravitational acceleration constant. For a given RDPth
threshold, the driver is classified as DAP whenever the RDP is bigger than RDPth. The RDP can be seen as
a relationship between the vehicle speed and the time-to-collision : RDP = 2rgV2 = 2T T CgV when the pedestrian speed is neglected in the formula of the T T C. This represents the acceleration reaction of the driver at the specific critical time. B. Hidden Markov Model Based Method
The HMMs have been successfully used in speech recogni-tion [11], signature recognirecogni-tion [23], and gesture recognirecogni-tion [22]. In the driving context, the HMMs were used with a dynamical scheme to predict the driver actions (right turn, left turn and stop) within the first 2 seconds of an action sequence [13]. In [13], a single HMM was used to identify the vehicles in conflict with other vehicles in a limited intersection road with appropriate measurements of the ego-vehicle and surrounding ego-vehicle dynamics. In [8][1], the authors used different frameworks of HMM to estimate the driving behaviors (left or right turn, straight or stop) at intersection and classify the driver as violator or compliant at intersection from the driving signals.
In [20], we have proposed to a discrete HMM to classify the DUP and the DAP. However, the discretization of the driving signal can lead to a degradation of its signification. Thus, in this paper, we propose to use the observation as a continuous signal and to model the distribution of emission by a Gaussian mixture distribution. The Gaussian distribu-tion is the most common and easily analyzed continuous distribution. It is also a reasonable model for our study. Using the driving actions, we propose to build two Gaussian-mixture-HMMs for two distinct behaviors: Driver Awareness of Pedestrian (DAP) and Driver Unawareness of Pedestrian (DUP).
In more details, a HMM can be characterized by:
• A set of N distinct states S = {S1, S2, ..., SN} of the
system.
• The initial state distribution Π = {π1, π2, ..., πN} where
πi = P (st = Si), 1 ≤ i ≤ N and st is the state of
system at time t.
• The state transitions probability distribution A = {aij}
where aij= P (st= Sj|st−1= Si), 1 ≤ i, j, ≤ N . • At a time t each state can produce one r-dimension
observation v which are the continuous driving signals.
• This emission probability distribution is assumed to be a mixture of multivariate Gaussian : B ={bj(v) =
1 M
PM
m=1ℵ(v, µjm, Σjm)} where M is number of
com-ponent of mixture and each comcom-ponent ℵ is a r-variate Gaussian distribution parameterized by a mean vector µjm and a covariance matrix Σjm.
• Therefore, the HMM can be written in a more compact form as λ = {Π, A, B}.
There are three problems of interest that must be solved for the model to be useful in real-world applications, the evaluation problem, the decoding problem and the learning problem.
Firstly, we are interested in the learning problem which allows us to optimally adapt the model parameters to the observed training data. Suppose we have two sequences of observations from training data: one is from the DAP (VDAP)
and the other is from the DUP (VDU P). These sequences
can be considered emissions produced by the two HMM modeling behaviors: λDAP = {ΠDAP, ADAP, BDAP} and
λDU P = {ΠDU P, ADU P, BDU P}. Using the
expectation-maximization (EM) algorithm [21], two models λDAP
and λDU P are learned from VDAP and VDU P
re-spectively. Indeed, the EM algorithm adjusts the pa-rameters of the given models by maximizing the con-ditional probabilities of the sequences of observations, i.e., λ∗DAP = argmaxλP (VDAP|λDAP) and λ∗DU P =
argmaxλP (VDU P|λDU P).
Secondly, given a new sequence of observations V0, the forward algorithm [21] is used with λDAP and λDU P
to calculate the posterior probabilities P (V0|λDAP) and
P (V0|λDU P). These probabilities presents how well the
models match the given V0 (evaluation problem). Moreover, since nothing is known beforehand, the prior over the model is assumed to be uniform P (λDAP) = P (λDU P) = 0.5.
Finally, for this method of classification, the likelihood ratio P (V0,λDU P) P (V0,λ DAP)= P (V0|λDU P)P (λDU P) P (V0|λ DAP)P (λDAP) = P (V0|λDU P) P (V0|λ DAP) > e τh
is calculated to determine whether the driver is likely to be aware or unaware of pedestrian. The threshold τhis selected
to adjust the performance of the DAP/DUP classification. It is usually computed by using the log probabilities which introduces the e term in the formula. Again, the classification occurs on the observations in a Twsliding time window. The
Fig 2 summarizes this HMM-based architecture.
Figure 2. HMM-based Architecture
IV. EXPERIMENTSDESIGN. A. Protocol.
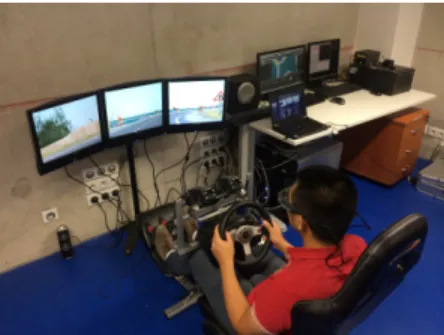
The experiments are conducted on the driving simulator manufactured by Oktal [19]. This simulator is designed to be the most comfortable as possible in order to facilitate various conditions of experiments. The simulator is configured as shown in the Fig. 3. Three 17-inches screens are placed at 1.5 meters in front of the driver with a real steering wheel mounted at a real comfortable position near the driver. The simulator is controlled by the driving engine SCANeR-Studio [19] which enables to create different driving scenarios as well as to record all necessary driving data. Then active drivers (7 men and 3 women) participated to the study during ten days. The mean age of the participants are 24 years (range from 20 to 28). They have at least one year licensed driving and was familiar with the simulator.
In order to limit the complexity of the situations, all scenarios don’t contain other vehicle and only one pedestrian presents in each scene. The ego-vehicle and road parameters such as vehicle weight, size, or others features are fixed
Figure 3. Experimental Platform
to approach real-world conditions. The test track is chosen to be a one-lane main road passing through a village. The maximum speed of the vehicle was limited to 80 km/h to discourage excessive speed. Twenty scenarios of pedestrian on straight road are proposed such as the pedestrian walks on the side walk or on the lane, runs on the sidewalk, crosses the road at the crossing mark (Fig 4) or not at the crossing mark, etc. The scenarios are varied in order to capture as many situation as possible in reality.
Two situations in which the driver was led to be aware or unaware of a pedestrian are proposed. We call them the DAP and the DUP simulations. In the DAP simulation, before each driving, we encourage the driver to avoid as possible as he can the collision with the pedestrian. The message of TTC value and the distance to the pedestrian are displayed through the driving time. Moreover, the driver is asked to press on a button on the steering wheel (on right hand) to indicate he has noticed the pedestrian presence. If the driver doesn’t make collision to pedestrian, he is considered to be DAP. In the DUP simulation, the same scenarios as in the DAP simulation with no message, no pedestrian (more exactly, the pedestrian of the DAP simulation is set to be invisible) are used. The driver is asked to drive normally. If the driver does a collision with the invisible pedestrian, he is considered to be DUP. In order to annotate the DAP and the DUP data, three assumptions are proposed:
1. The driver is aware of the pedestrian when the pedes-trian appears clearly on the center screen, and the driver has pressed on the button.
2. The awareness of pedestrian is a permanent behavior. If the driver is aware of the pedestrian at time t, he is considered to be aware of that pedestrian until he passes by the pedestrian or stops in front of the pedestrian (No collision happens).
3. If the driver is unaware of a pedestrian, he drives and does the same maneuvers on the vehicle like there is no pedestrian on the road (Collision happens in this case). B. Measurement.
The driving actions data are automatically and syn-chronously logged into hard-disk at 20Hz without any fil-tering or smoothing processing. Five driving signals which are used for classification are recorded. The vehicle speed (km/h). The acceleration pedal position which is in [0; 1]. This value is equal to 0 when the driver releases completely
Figure 4. One of the scenario, view on scenario-builder mode - The pedestrian crosses the road at the crossing mark.
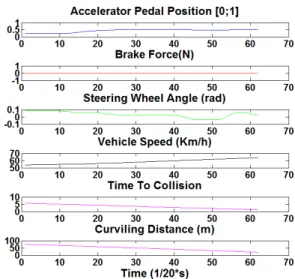
the accelerator pedal. The braking force, which takes value in [0; 400] N ewton (N ). The steering wheel angle, which takes value in [−π, π] radian (rad). And the time-to-collision (T T C), which is in second (s). During each driving time in the DAP simulation, from the instant when the driver presses the button to the instant when the T T C is equal to the T T Cmin, we extract all these driving data. Because of
the different vehicle speed, this period can vary from 3s to 6s (from 60 to 120 value points). The same period of time is used to extract data in the DUP simulation. Recall that, only the driving that makes collision with invisible pedestrian are taken into account for the DUP. In the DAP simulations, we can see some reactions of the driver such as decelerating then braking in front of the pedestrian or turning the steering wheel to avoid the pedestrian and passing by him, etc. For example, in the Fig 5, the driver releases accelerator pedal at 5s of TTC and at 2s of TTC, he begins braking. On the other hand, the DUP simulations showed that none of these reactions occurs (Fig 6).
Figure 5. Awareness Data Sample
V. METHODSETUP
A. Shared Parameter
1) T T Cmin: The choice of the minimum of
Time-To-Collision (T T Cmin) is important because it represents the
amount of time the driver is given to react after being
Figure 6. Unawareness Data Sample
warned that he is unaware of a pedestrian and the situation is dangerous. We make the choice of T T Cmin on the
cumulative human response time distribution presented in [14]. To summarize, the larger T T Cmin, the bigger the
percentage of population to react on time to the warning. But a larger T T Cmin is expected to lead to a worse performance
of the alert system because the final classification would be given earlier and after fewer measurements. To address this problem, the proposed algorithms are developed and evaluated at 1.6s of the T T Cminwhich corresponds to 80%
of the population [14].
2) The Maximum False Positive Rate (FPR): In order to provide a good warning system. The classification is demanded to maximize the number of correctly identification of DUP (True Positive Rate) in minimizing the ratio of badly identification of DAP (False Positive Rate) which annoy the driver. In accordance with automotive industry recommendations, the maximum false positive rate is chosen to be 5% [1]. Moreover, this value of FPR is considered in order to chose the best threshold in each algorithm and to compare the performance between the algorithms.
B. Simple Method Parameters
The first parameter for the TTC-based method is the deceleration reaction threshold that indicates the awareness of pedestrian. This value is chosen at −0.075g in this study. Knowing that, the vehicle deceleration is less than −0.075g represents a brake activation[3]. The second one is the T T Cthparameter. It is a natural choice for controlling
how conservative the classifier should be and thus is used as the score for the ROC curve analysis. The classification outputs T T Cmin in case of there is no deceleration reaction
from the driver.
In the RDP-based method, the only parameter is the RDPth therefore it taken as the score for the ROC curve
with values ranging from 0.05g to 7g. C. HMM-based Method Parameters
There are four key parameters for the HMM-based method: 1) the number of hidden states N ; 2) The number of Gaussian
component M for the emission mixture-distribution B; 3) The Twsliding window size; and 4) the decision threshold
τh. The number of states determines how many different
modes the HMMs can capture, and as a result, the range of behaviors that can be classified accurately. Different numbers of component M are also tested in order to find out the model that best represents the probability distribution of the emission of the observations. However, increasing the number of states or the number of component also increases the complexity of the model and the risk of over fitting the training data. From 8 to 13 hidden states, from 1 to 3 components of are considered, whereas three values of Tw
of 1s, 1.5s and 2s that consist of 20, 30 and 40 observations are tested. All combinations of these parameters were tested in order to find out the best model parameter. The decision threshold τh is found when it maximizes the true positive
at a false positive rate given. The Fig 7 shows the result of the best combinations that produced the highest rates of true positives while maintaining a false positive rate below 5% for the generalization test. Finally, N = 10, M =2, Tw = 1.5s,
and τh= 214 are chosen.
Figure 7. The best combination of HMM-based method parameters
VI. VALIDATION ANDRESULTS
All the methods are developed in Matlab. The HMM-based method is implemented by using PMTK toolkit [17]. Although the HMM method seems a complex technique comparing to the simple methods, most of the computational complexity appears during the training phrase. For online classification of a new sequence of observations, the com-putation time of the testing phase is small. One testing run-time takes an average of 2 ms per sequence on a laptop core i5 2.4Ghz. Here, we just compare the performance of these methods in offline manner.
A. Basic Generalization Test
The first validation is a straightforward test of generaliza-tion. This consists of training the algorithms on a randomly selected subset that is a small fraction p of the data and testing on the remaining 1 − p. This approach demonstrates
the generalization property of the algorithms. The value of p is chosen to be 0.2. The total number of samples used for this approach is 2000 DAP and 1000 DUP. In other words, 400 DAP and 200 DUP samples are used in the training phase, whereas the testing phase consists of 1600 DAP and 800 DUP samples. Finally, the receiver operation characteristic (ROC) curve is used to display the true positive and false positive rates of each set of algorithm parameters [15]. Each point on the ROC curve corresponds to a different threshold parameter of the classification. The choice of threshold for each algorithm is subsequently detailed in its respective section.
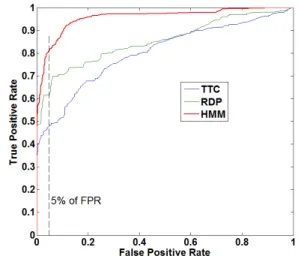
The ROC curves for the three methods (Fig8) show that the HMM-based method outperformed the simple methods. At 5% of false positive rate (truth DAP, response DUP), the HMM-based method can get 81,2% of True Positive Rate (truth DUP, response DUP) whereas the RDP-based method reaches 62% and the TTC-based method does not performed well with 47% of TPR. The RDP-based method can be thought more efficient when it considers the relationship between the deceleration reaction and the time-to-collision whereas the TTC-based method uses only a predefined de-celeration threshold representing the braking activation. As we expected, the HMM-based classifier performed better because it is a rich model that couples observations into states that characterize driver behavior. Moreover that confirms our hypothesis on the time dependencies of the evolution in driver behavior when he is aware of a pedestrian.
Figure 8. ROC curves for three algorithms with insets showing area of interest around 5% false positive.
B. k-Fold Cross Validation
The second validation uses the standard k-fold cross-validation technique for testing generalization. This involves to randomly divide the training set into k disjoints and equally sized parts. All the classification algorithms are trained k times while leaving out, each time, a different set for validation. The advantage of this k-fold cross-validation is that, by cycling through the k parts, all the data training data can be used while retaining the ability to test on a disjoint set of testing data. This validation estimates the performance of
the algorithm in term of its ability to classify any given new input sequence. In this validation, a total of 2500 DAP and 1500 DUP samples are used in the k-fold cross-validation with k = 4. The table of True Positive Rate (TPR) for 5% of False Positive Rate (FPR) of three methods is then given in Tab I. The HMM-based method gives a good performances with 78.2% of good detection (truth DUP, response DUP) at 5% of false detection (truth DAP, response DUP). This test confirms the consistency of this method while classifying a new sequence of observations.
Method TPR(%) TTC-based 42,9% RDP-based 56.5% HMM-based 78.2%
Table I
TPRAT5% FPRFOR EACH METHOD IN4-FOLD CROSS-VALIDATION
VII. CONCLUSION ANDFUTUREWORK
In this study, we proposed a new method to recognize the driver unawareness of pedestrian by observing the driv-ing signals. Two distinct Gaussian-mixture-Hidden Markov Model were build and a decision method based on the likeli-hood ratio threshold was used for classifying the DAP and the DUP. In order to optimize safety in respecting the comfort for the driver, the method was developed to maximize the true positive rates while keeping the false alarm rates below 5%. The experiment on the driving simulator has been conducted with different participants and in different driving scenarios. The collected data was then used to train the classifier and to validate the method. Moreover, two simple methods based on the TTC and RDP are also added in the performance comparison. The results show the superiority of the HMM-based method with the 78% of good recognition, more than 20% comparing to the two simple methods.
In our future work, we will add the driver gaze and head tracking in order to perform a deep analysis of the driver behaviors. We suppose that the correlation between the driver’s gaze direction to pedestrian and his driving reactions is interesting to be analyzed. Furthermore, instead of a binary classification as in this paper, another model will be established to determine the different levels of the DAP. Moreover, we will do another experiments with more realistic scenarios and more participants. A test in real driving conditions using our intelligent vehicle platform is also being considered1.
ACKNOWLEDGMENT
This work was carried out in the framework of the FUI18 SERA project, and the Labex MS2T which is funded by the French Government, through the program " Investments for the future” managed by the National Agency for Research (Reference ANR-11-IDEX-0004-02).
REFERENCES
[1] G.S. Aoude, V.R. Desaraju, L.H. Stephens, and J.P. How. Driver be-havior classification at intersections and validation on large naturalistic data set. Intelligent Transportation Systems, IEEE Transactions on, 13(2):724–736, June 2012.
1Robotex, the national network of robotics platforms http:
//equipex-robotex.fr/
[2] S. Arun, K. Sundaraj, and M. Murugappan. Driver inattention detection methods: A review. In Sustainable Utilization and Development in Engineering and Technology (STUDENT), 2012 IEEE Conference on, pages 1–6, 2012.
[3] Zachary R Doerzaph. Development of a threat assessment algorithm for intersection collision avoidance systems. PhD thesis, Virginia Polytechnic Institute and State University, 2007.
[4] A. Doshi and M.M. Trivedi. Attention estimation by simultaneous observation of viewer and view. In Computer Vision and Pattern Recognition Workshops (CVPRW), 2010 IEEE Computer Society Con-ference on, pages 21–27, 2010.
[5] Anup Doshi and Mohan M. Trivedi. Head and eye gaze dynamics during visual attention shifts in complex environments. Journal of Vision, 12(2), 2012.
[6] M. R. Endsley. Toward a theory of situation awareness in dynamic systems. Human Factors: The Journal of the Human Factors and Ergonomics Society, 37(1):32–64, 1995.
[7] Y. Fukagawa and K. Yamada. Estimating driver awareness of pedestri-ans from driving behavior based on a probabilistic model. In Intelligent Vehicles Symposium (IV), 2013 IEEE, pages 1155–1160, June 2013. [8] V. Gadepally, A. Krishnamurthy, and U. Ozguner. A framework for
es-timating driver decisions near intersections. Intelligent Transportation Systems, IEEE Transactions on, 15(2):637–646, April 2014. [9] T. Gandhi and M.M. Trivedi. Pedestrian protection systems: Issues,
survey, and challenges. Intelligent Transportation Systems, IEEE Transactions on, 8(3):413–430, Sept 2007.
[10] J.C. Hayward, Pennsylvania Transportation, Traffic Safety Center, and National Research Council (U.S.). Highway Research Board. Meeting. Near Miss Determination Through Use of a Scale of Danger. Num-ber 7115 in Report (Pennsylvania Transportation and Traffic Safety Center). Pennsylvania Transportation and Traffic Safety Center, The Pennsylvania State University, 1972.
[11] B. H. Juang and L. R. Rabiner. Hidden markov models for speech recognition. Technometrics, 33(3):251–272, 1991.
[12] Raymond J Kiefer, Jeremy Salinger, and John J Ference. Status of nhtsas rear-end crash prevention research program.
[13] A. Liu and A. Pentland. Towards real-time recognition of driver intentions. In Intelligent Transportation System, 1997. ITSC ’97., IEEE Conference on, pages 236–241, Nov 1997.
[14] Shane B. McLaughlin, Jonathan M. Hankey, and Thomas A. Dingus. A method for evaluating collision avoidance systems using naturalistic driving data. Accident Analysis & Prevention, 40(1):8 – 16, 2008. [15] Don McNicol. A primer of signal detection theory. Psychology Press,
2005.
[16] Mahmood Fathy Mohamad-Hoseyn Sigari and Mohsen Soryani. A driver face monitoring system for fatigue and distraction detection. International Journal of Vehicular Technology, 2013(263983):11, 2013. [17] K. Murphy. Hidden markov model (hmm) toolbox for matlab. Available: http://www.ai.mit.edu/ murphyk/Software/HMM/hmm.html. [18] Vicki Lewis Neale and Catherine C McGhee. Intersection decision
support: evaluation of a violation warning system to mitigate straight crossing path collisions. Technical report, Virginia Transportation Research Council, 2006.
[19] Oktal. Driving simulation engine scaner. http://www.scanersimulation.com.
[20] Minh Tien Phan, Vincent Fremont, Indira Thouvenin, Mohamed Sallak, and Veronique Cherfaoui. Recognizing driver awareness of pedestrian. In Intelligent Transportation Systems (ITSC), 2014 IEEE 17th Inter-national Conference on, pages 1027–1032, Oct 2014.
[21] L. Rabiner. A tutorial on hidden markov models and selected applica-tions in speech recognition. Proceedings of the IEEE, 77(2):257–286, Feb 1989.
[22] T. Starner, A.P. Pentland, Massachusetts Institute of Technology. Me-dia Laboratory. Vision, Modeling Group, and Massachusetts Institute of Technology. Perceptual Computing Section. Visual Recognition of American Sign Language Using Hidden Markov Models. M.I.T. Media Lab Vision and Modeling Group technical report. Perceptual Computing Section, Media Laboratory, Massachusetts Institute of Technology, 1995.
[23] L. Yang, B.K. Widjaja, and R. Prasad. Application of hidden markov models for signature verification. Pattern Recognition, 28(2):161 – 170, 1995.