HAL Id: hal-01386710
https://hal.archives-ouvertes.fr/hal-01386710
Submitted on 26 Oct 2016
HAL is a multi-disciplinary open access
archive for the deposit and dissemination of
sci-entific research documents, whether they are
pub-lished or not. The documents may come from
teaching and research institutions in France or
abroad, or from public or private research centers.
L’archive ouverte pluridisciplinaire HAL, est
destinée au dépôt et à la diffusion de documents
scientifiques de niveau recherche, publiés ou non,
émanant des établissements d’enseignement et de
recherche français ou étrangers, des laboratoires
publics ou privés.
Direct Detection Differential Absorption LIDAR for
Multi-Species Atmospheric Sensing in the 2-µm Range
Erwan Cadiou, Jean-Baptiste Dherbecourt, Dominique Mammez, Guillaume
Gorju, Myriam Raybaut, Jean-Michel Melkonian, Antoine Godard, Jacques
Pelon, Michel Lefebvre
To cite this version:
Erwan Cadiou, Jean-Baptiste Dherbecourt, Dominique Mammez, Guillaume Gorju, Myriam Raybaut,
et al.. Direct Detection Differential Absorption LIDAR for Multi-Species Atmospheric Sensing in the
2-µm Range. Laser Applications to Chemical, Security and Environmental Analysis 2016, Jul 2016,
Heidelberg Germany. �10.1364/LACSEA.2016.LTh1G.5�. �hal-01386710�
COMMUNICATION A CONGRES
Direct detection differential
absorption LIDAR for multi-species
atmospheric sensing in
the 2-µm range
E. Cadiou, J.-B. Dherbecourt, D. Mammez, G. Gorju, M. Raybaut, J.-M. Melkonian, A. Godard
J. Pelon (LATMOS), M. Lefebvre
Imaging and Applied Optics, Optics and Photonics Congress
HEIDELBERG, ALLEMAGNE 25-28 juillet 2016
LTh1G.5.pdf 2016 Imaging and Applied Optics Congress (3D, AO, AIO, COSI, DH, IS, LACSEA, MATH) © OSA 2016
Direct Detection Differential Absorption LIDAR for
Multi-Species Atmospheric Sensing in the 2-µm Range
Erwan Cadiou1,2, Jean-Baptiste Dherbecourt1, Dominique Mammez1,2, Guillaume Gorju1, Myriam Raybaut1, Jean-Michel Melkonian1, Antoine Godard1, Jacques Pelon3, Michel Lefebvre1
1 ONERA, The French Aerospace Lab, Chemin de la Hunière, F-91761 Palaiseau cedex, France 2 CNES, centre de Toulouse, 18 avenue Edouard Belin, F-31401 Toulouse cedex 9, France
3 LATMOS, Université Pierre et Marie Curie, 4 Place Jussieu Paris, France jean-baptiste.dherbecourt@onera.fr
Abstract: A direct detection atmospheric differential absorption lidar, based on a high energy
optical parametric source at 2 µm to address CO2, CH4 and H2O, is presented. We report first
experimental measurements on CO2.
OCIS codes: (280.0280) Remote sensing and sensors; (280.1910) DIAL, differential absorption lidar
1. Introduction
A better knowledge of atmospheric carbon dioxide, methane and water vapor is expected to improve the accuracy of existing models and to help anticipate climate change. In this context, several space-borne lidar missions are foreseen in the upcoming years to measure their concentration at a global scale, including MERLIN (CNES/DLR) for methane and ASCENDS (NASA) for carbon dioxide. The challenge of these instruments is to develop high energy sources which can emit at specific wavelengths to address the gas species of interest. In the 2 µm spectral region, the major greenhouse gases present particularly well-suited absorption lines for space-borne applications which can be efficiently addressed by solid state laser technologies [1,2]. In this paper, we present a direct detection differential absorption lidar (DIAL) based on a high-energy parametric source whose tunability enables to target several species with a single instrument [3]. The system has been operated for ground-based long range measurements by collecting backscattered signal from aerosols and clouds with a direct detection receiver. First experimental concentration measurements have been obtained by targeting the R30 absorption line of CO2 at
2051 nm [2]. Beside the air-borne and space-borne applications, such an instrument could be potentially implemented from ground to calibrate/validate passive or active space-borne gas measurements.
2. Experimental setup
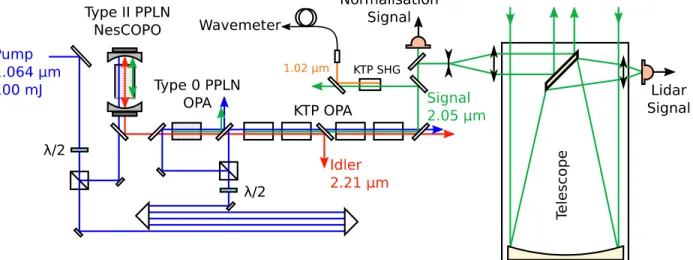
The experimental setup depicted in Fig. 1 comprises a laser transmitter and a receiver telescope. The laser transmitter is based on a nested cavity optical parametric oscillator (NesCOPO), a specific architecture which ensures tunable single frequency emission without any injection seed [3]. It is followed by a high energy two-step optical parametric amplifier (OPA) including a periodically poled lithium niobate (PPLN) crystal and four bulk KTP crystals. The whole system is pumped at 30 Hz by a Nd:YAG Laser delivering 100 mJ energy pulses at 1064 nm. The oscillation buildup time of the NesCOPO is compensated by a 10 ns delay line inserted in the pump beam path
LTh1G.5.pdf 2016 Imaging and Applied Optics Congress (3D, AO, AIO, COSI, DH, IS, LACSEA, MATH) © OSA 2016
before the amplifiers. The emitter delivers 10 ns Fourier-transform limited pulses that are tunable between 1980 nm and 2100 nm. In order to perform the DIAL measurement, the emitted wavelength is switched pulse to pulse. For that purpose, pulse-to-pulse adjustment of the NesCOPO cavity length is carried out by use of piezoelectric transducers. In our lidar experiments, the available pulse energy for the transmitted signal wave in the atmosphere at 2051 nm was around 10 mJ.
In order to monitor the wavelength a small amount of energy is sampled from the output beam by use of a CaF2
plate. It is then frequency doubled using second harmonic generation in a KTP crystal to match with the detection spectral range of a high precision wavemeter (WSU 10 of Hight Finesse operating up to 1.1 µm). A reference detector measures the energy leaked through a high-reflectivity deflecting mirror to normalize the backscattered lidar signal of each pulse and thus correct systematic errors on CO2 concentration estimation caused by energy
fluctuations between the ON and OFF wavelengths. Before transmission in the atmosphere, the divergence of the beam is reduced to 500 µrad with a beam expander.
The lidar receiver consists of a Newton telescope which focuses the backscattered laser radiation on an InGaAs amplified photodiode. To increase the field of view of the telescope a short focal lens is placed in front of the detector. The resulting field of view of 800 µrad is thus adapted to the transmitted laser beam divergence. Emission and reception axes overlap and are oriented at 45° from the vertical, which enables to reach the first layers of clouds. Both lidar and normalization signals are acquired with a 500 MHz sample-rate digitizer. Transmitter and receiver parameters are summarized in Table 1.
Table 1 : Instrument parameters
Transmitter Receiver
Pulse energy 10 mJ Telescope diameter 20 cm
Pulse duration 10 ns Field of view 800 µrad
Repetition rate 30 Hz Detector Type InGaAs PIN
OFF-line wavelength 2050.963 nm Detector diameter 300 µm ON-line wavelength 2051.047 nm Detector NEP 3.10-12 W/√Hz
Linewidth < 60 MHz Bandwidth 30 MHz
Divergence angle 500 µrad Sampling rate 500 MHz
3. Results
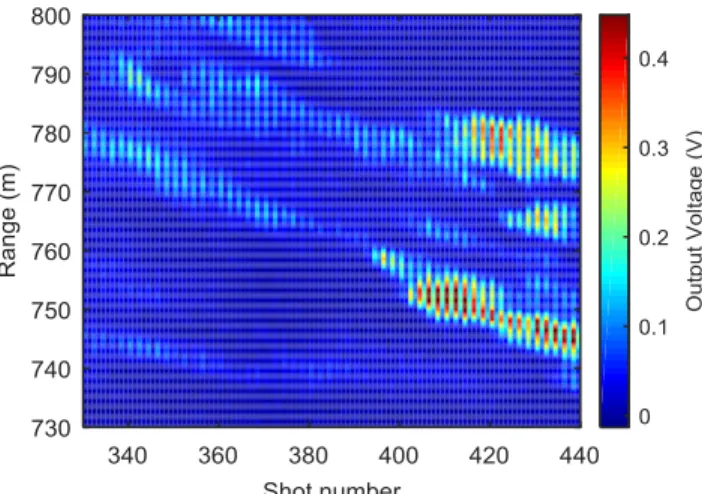
Fig. 2(a) shows the received ON and OFF signals for a 4 minute acquisition time corresponding to the averaging of approximately 3600 couples of ON-OFF shots. The first detected peak comes from the diffusion on the transmitting optics. Aerosol backscattered signal is detected between 50 and 600 meters and cloud echoes are detected between 650 m and 950 m. Acquired traces are averaged and smoothed with a 15 MHz filter equivalent to a 10 meters spatial resolution. The temporal variations of the clouds signals are shown in false colors in Fig. 3. This representation enables to see the spatial coherence of the clouds passing in the line of sight of the lidar, and the periodic backscattered intensity due to pulse-to-pulse ON/OFF wavelength switches.
Fig. 2. (a) OFF-line and ON-line return signals. Averaging over 3600 shots and a 15 MHz numerical filtering have been applied to both signals. (b) Differential optical depths versus range for experimental data and for a theoretical homogeneous mixing ratio of 390 ppm.
LTh1G.5.pdf 2016 Imaging and Applied Optics Congress (3D, AO, AIO, COSI, DH, IS, LACSEA, MATH) © OSA 2016
Fig. 3. Cloud backscattered signals before signal processing. At every shot, the transmitter switches between the OFF and the ON wavelengths. Couples of ON-OFF traces which exceed the digitizer dynamic (red) are not taken into account to retrieve the CO2 concentration.
CO2 cross section has been calculated using a Voigt profile and the Hitran database in order to retrieve the
concentration of CO2. The optical depth derived from the lidar signals is shown in Fig. 1(b). In the clouds, the slope
of the measured optical depth matches a uniform 390 ppm CO2 average mixing ratio with a ± 16 ppm uncertainty.
Further range-resolved experiments are currently carried out in order to validate the accuracy and increase the precision of carbon dioxide profiling across the whole line of sight. Complementary measurements targeting water vapor are also conducted in order to demonstrate the multi species detection ability of the system.
4. Acknowledgements
This work is partially supported by the CNES Research and Technology program.
5. References
[1] T. F. Refaat, U. N. Singh, M. Petros, R. Remus, and J. Yu, “Self-calibration and laser energy monitor validations for a double-pulsed 2-μm CO2 integrated path differential absorption lidar application,” Appl. Opt. 54, 7240–7251 (2015).
[2] G. Ehret, C. Kiemle, M. Wirth, A. Amediek, A. Fix, and S. Houweling, “Space-borne remote sensing of CO2, CH4, and N2O by integrated
path differential absorption lidar: a sensitivity analysis,” Appl. Phys. B 90, 593–608 (2008).
[3] J. Barrientos Barria, D. Mammez, E. Cadiou, J.-B. Dherbecourt, M. Raybaut, T. Schmid, A. Bresson, J.-M. Melkonian, A. Godard, J. Pelon, and M. Lefebvre, “Multispecies high-energy emitter for CO2, CH4, and H2O monitoring in the 2 μm range,” Opt. Lett., 39, 6719–6722


