Publisher’s version / Version de l'éditeur:
Vous avez des questions? Nous pouvons vous aider. Pour communiquer directement avec un auteur, consultez la première page de la revue dans laquelle son article a été publié afin de trouver ses coordonnées. Si vous n’arrivez pas à les repérer, communiquez avec nous à [email protected].
Questions? Contact the NRC Publications Archive team at
[email protected]. If you wish to email the authors directly, please see the first page of the publication for their contact information.
https://publications-cnrc.canada.ca/fra/droits
L’accès à ce site Web et l’utilisation de son contenu sont assujettis aux conditions présentées dans le site
LISEZ CES CONDITIONS ATTENTIVEMENT AVANT D’UTILISER CE SITE WEB.
Energies, 14, 9, 2021-04-28
READ THESE TERMS AND CONDITIONS CAREFULLY BEFORE USING THIS WEBSITE. https://nrc-publications.canada.ca/eng/copyright
NRC Publications Archive Record / Notice des Archives des publications du CNRC :
https://nrc-publications.canada.ca/eng/view/object/?id=3417982b-74e8-4203-b15f-bd86949afc34
https://publications-cnrc.canada.ca/fra/voir/objet/?id=3417982b-74e8-4203-b15f-bd86949afc34
Archives des publications du CNRC
This publication could be one of several versions: author’s original, accepted manuscript or the publisher’s version. / La version de cette publication peut être l’une des suivantes : la version prépublication de l’auteur, la version acceptée du manuscrit ou la version de l’éditeur.
For the publisher’s version, please access the DOI link below./ Pour consulter la version de l’éditeur, utilisez le lien DOI ci-dessous.
https://doi.org/10.3390/en14092530
Access and use of this website and the material on it are subject to the Terms and Conditions set forth at
Coordinated control strategy and validation of vehicle-to-grid for
frequency control
Article
Coordinated Control Strategy and Validation of
Vehicle‐to‐Grid for Frequency Control
Yeong Yoo 1,*, Yousef Al‐Shawesh 2 and Alain Tchagang 3
1 Energy, Mining and Environment Research Centre, National Research Council Canada, 1200 Montréal Road, M‐12, Ottawa, ON K1A 0R6, Canada 2 Faculty of Engineering and Applied Science, Ontario Tech University, 2000 Simcoe Street N., Oshawa, ON LlG 0C5, Canada; [email protected] 3 Digital Technologies Research Centre, National Research Council Canada, 1200 Montréal Road, M‐50, Ottawa, ON K1A 0R6, Canada; alain.tchagang@nrc‐cnrc.gc.ca * Correspondence: yeong.yoo@nrc‐cnrc.gc.ca; Tel.: +1‐613‐993‐5331 Abstract: The increased penetration of renewable energy sources (RES) and electric vehicles (EVs) is resulting in significant challenges to the stability, reliability, and resiliency of the electrical grid due to the intermittency nature of RES and uncertainty of charging demands of EVs. There is a potential for significant economic returns to use vehicle‐to‐grid (V2G) technology for peak load reduction and frequency control. To verify the effectiveness of the V2G‐based frequency control in a microgrid, modeling and simulations of single‐ and multi‐vehicle‐based primary and secondary frequency controls were conducted to utilize the integrated components at the Canadian Centre for Housing Technology (CCHT)‐V2G testing facility by using MATLAB/Simulink. A single‐vehicle‐ based model was validated by comparing empirical testing and simulations of primary and secondary frequency controls. The validated conceptual model was then applied for dynamic phasor simulations of multi‐vehicle‐based frequency control with a proposed coordinated control algorithm for improving frequency stability and facilitating renewables integration with V2G‐ capable EVs in a microgrid. This proposed model includes a decentralized coordinated control of the state of charge (SOC) and charging schedule for five aggregated EVs with different departure times and SOC management profiles preferred by EV drivers. The simulation results showed that the fleet of 5 EVs in V2B/V2G could effectively reduce frequency deviation in a microgrid.
Keywords: coordinated control; vehicle‐to‐grid; primary frequency control; secondary frequency
control; state of charge; decentralized; Simulink model; microgrid
1. Introduction
The increased penetration of renewable energy sources (RES) and electric vehicles (EVs) has led to significant challenges to the stability, reliability, and resiliency of the electrical grid due to the intermittency nature of RES and uncertainty of charging demands of EVs. It is expected that 54% of new car sales and 33% of the global car fleet will be electric by 2040 [1]. Such a large‐scale integration of EVs into power grids poses risks to the grid safety and power quality, especially when EVs are uncontrollably charged at peak demand. Vehicle grid integration (VGI) can play an important role in resolving several issues. For example, a mobile distributed energy storage system can be resolved by the operation of the power grid while minimizing the electricity infrastructure upgrading cost. The energy stored in electric vehicles (EVs) would be made available to homes, buildings, and the electrical grid to actively manage energy consumption and costs, known as vehicle grid integration (VGI) or vehicle‐to‐X (V2X) (where X = home (H), building (B), or grid (G)) technologies. Vehicle‐to‐home/grid (V2H/V2G) or vehicle‐to‐ building/grid (V2B/V2G) has the potential to provide a storage capacity for the benefit of Citation: Yoo, Y.; Al‐Shawesh, Y.; Tchagang, A. Coordinated Control Strategy and Validation of Vehicle‐ to‐Grid for Frequency Control. Energies 2021, 14, 2530. https://doi.org/10.3390/en14092530 Academic Editor: Manuela Sechilariu Received: 9 March 2021 Accepted: 23 April 2021 Published: 28 April 2021
Publisher’s Note: MDPI stays neutral with regard to jurisdictional claims in published maps and institutional affiliations.
Copyright: © 2021 by the authors. Licensee MDPI, Basel, Switzerland. This article is an open access article distributed under the terms and conditions of the Creative Commons Attribution (CC BY) license (http://creativecommons.org/licenses /by/4.0/).
owners of EVs and homes/buildings, aggregators, and utilities by reducing EV cost and home/building energy cost, and enhancing grid reliability and resilience [2].
Previous studies [3–6] have shown that there is potential for significant economic returns to use vehicle‐to‐grid (V2G) technology for peak load reduction and frequency control. The daily electricity bill of an industrial building or a commercial unit is the summation of energy charge and peak demand charge. The peak demand charge is based on the maximum power consumption, and it is calculated from a running average of power consumption over 15 or 30 min. Peak demand charges can significantly increase the electricity bill. Smoothing these peak demands represents one of the best approaches to reducing electricity costs. Each EV has a mobile battery energy storage system (MBESS), which can be connected to the electricity grid via a fast bidirectional charger installed in locations, such as commercial buildings parking lots. The MBESS can discharge energy to the grid when it is connected, and electrical demand is high, and charge at other times to smooth the building’s energy consumption profiles [7]. Since frequency is one of the most important indexes of power system stability, the MBESS in EV can also be used for frequency regulation as a tool employed by power grid operators. They can be used for maintaining the balance between supply and demand of active power in cases when the system frequency has deviated from its nominal value (50 or 60 Hz) [8]. When supply exceeds demand, the grid frequency increases; when demand exceeds supply, the grid frequency decreases [9]. When over‐frequency or under‐ frequency events happen, the recovery of the system frequency to its nominal value involves three phases, which are collectively known as “frequency control”. These include the primary frequency control (PFC), secondary frequency control (SFC), and tertiary frequency control (TFC), and these three phases are triggered within the first few seconds, within tens of seconds, and within a few minutes, respectively after the events [8].
V2G‐capable EV chargers can provide PFC because of their fast response and seamless bidirectional power flow capabilities. This means they cannot only draw energy from the grid to charge EV batteries, but they could also provide power back to a high voltage grid or an islanded low voltage microgrid as energy becomes available and the V2G controller is enabled. Since the electric power from a single EV is too weak to provide frequency control, a small or large fleet of EVs should be aggregated to act as a virtual power plant [10,11]. SFC or load frequency control (LFC), which is also a part of the automatic control system and the PFC, can also be provided by V2G‐capable EVs. PFC is to bring a deviated frequency back to an acceptable value in the short‐term, leaving a frequency error due to a proportional droop control, but SFC or LFC is to compensate for the remaining frequency error after providing the PFC [10]. For V2X applications, the charging and discharging of EV batteries can be achieved through bidirectional AC onboard or DC off‐board chargers. The impact of bidirectional charging on the electrical grid should be investigated in detail to identify the technical issues of grid connection and interactions of EVs, determine its interoperability with the grid, and develop optimized control algorithms and strategies that can be validated by simulation. Recently, various vehicle‐to‐grid (V2G) control strategies have been proposed in the literature [12–15] for both PFC and SFC. In [12], a simple frequency control droop loop with a dead‐band function was adopted to adjust the active power set‐points of a smart EV charging interface that responds locally to frequency changes. In [13], an adaptive decentralized V2G control strategy was proposed to simultaneously control the EV charging schedule and system frequency. The droop coefficient was adjusted according to the frequency deviation and the state of charge (SOC) of EV batteries. In [14], an aggregate model of EV fleets with a participation factor was proposed to evaluate the dynamic response in PFC, incorporate EV’s technical constraints flexibly, and reduce computational complexity based on an average technique. The participation factor was proposed to identify the participation of each EV in PFC according to EV’s operating modes of disconnected, charging, or idle. In [15], a state‐of‐the‐art V2G control strategy,
consisting of frequency droop control and scheduled charging, was proposed to simultaneously suppress frequency fluctuation and satisfy the charging demands of EV drivers in frequency regulation. However, none of the control strategies simultaneously reflected more detailed preferences of EV drivers and potential prevention of unnecessary EV battery degradation in the practical V2G operation, including the departure time, maximum allowable C‐rate for charging and discharging of EV batteries, maximum usable EV battery energy capacity, initial and end SOCs, and upper and lower SOC limits. Therefore, it is required to develop an intelligent optimal control algorithm for coordinated control of SOC and charging schedule of aggregated EVs with different departure times, allowable ranges of C‐rate and EV battery capacity, and SOC management profiles. In addition, most of the simulation validation of these V2G control studies was based on a frequency‐domain two‐area power system with a transient response stability analysis. Its frequency simulation was characterized only by a sudden change in load or circuit condition. There is a lack of dynamic analysis, which is dependent on the oscillation characteristics of generating units under continuous small disturbances that occur due to random fluctuations in loads and generation levels, to examine the system stability, particularly of the grid frequency on a timescale of several hours.
This paper presents a demonstration and validation of PFC and SFC with a V2G‐ capable Nissan leaf EV using a commercially available supervisory control and data acquisition (SCADA) and MATLAB/Simulink, based on droop characteristics designed for PFC and the dispatch of area control error (ACE) signals for SFC at a V2G testing facility of the National Research Council Canada (NRC). The simulation models derived, implemented, and described in this paper are based on time‐domain dynamic analysis using the phasor modeling technique. Then, model‐based simulations of PFC and SFC with an intelligent optimal control algorithm, including a coordinated control of the SOC and charging schedule for five aggregated EVs with different departure times and SOC management profiles, are presented to validate the effectiveness of frequency control using the integrated fleet of V2G‐capable EVs and to verify its relevant technical issues. 2. Methodology
2.1. Vehicle‐to‐Grid (V2G) Testing Facility
The framework of the V2G experimental operation for this study was conducted using the V2G testing facility located at the Canadian Centre for Housing Technology (CCHT) within the Montreal Road Campus in Ottawa, ON, Canada. Power system components, such as a 10 kW bidirectional off‐board EV DC fast charger (DCFC), a V2G‐ capable Nissan Leaf EV, a 15 kVA grid simulator, two 4.5 kW AC/DC electronic loads, and a 5 kW PV simulator combined with a 5 kW grid‐tied micro‐inverter, were integrated at the CCHT and controlled and monitored by SCADA. A commercially available supervisory control software, InduSoft Web Studio, was utilized for operating these components through Modbus, Ethernet, RS‐232, and GPIB communication protocols. Schneider Electric’s Wonderware InduSoft Web Studio® is a powerful collection of
automation tools that provide all the automation building blocks to develop human– machine interfaces (HMIs), SCADA systems, and embedded instrumentation solutions [16]. However, the utilized SCADA has a limited time interval for communication and data collection in the range of one to a few seconds.
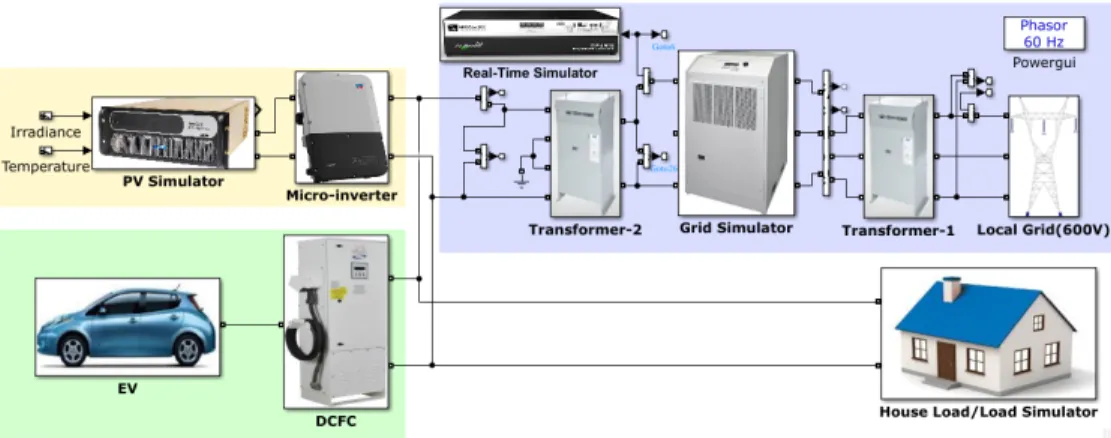
To perform the real time‐based simulation and validation of the dynamic performance and steady‐state operation of the integrated system components under the real electrical grid environments, a real‐time simulator connected to the grid simulator as an amplifier and the integrated system components were installed, as shown in Figure 1. This integration enabled performing software‐in‐the‐loop (SIL), hardware‐in‐the‐loop (HIL), and power hardware‐in‐the‐loop (PHIL) simulations.
Figure 1. An integrated validation system based on power hardware‒in‒the‒loop (PHIL) simulation for Vehicle‒to‒Grid (V2G) and microgrid at the Canadian Centre for Housing Technology (CCHT)‒V2G testing facility. 2.2. Primary Frequency Control (PFC) The PFC is provided by fast‐reacting conventional generating units by increasing or decreasing their power production depending on detecting under‐frequency or over‐ frequency on the grid. The PFC of EVs is a decentralized V2G control that directly responds to the system frequency deviation [17]. This PFC test requires using a grid simulator (MX‐15, Ametek, Berwyn, PA, USA), a power analyzer (WT332E, Yokogawa, Tokyo, Japan), DCFC, EV, and SCADA, as well as droop characteristics to control the bidirectional power flow based on the deviations from the nominal frequency of 60 Hz. The local grid frequency was measured by the power analyzer connected to the output of the grid simulator. The frequency data detected were transferred to SCADA through Ethernet for controlling the bidirectional power flow of DCFC.
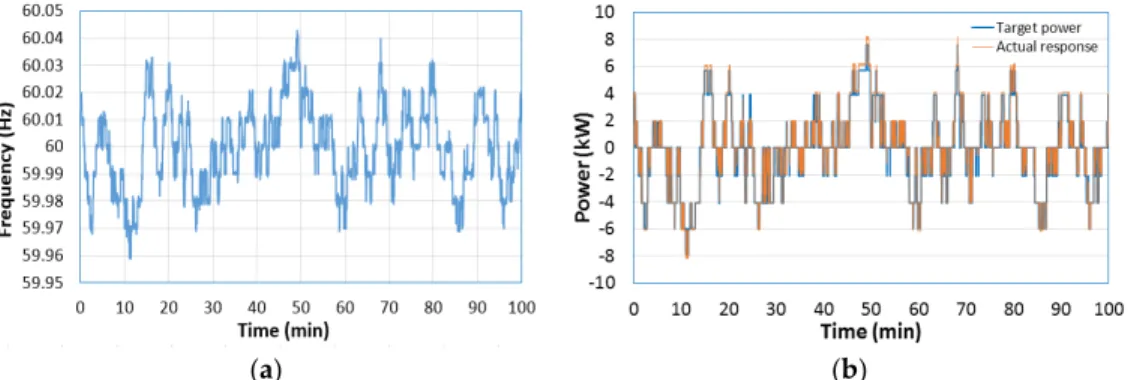
This PFC test was successfully conducted by utilizing real grid frequency data collected from the input grid at the NRC campus on 15 May 2018, at 08:30 for 100 min, as shown in Figure 2a. The frequency data collected from the NRC campus was rounded as input values to the grid simulator for PFC simulation testing, as shown in Figure 2b. Figure 3 below shows a histogram of the frequency data plotted with the Gaussian distribution, a normal distribution as a type of continuous probability distribution. The normal distribution function has a median value of 60.005 Hz and a standard deviation of 0.015297 Hz.
The grid simulator generated the rounded frequency data in AC mains, as shown in Figure 2b and its output frequency data. They were collected by the power analyzer connected to the grid simulator. The power analyzer transferred the output frequency data to a supervisory computer through Ethernet for controlling the bidirectional power flow of DCFC based on a droop characteristic designed for grid simulation purposes at the CCHT‐V2G testing facility, as shown in Figure 4. The typical droop setting (R) for the existing conventional generator fleet is less than 3–5%, with a dead‐band of ±16.67 mHz [18]. In this study, a specific droop setting with 0.083% (R = (0.05 Hz/60 Hz) × 100%), a dead‐band of ±10 mHz, and a constant droop coefficient Kp of 200 kW/Hz were designed
and used for testing and simulating the primary frequency control of the integrated V2G validation system because the range of frequency deviation from 60 Hz at the input grid of the NRC campus was less than ±50 mHz, as shown in Figure 2a. (a) (b) Figure 2. Frequency data (a) collected from the input grid at the NRC campus at 08:30 for 100 min on 15 May 2018, and (b) rounded as for the inputs to the grid simulator for primary frequency control (PFC) simulation testing. Figure 3. Histogram of frequency data collected from the input grid at the NRC campus at 08:30 for 100 min on 15 May 2018. Figure 4. Droop‐control characteristic designed for grid simulation on primary frequency control using V2G at the NRC‒CCHT. 2.3. Secondary Frequency Control (SFC) The SFC, also known as the secondary frequency regulation (SFR) or load frequency control (LFC), is also a part of the automatic control system together with the PFC. The purpose of the PFC is to bring the frequency back to acceptable values in the short term, leaving a frequency error due to the fully proportional control law. On the other hand, the SFC is employed to compensate for the remaining frequency error after the primary
control has acted and to ensure the same frequency levels between interconnected systems [10]. The PFC is a deviating type of regulation as it can only moderate the change in the grid frequency and cannot make the frequency return to the nominal value. However, the SFC is a non‐deviating adjustment and can further reduce the requirements of the controllable power supply capacity of a microgrid and reduce the dynamic frequency deviation [19]. The SFR of EVs is a dispatched‐based V2G control for which the charging/discharging power of EVs is determined based on the regulation signal from the control centre [17].
In this study, a 2 h average standard deviation signal as a part of the frequency regulation duty‐cycle signal in a Sandia National Lab’s report (SAND2013‐7315P [20]) was chosen and used for testing and simulating the SFC at the CCHT‐V2G facility, as shown in Figure 5. The duty cycle was determined by analyzing the PJM balancing signal between 1 April 2011 and 31 March 2012 [21].
Figure 5. Normalized 2 h average standard deviation signal as a part of the 24 h frequency
regulation duty cycle determined by Sandia National Laboratories [20].
3. Modeling, Simulation, and Validation
To verify the effectiveness of the proposed coordinated control strategy for V2G‐ based frequency control in a microgrid or V2B/V2G application, modeling and simulations of single‐ and multi‐vehicle‐based primary and secondary frequency controls are conducted to utilize the integrated validation system components at the CCHT‐V2G testing facility in the MATLAB/Simulink software environment. A single‐vehicle‐based model with a simplified V2G control method is presented for PFC and SFC in V2H/V2G application. This time‐domain phasor model is validated by comparing the empirical testing and simulation results. After validating the conceptual models of the integrated system components, Simulink‐based dynamic phasor simulations of multi‐vehicle‐based frequency control with the proposed coordinated control algorithm are performed to validate the improvement of the frequency stability and to facilitate renewables integration with V2G in a microgrid or V2B application as a virtual power plant (VPP).
3.1. Single‐Vehicle‐based Vehicle‐to‐Grid (V2G)
As shown in Figure 6, a simplified single‐vehicle V2H/V2G model based on the integrated EV and power system components at NRC’s CCHT‐V2G testing facility was designed to conduct PFC and SFC dynamic simulations with and without solar PV and house loads on MATLAB/Simulink. The comparison of power outputs resulting from the empirical testing and simulation was conducted to validate the effectiveness of the simulation model. The single vehicle‐based model consists of four sub‐models, including control for power quality and bidirectional power flow, PV renewables, DCFC/EV, and house loads.
Figure 6. Simulink model of single‐vehicle‐based vehicle‐to‐home/grid (V2H/V2G).
3.1.1. Simulated Profiles of Photovoltaic (PV) Renewables and House Loads
Both rooftop solar PV panels and PV simulators were installed and operated at NRC’s CCHT‐V2G testing facility. For this simulation, daily PV predictive profiles were generated by using machine learning based on PV datasets collected from the existing PV panels on the roof of the CCHT InfoCentre facility in 2011–2012. A maximum power point tracker (MPPT) connected to the PV panels comprising of 14 thin‐film amorphous silicon laminated modules can produce the maximum power of 2 kW. 15 May 2012, a sunny day, was selected as a sample day for this predictive PV profile, as shown in Figure 7. For this prediction, a neural network (NN) with one hidden layer and 6 neurons was utilized. The neural network has 6 inputs, including temperature, irradiance, PV power at time t − 1, day of the month, hour, and minute. Its output is PV power at time t. The PV historic datasets were manually divided into two subsets: 93% of the data for the training set and the remaining 7% for the testing set. Any missing historic data on the day was included in the testing/prediction set. Bayesian regularization algorithm was employed to predict a PV profile to be generated on the sunny day selected as the sample. The highest peak of PV power of 2.3 kW shown at around 15:00 in the measured profile seems to be an error in the monitoring device. ML‐based prediction smoothed the erroneous peak, as shown in Figure 7b.
Figure 8 shows the simulated load profile based on average weekday load profiles at the CCHT facility. The energy consumption rate is 5 kWh per day, and the maximum allowable load is 1 kW at the facility. However, to observe clear bidirectional power flow from the grid in the single EV model‐based simulation, the house load level was intentionally increased to 10 kWh energy consumption per day and 2 kW maximum load. In the real scenarios, V2H/V2G includes various additional usage of bidirectional power flow from EV batteries, such as PV smoothing, peak shaving, and emergency back‐up; however, this simulation work mainly focuses on frequency control during the day time.
(a) (b) Figure 7. (a) Simulation result of a neural network with one hidden layer and 6 neurons and (b) machine learning (ML)— based prediction of photovoltaic (PV) power generation profile for 24 h on 15 May 2012, at the CCHT facility in Ottawa, ON, Canada. Figure 8. Simulated house load profile (24 h). 3.1.2. Primary and Secondary Frequency Control
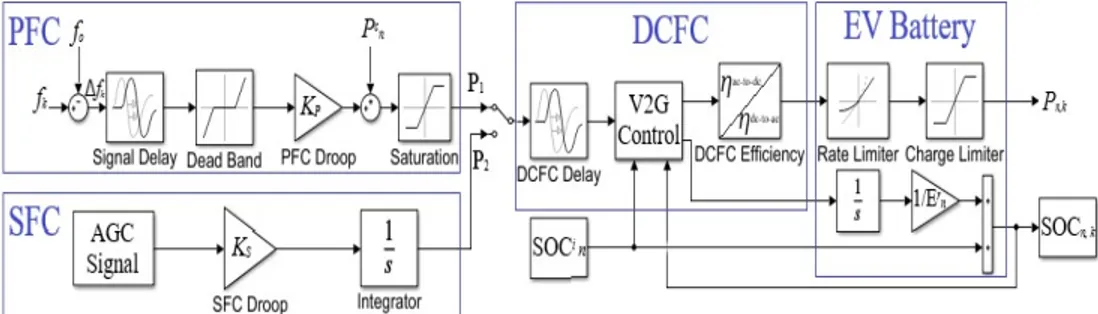
Figure 9 shows a combined primary and secondary frequency control droop loop adopted to adjust the active power set‐point of the EV battery storage for single‐ and multi‐vehicle‐based V2G simulation in this work [10,13]. The PFC is based on an open‐ loop where the dead‐band block is added to the frequency deviation signal to reduce the charging/discharging operations of EV batteries. When the system frequency deviation is out of the predefined dead‐band, the power is exchanged between the EV and the power grid to suppress the frequency fluctuation. Then, the resulting signal is multiplied by the PFC droop constant KP followed by a saturation block with upper and lower values to limit the bidirectional power according to the designed droop characteristics described in Section 2.2. Constant charging power is also added to the PFC loop to achieve the scheduled charging to reach the SOC set‐point desired by the EV driver during the plug‐ in period. Once frequency deviation is out of the dead‐band, both scheduled charging power and PFC droop control are applied for V2G simulation. On the other hand, the SFC uses normalized standard deviation signals without any droop control characteristic designed for grid simulation, as described in Section 2.3.
Figure 9. Combined primary and secondary frequency control droop loop and electric vehicle
(EV) battery model.
The power conversion efficiencies of an off‐board DCFC between AC and DC are practically varied as a function of power levels, but in this work, 92% and 95% were applied as for AC‐to‐DC and DC‐to‐AC power conversion efficiencies, respectively, for the simplified simulation. In addition, 99% and 100% were used for the energy conversion efficiencies of the Li‐ion EV batteries for charging and discharging steps, respectively, in this simulation.
The EV frequency control consists of four blocks, including primary frequency control, secondary frequency control, DCFC, and EV batteries. The droop control in the PFC and SFC blocks was utilized for estimating DCFC target power values converted from grid frequency deviation in PFC and normalized automatic gain control (AGC) signals in SFC. Time delay blocks are used in PFC and DCFC models to simulate the latency in transferring the frequency and power signals. The EV battery model also includes rate and charge limiter blocks to restrict the maximum allowable rate and amount of active bidirectional power flow.
The V2G control of the DCFC and EV battery blocks includes the control of bidirectional power flow and the adjustment of SOC, as shown in Equation (1):
SOCn,k = SOCin + (1/Ern) × ΔEn (1)
3.2. Multi‐Vehicle‐Based V2G
3.2.1. Models
Figure 10 shows a multi‐vehicle V2B/V2G model developed based on the intelligent optimal control algorithm, including a coordinated control of the state of charge (SOC) and charging schedule for five aggregated EVs with different departure times and SOC management profiles. It was assumed that a commercial building would have a daily electricity consumption of 50 kWh and a maximum load of 20 kW. 5 EVs with an EV battery energy capacity in the range of 24~40 kWh are individually connected to bidirectional off‐board DCFCs with a power rating of 10~60 kW. It is expected that bidirectional onboard chargers can be introduced in the EV markets soon. For this multi‐ vehicle‐based V2B/V2G simulation on the above‐mentioned commercial building, it was also assumed that the maximum renewable power of 20 kW would be produced from PV panels on the roof of the building or a PV tracker in the parking lot. The multi‐vehicle‐ based model consists of four sub‐models, including control for power quality and bidirectional power flow, PV renewables, EVs/DCFCs, and building loads.
Figure 10. Simulink model of multi‒vehicle‒based vehicle‒to‒building/grid (V2B/V2G).
3.2.2. Coordinated Control Strategy and Algorithm
One of the most challenging aspects of the control of power flow from integrated system components in V2B/V2G is to reflect the preferences of EV drivers, such as the departure time, maximum allowable C‐rate for charging and discharging of EV batteries, maximum usable EV battery energy capacity, and initial and end SOCs during V2B/V2G operations. Therefore, it is required to develop an intelligent optimal control algorithm for coordinated control of SOC and charging schedule of aggregated EVs with different departure time and SOC management profiles. Table 1 shows detailed V2B/V2G operational conditions and schedule of 5EVs based on the assumed preferences of EV drivers. Each EV driver has his or her own preferred conditions. The aggregator or building energy system operator may have their own guidance on V2B/V2G operations; however, this simulation study utilizes EV driver’s preferences. The maximum C‐rate options depend on the power rating of DCFC available in the building or V2G service zone. The specified operational conditions include 7 input parameters, such as the initial SOC, end SOC, ΔSOC, departure time, EV battery energy capacity, maximum C‐rate allowable, and maximum usable charging/discharging battery energy capacity. To prevent unnecessary battery degradation during V2B/V2G operations, the upper and lower limits of SOC with 90% and 30%, respectively, were applied for this simulation regardless of input parameters.
Table 1. Vehicle‒to‒building/grid (V2B/V2G) operational conditions and schedule of 5 electric vehicles (EVs) based on the
preferences of EV drivers.
No Conditions EV‐1 EV‐2 EV‐3 EV‐4 EV‐5 Remarks
1 Initial SOC (%) 40 80 50 90 70 ‐ When EV is connected to DCFC 2 End SOC (%) 60 80 80 70 60 ‐ Specified by EV driver for departure 3 ΔSOC 20 0 30 ‐20 ‐10 ‐ End SOC (SOCe) minus Initial SOC (SOCi) 4 Departure time 15:00 16:00 18:00 17:00 16:00 ‐ Specified by EV driver 5 EV battery energy capacity (kWh) 24 30 40 24 30 ‐ Depending on EV model‐year 6 Max. C‐rate allowable 0.5 2.0 1.0 0.5 0.8 ‐ Permitted by EV driver ‐ Options 1/2/3/4: 0.5/0.8/1.0/2.0C 7 Max. usable charging/discharging battery energy capacity (kWh) 10 15 15 10 15 ‐ Specified by EV driver for PFC/SFC Figure 11 shows a flowchart of the coordinated control algorithm proposed for multi‐ vehicle‐based V2B/V2G operations. Initially, monitoring devices installed in the microgrid are checking if the coordinated control strategy mode is activated to perform V2G. If V2G is deactivated or there is any fault occurring in the system, then this disturbance must be eliminated first by the existing resources in the microgrid without any frequency regulation, which may unbalance the microgrid. However, if V2G mode is active, then this control algorithm estimates the energy capacity required for the PFC and SFC before participating in ancillary services and automatically receives the power adjustment instructions from the decentralized controller based on the feedback information of
various parameters, such as the initial SOC, end SOC, ΔSOC, departure time, EV battery energy capacity, maximum C‐rate allowable, maximum usable charging/discharging battery energy capacity, and the plug‐in‐state of EVs. Then this control algorithm determines the current SOC of EV batteries and predicts an EV charging schedule based on the informed various parameters. This process enables selecting an EV operational mode between frequency control and EV charging/discharging for departure. Frequency measurement in the grid is continuously performed to determine frequency deviations during the EV’s plug‐in period. Figure 11. Coordinated control algorithm for frequency control. The electrical energy production from PV renewables, the energy consumption for building loads, and bidirectional power flow for frequency control as a function of time can be estimated at the initial step based on predicted and simulated profiles of PV, load, and primary/secondary frequency control. In this simulation, it was assumed that the EV operational time for frequency control would be maximized to benefit the building energy system operator. The latest time to start charging EVs using PV renewables and/or grid power for preparing EV departure can be determined by energy capacities estimated for PV/loads/frequency control and operational conditions preferred by EV drivers. The maximum C‐rate allowable for charging each EV using PV and/or grid power depends on the specifications of DCFC connected and the EV driver’s preferences.
4. Results and Discussion
4.1. Experimental Frequency Control Testing and Simulation on Single‐Vehicle‐Based Frequency Control
Figure 12a shows frequencies produced by the grid simulator in AC mains at the CCHT and monitored by the power analyzer. The output frequencies measured by the power analyzer are transferred to the supervisory computer through Ethernet for controlling the bidirectional power flow of DCFC/EV based on the droop characteristic designed for grid simulation purposes at the CCHT‐V2G testing facility, as shown in Figure 4. In addition, input frequencies rounded for the grid simulator are identical to output frequencies generated, as shown in Figures 2b and 12a.
Figure 12b shows the droop control‐based AC target power for DCFC/EV and AC output actual power responding from DCFC/EV for primary frequency control at the CCHT‐V2G facility. The positive and negative values in Figure 12b indicate power flow for charging and discharging, respectively. There is a very small discrepancy between the target power and actual response under the charging power of 5 kW, whereas the discrepancy increases over 5 kW; therefore, it seems that target values in the utilized DCFC are slightly less accurate for charging power control when over the range of 5 kW than those for discharging power control.
(a) (b)
Figure 12. (a) Frequencies produced by grid simulator in AC mains and monitored by power analyzer and (b) droop
control‐based AC target power for DCFC/EV and AC output actual power responding from DCFC/EV (positive: charging, negative: discharging) for PFC at the CCHT‐V2G facility.
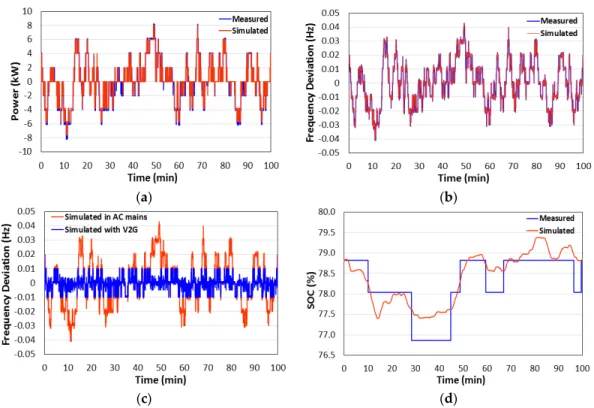
Empirical measurements and Simulink‐based simulation on AC output from DCFC/EV, frequency deviation, and SOC variation for PFC using grid input data, droop characteristics, and response from DCFC/EV were conducted in single‐vehicle‐based V2H/V2G, as shown in Figure 13. Various profiles resulting from the empirical testing and the single‐vehicle‐based Simulink model are compared to verify the effectiveness of the Simulink model built for single‐vehicle‐based V2H/V2G. The empirical and simulated profiles on AC output from DCFC/EV, frequency deviation, and SOC variation in Figure 13 are well‐matched, indicating that the proposed simulation model can be used to verify electrical interactions among the integrated power system components and further for the multi‐vehicle‐based V2G simulation.
Figure 13c compares frequency deviation simulated in AC mains with or without bidirectional power flow provided by DCFC/EV in PFC operation. To simulate the frequency deviation variation with V2G power flow in the AC mains, it was assumed that the frequency deviation would be increased or decreased by discharging or charging EV batteries via DCFC based on the following Equations (2)–(5):
PCH or PDISCH = ΔfPFC × KP (2)
if 0.01 Hz ≥ ΔfPFC ≥ −0.01 Hz, ΔfV2G = ΔfPFC (4)
if ΔfPFC < −0.01 Hz, ΔfV2G = ΔfPFC + (PDISCH/KP) (5)
where ΔfPFC = frequency deviation (Hz) simulated in AC mains for PFC operation without
V2G power flow, ΔfV2G = frequency deviation (Hz) simulated with V2G power flow, PCH =
AC power input (kW) for charging DCFC/EV, PDISCH = AC power output (kW) from
DCFC/EV during discharging, and KP = PFC droop gain (kW/Hz), that is 200 kW/Hz.
As shown in Figure 13c, by introducing V2G power flow from DCFC/EV in AC mains, the resulting frequency deviation would be effectively reduced; however, this simulation was conducted based on the above‐mentioned assumption to utilize the droop characteristic designed for the CCHT‐V2G facility. The real frequency deviation reduction depends primarily on the electrical capacities of integrated power system components and the droop gain chosen for the designed droop characteristic. As shown in Figure 13d, the variation of SOC values was automatically monitored and collected by using both SCADA and DCFC for 100 min. The SOC change of a real EV battery pack in the empirical charging or discharging step is slower than that in the simulation because it takes time to reach an electrochemical equilibrium state in a high‐ capacity battery pack. In addition, SOC percentages in the utilized DCFC are monitored in rough and irregular steps, such as 76.8%, 78.0%, 78.8%, and 80.0%. However, the simulated SOC profile obtained from the Simulink model reflects instantaneous energy variations based on the theoretical energy capacity change with rapid charging and discharging power fluctuation and much smaller time steps in the simulation. The initial SOCs for the empirical PFC testing and its simulation were equally set to 78.8% for the comparative purpose. It can be seen that the initial and end SOCs, as well as SOC variation profiles in empirical testing and simulation, are well‐matched. (a) (b) (c) (d)
Figure 13. Comparison of (a) AC output from DCFC/EV (positive: charging, negative: discharging), (b) frequency
deviation without V2G or (c) with V2G, and (d) state of charge (SOC) variation obtained from empirical testing and simulation on the single‐vehicle‐based PFC for 100 min (starting SOC: 78.8%).
Figure 14 shows Simulink‐based simulation on AC output from DCFC/EV and SOC variation obtained from empirical testing and simulation using a normalized 2 h average
standard deviation signal on single‐vehicle‐based SFC operation for 2 h. The initial SOCs for the empirical SFC testing and its simulation were equally set to 80% for the comparative purpose. In the case of SFC, the bidirectional power produced from DCFC/EV based on the ACE signals required for regulation up and regulation down, should be fed to the grid. The empirical and simulated profiles of AC output from DCFC/EV and SOC variation in Figure 14 are relatively well‐matched, indicating that the proposed simulation model can be used to verify electrical interactions among the integrated power system components for SFC.
(a) (b)
Figure 14. Simulink‐based Simulation of (a) AC output from DC fast charger (DCFC)/EV (positive: charging, negative:
discharging) and (b) SOC variation obtained from empirical testing and simulation using a normalized 2 h average standard deviation signal on single‐vehicle‐based SFC operation for 2 h (starting SOC: 80.0%).
Even if the profiles of SOC variation measured and simulated are quite similar, there is a slight discrepancy of end SOCs between measurements and simulation, as shown in Figure 14b. The energies used for the increase (regulation up) and reduction (regulation down) of active power generation are symmetric in SFC; therefore, the initial and end SOCs should be identical. However, the efficiencies of AC‐to‐DC (92%) and DC‐to‐AC (95%) conversion in the utilized DCFC, as well as charging (99%) and discharging (100%) of Li‐ion EV batteries are different, resulting in a SOC that is slightly lower than the initial SOC during SFC operation. As mentioned above in Figure 13d, SOC percentages in the utilized DCFC are monitored in rough and irregular steps, such as 76.8%, 78.0%, 78.8%, and 80.0%. It seems that the SOCe of 78.8% obtained from DCFC in the empirical SFC testing could be between 78.8% and 80.0%. Therefore, it is required to utilize a DCFC with more precise SOC steps and a higher conversion efficiency over 95% in bidirectional power conversion to avoid any significant annual electrical energy loss to be potentially compensated with the financial benefits to be obtained from ancillary services.
After validating the proposed single‐vehicle‐based V2H/V2G model in PFC and SFC operations, as shown in Figures 13 and 14, further detailed simulation was performed to determine the impact of EV charging power and schedule on power quality and bidirectional power flow management in PFC operation at a residential house or a small facility with an integrated PV/Load and single EV system.
Simulink‐based simulation on AC output from DCFC/EV, frequency deviation, SOC variation, and various power flow in PV, load, PV‐to‐grid, and grid‐to‐nanogrid was conducted for PFC operation using grid input data, droop characteristics, the response from DCFC/EV, and simulated PV power and house load demands in the single‐vehicle‐ based V2H/V2G, as shown in Figure 15. Various parameters applied for this simulation can be found in Table 2. For each simulation scenario, the predicted PV power and simulated load data were utilized for nanogrid‐level simulations. If the system frequency drops below its nominal value, the EV acts as a source by producing power to the grid to prevent further frequency drop. On the other hand, EV acts as a load by absorbing power from the grid to prevent further frequency increase.
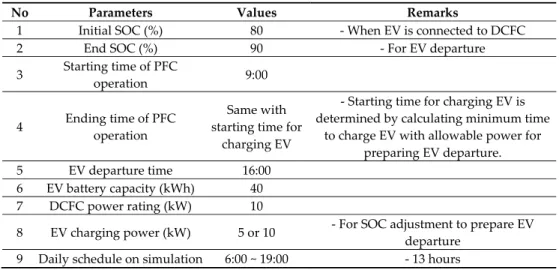
Table 2. Operational conditions and schedule of single‐vehicle‐based V2H/V2G. No Parameters Values Remarks
1 Initial SOC (%) 80 ‐ When EV is connected to DCFC 2 End SOC (%) 90 ‐ For EV departure 3 Starting time of PFC operation 9:00 4 Ending time of PFC operation Same with starting time for charging EV ‐ Starting time for charging EV is determined by calculating minimum time to charge EV with allowable power for preparing EV departure. 5 EV departure time 16:00 6 EV battery capacity (kWh) 40 7 DCFC power rating (kW) 10
8 EV charging power (kW) 5 or 10 ‐ For SOC adjustment to prepare EV departure
9 Daily schedule on simulation 6:00 ~ 19:00 ‐ 13 hours
The scheduled charging power of the EV is estimated by the following Equation (6): Pic = (SOCe − SOCi) ∙ Er/(tout − tin) (6)
where Pic (in kW) is the constant charging power at the EV battery side for obtaining the
charging demand to reach the expected SOCe at the plug‐out time tout, SOCi is the initial
SOC at the plug‐in time tin, and Er (in kWh) is the rated capacity of the EV battery. Both
the plug‐out time and the expected SOC should be provided by the EV driver in advance. It should be noted that the EV does not participate in PFC during the scheduled charging. To prepare the end SOC of an EV for its departure at 16:00, the starting time for charging EV is determined by calculating the minimum time to charge EV with an allowable power specified in DCFC and EV batteries for preparing EV departure in time. It was assumed to use 2 kW PV power and 6 kWh house load demands for 13 h from 06:00 until 19:00, which is 10 kWh in a whole day. The initial and end SOCs are 80% and 90%, respectively, and two EV charging power levels with 5 kW and 10 kW are applied for preparing EV departure conditions.
As shown in Figure 15b, by introducing V2G power flow from DCFC/EV under PV power generation and house load demands in AC mains, the resulting frequency deviations are effectively reduced. The lower‐ and upper‐frequency values in the stabilized period from 09:00 until 15:00 are around 59.9 Hz and 60.018 Hz that are very close to the nominal frequency, 60 Hz. It is evident that the V2G mode can contribute significantly to stabilize grid frequencies.
When the excess solar PV power is fed to the grid, over‐frequency may occur in AC mains; however, the resulting frequency deviations are also well‐maintained without any significant negative effect on the nanogrid. Simulation results prove that the proposed bidirectional charging strategy may contribute effectively towards frequency regulation. The frequencies are well regulated when the V2G mode is enabled, except for the period to conduct scheduled EV charging to prepare its departure at the end of PFC operation. The higher the EV charging power at the end of PFC operation, the larger the frequency deviation in AC mains, resulting in lowered power quality.
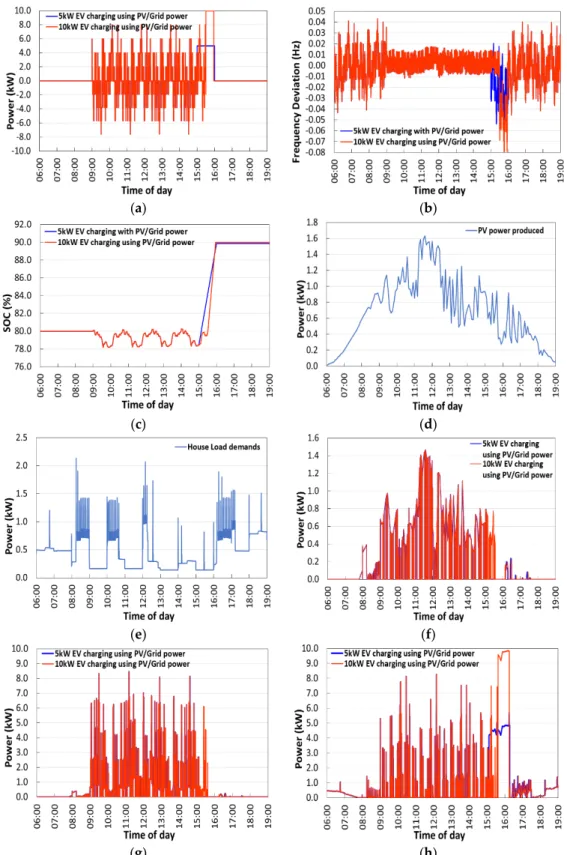
(a) (b) (c) (d) (e) (f) (g) (h)
Figure 15. Simulink‐based simulation of (a) AC output from DCFC/EV (positive: charging, negative: discharging), (b)
frequency deviation, (c) SOC variation, (d) PV power, (e) house load, (f) power flow from PV to the external grid after the supporting load and V2G, (g) power flow from combined PV and V2G to external grid, and (h) power flow from external grid to nanogrid for PFC operation in single‐vehicle‐based V2H/V2G (starting SOC: 80%, duration: 13 h from 06:00 to 19:00).
As shown in Figure 15c, real‐time SOC is built into the EV battery model to acquire the dynamic change of the battery energy capacity during the V2G operation and scheduled charging, where the actual charging duration is estimated based on the actual plug‐in duration. In this simulation, AC‐to‐AC coupled PV and EV were used; therefore, PV power generated was used first to directly charge EV during the charging steps of EV batteries in PFC operation. In addition, the PV power generated was also used for the increase of SOC to prepare EV departure and for the supporting load demands. As shown in Figure 15f, any excess PV power remaining is fed to the external grid because there is no stationary battery energy storage system (BESS) employed in this simulation. Figure 15 h shows the power flow from the external grid to the nanogrid for PFC operation in single‐ vehicle‐based V2H/V2G. The total net electrical energies supplied from the external grid are 3.13 kWh and 3.60 kWh for 5 kW and 10 kW EV charging scenarios, respectively, during the simulation period. The scenario to charge EV with 5 kW enabled to utilize more PV power because of earlier EV charging schedule than that of 10 kW EV charging scenario. To reduce the electricity cost, the increase of PV power and using a stationary BESS should be considered. 4.2. Simulation of Multi‐Vehicle‐Based Frequency Control A multi‐vehicle V2B/V2G model based on the intelligent optimal control algorithm was developed to include a coordinated control of the SOC and charging schedule for five aggregated EVs having different departure time and SOC management profiles, as shown in Figure 10. In this model, it was assumed to utilize a commercial building with daily electricity consumption of 50 kWh and a maximum load of 10 kW. For multi‐vehicle‐based V2B/V2G simulation, 5 EVs with an EV battery energy capacity in the range of 24~40 kWh were individually connected to bidirectional off‐board DCFCs with a power rating of 10~60 kW. It was also assumed to use the maximum renewable power of 20 kW from PV panels on the roof of the building or a PV tracker in the parking lot. The control of power flow from integrated system components in V2B/V2G requires to reflect the preferences of EV drivers, such as the departure time, maximum allowable C‐rate for charging and discharging of EV batteries, maximum usable EV battery capacity, and initial and end SOCs during V2B/V2G operations. Therefore, it is required to develop an intelligent optimal control algorithm for coordinated control of SOC and charging schedule of aggregated EVs with different departure times and SOC management profiles.
Detailed V2B/V2G operational conditions and schedule of 5 EVs based on the assumed preferences of EV drivers, shown in Table 1, were fully reflected into the proposed multi‐vehicle V2B/V2G model. This simulation has 7 input parameters, including the initial SOC, end SOC, ΔSOC, departure time, EV battery energy capacity, maximum C‐rate allowable, and maximum usable battery energy capacity as EV driver’s preferences and operational conditions. The upper and lower limits of SOC with 90% and 30%, respectively, were applied for this simulation regardless of input parameters to prevent unnecessary battery degradation during V2B/V2G operations.
The coordinated control algorithm proposed for multi‐vehicle‐based V2B/V2G operations, as shown in Figure 11, was applied to verify the effectiveness of the developed model and its impact on bidirectional power flow control and power quality. Figure 16 shows Simulink‐based simulation of AC output from each DCFC/EV, frequency deviation, SOC variation, PV power, building load demands, and various power flow of PV‐to‐grid, PV&V2G‐to‐grid, and external grid‐to‐microgrid for PFC operation using the coordinated control algorithm with 5 EVs.
The estimation on the electrical energy production from PV renewables, the energy consumption for building loads, and bidirectional power flow for frequency control as a function of time was conducted at the initial step based on predicted and simulated profiles of PV, load, and primary/secondary frequency control. The maximized EV
operational time for frequency control was applied for providing economic benefits to the building energy system operator. The latest time to start charging EVs using PV renewables and/or grid power for preparing EV departure was determined by energy capacities estimated for PV/loads/frequency control and operational conditions preferred by EV drivers. The maximum C‐rate allowable for charging each EV using PV and/or grid power depends on the specifications of DCFC connected and EV driver’s preferences.
To prepare the SOCe of each EV with a different departure time, the starting time for charging EV is determined by calculating the minimum time to charge EV with an allowable power specified in DCFC, EV batteries, and EV driver’s preferences for preparing EV departure in time. It was assumed to use 20 kW PV power and 30 kWh house load demands for 13 h from 06:00 until 19:00, which is 50 kWh in a whole day. The initial and end SOCs of each EV are specified by its own EV driver, as shown in Table 1.
The proposed decentralized coordinated control algorithm using 7 input parameters was applied for the detailed multi‐vehicle‐based V2B/V2G simulation with 5 EVs in Figure 16. In [12–15], various vehicle‐to‐grid (V2G) control strategies were proposed for both PFC and SFC. However, none of the control strategies simultaneously reflected detailed preferences of EV drivers and potential prevention of unnecessary EV battery degradation in the practical V2G operation. This included the departure time, maximum allowable C‐rate for charging and discharging of EV batteries, maximum usable EV battery energy capacity, initial and end SOCs, and upper and lower SOC limits. The scheduled charging of 5 EVs is shown in Figure 16a,c. Each EV was operated in a synchronized control from 09:00 until 14:00, and then its control was desynchronized from 14:00 until 16:00 for the intelligent coordinated control to continue PFC operation as long as possible. The fleet of 5 EVs in V2B/V2G can effectively reduce frequency deviation in a microgrid, as shown in Figure 16b. The frequencies are stabilized at around 60 Hz after starting the PFC. Small frequency vibrations resulting from the excess solar PV being fed to the grid are observed between 11:00 and 12:00. In addition, frequencies slightly decrease between 14:00 and 15:00 due to charging demands from the grid. The lower‐ and upper‐frequency values during the PFC period and scheduled charging are around 59.99 Hz and 60.02 Hz that are very close to the nominal frequency, 60 Hz.
The frequency stabilization can be enhanced by maintaining the power balance between supply and demand in the microgrid. Further frequency deviation reduction can be achieved by using a perfectly linear PFC droop characteristic with a narrower dead‐ band like ±5 mHz and any DCFC with higher AC‐to‐DC and DC‐to‐AC power conversion efficiencies. To improve frequency stabilization further without significant peaks, a stationary battery energy storage system (BESS) may be considered to store the excess solar PV energy instead of injecting it into the power grid. Then, the utilization of the stored energy in the BESS for scheduled EV charging would effectively improve the under‐frequency frequency values of 59.99 Hz. Interestingly, the significant under‐ frequency frequencies observed during scheduled charging in single‐vehicle‐based V2G simulation in Figure 15b disappear in the period of combined PFC operation and scheduled charging for multi‐vehicle‐based V2G simulation, as shown in Figure 16b. The simulation results clearly depict that the increasing number of vehicles in the EV fleet may not bring a negative impact on the power quality in the microgrid. According to the end SOC specified by each EV driver, the controlled operation of PFC and EV charging for preparing its departure can be conducted, as shown in Figure 16c. Any PV power remaining after supporting building load demands and charging EV during both charging steps to decrease frequencies in PFC and the preparation of EV departure should be fed to the external grid because there is no stationary battery energy storage system (BESS) integrated into this simulation, as shown in Figure 16f.
(a) (b) (c) (d) (e) (f) (g) (h) Figure 16. Simulink‐based simulation of (a) AC output from DCFC/EV (time interval: 5 min, positive: charging, negative: discharging), (b) frequency deviation, (c) SOC variation, (d) PV power, (e) building load demands, (f) power flow from PV to the external grid after the supporting load and V2G, (g) power flow from combined PV and V2G to the external grid, and (h) power flow from the external grid to microgrid for PFC operation using the coordinated control algorithm with 5 EVs (duration: 13 h from 06:00 to 19:00).
Figure 16g shows power flow from the external grid to microgrid for PFC operation, EV charging, and building load demands in multi‐vehicle‐based V2B/V2G simulation. During the simulation period, the electrical energy produced from PV and the building load demands are 90 kWh and 30 kWh, respectively. The total electrical energies fed from the microgrid to the external grid and supplied from the external grid to the microgrid are 78.8 kWh and 28.4 kWh, respectively. The use of electricity supplied from the grid can be further reduced by more effectively utilizing PV renewables, bidirectional power flow from EVs, and any additional stationary BESS for storing excess PV renewables in the microgrid. Figure 17 shows a Simulink‐based simulation of the total V2G power flow for PFC operation with or without the proposed coordinated control algorithm with 5 EVs. The proposed coordinated control algorithm utilizes all 7 input parameters for controlling the SOC and charging schedule of 5 EVs with different departure times and SOC management profiles. There may be various comparative cases not being able to simultaneously utilize all the specified input parameters, resulting in the early termination of PFC operation, delay of EV departure, and unmatched SOCe preferred by EV drivers.
Figure 17. Simulink‐based simulation of the total V2G power flow for PFC operation with or
without the proposed coordinated control algorithm with 5 EVs.
One of the key objectives of the coordinated control in this simulation study is to perform PFC or SFC operation as long as possible to maximize benefits to EV and building owners, while each EV with the specified SOCe is ready for its departure in time. At the beginning of PFC operation, the V2G power flow of all 5 EVs is synchronized to provide the total V2G power based on the designed droop characteristic for the aggregated EVs. However, each EV has a different departure schedule and different charging conditions, so that intelligent desynchronized control may be required to adjust the power level of EVs participating in PFC, while other EVs prepare its departure or after the departure of any EVs based on a schedule. Otherwise, the PFC operation should be stopped when any EV needs to stop PFC and start charging for its departure. The comparative case without the coordinated control in Figure 17 is that each EV keeps the originally assigned synchronized power flow from 09:00 until 16:00 for PFC operation. The EV charging process starts from 14:00 for the departure of EV1 at 15:00 and 15:00 for the departure of EV2 and EV5 at 16:00 as specified in Table 1. The continuous synchronized power flow from each EV for PFC operation inevitably results in the reduced V2G total power flow after 14:00. The PFC operation cannot continue after 14:00 due to the reduced total V2G power flow unmatched with the droop characteristic. PFC operation case without the coordinated control results in 2 h shorter than the PFC operation case with the intelligent decentralized coordinated control.
5. Conclusions
To verify the effectiveness of V2G‐based frequency control in a microgrid, modeling and simulations for single‐ and multi‐vehicle‐based primary and secondary frequency controls were conducted to utilize the integrated components at the CCHT‐V2G testing facility by using MATLAB/Simulink. The single‐vehicle‐based model was validated by comparing the empirical testing and simulation results of primary and secondary frequency controls. The validated conceptual model was then applied for dynamic phasor simulations on multi‐vehicle‐based frequency control with the proposed coordinated control algorithm for improving frequency stability and facilitating renewables integration with V2G‐capable EVs in a microgrid. This proposed model includes a decentralized coordinated control of the SOC and charging schedule for five aggregated EVs with different departure times and SOC management profiles preferred by EV drivers.
The comparison of power outputs resulting from the empirical testing and simulation was conducted to validate the effectiveness of the simulation model comprising of four sub‐models, including control for power quality and bidirectional power flow, PV renewables, EV/DCFC, and house loads. The empirical and simulated profiles on AC output from DCFC/EV, frequency deviation, and SOC variation were well‐ matched; therefore, the proposed simulation model was used to verify electrical interactions among the integrated power system components and further multi‐vehicle‐ based V2G simulation.
After validating the conceptual models of integrated single EV and power system components, a multi‐vehicle V2B/V2G model based on the coordinated control algorithm was developed and applied for Simulink‐based dynamic simulations. To reflect the assumed preferences of EV drivers, detailed V2B/V2G operational conditions and schedule of 5EVs were applied for V2B/V2G simulation, including 7 input parameters of the initial SOC, end SOC, ΔSOC, departure time, EV battery energy capacity, maximum C‐rate allowable, and maximum usable EV battery energy capacity. To prepare EV departure in time, each EV should be charged up to the required SOCe in a different departure time. The starting time for charging EV was determined by calculating the minimum time to charge EV with an allowable power specified in DCFC, EV batteries, and EV driver’s preferences.
This multi‐vehicle‐based V2B/V2G simulation showed that the fleet of 5 EVs in V2B/V2G could effectively reduce frequency deviation in the microgrid. It was determined that the total net electrical energy supply from the external grid would be reduced by using PV renewables and bidirectional power flow from EVs. To utilize PV renewables more effectively, using a stationary BESS should be considered in the microgrid.
Author Contributions: Conceptualization, Y.Y. and A.T.; methodology, Y.Y. and Y.A.‐S. and A.T.;
software, Y.Y. and Y.A.‐S. and A.T.; validation, Y.Y. and Y.A.‐S. and A.T.; formal analysis, Y.Y. and Y.A.‐S.; investigation, Y.Y. and Y.A.‐S. and A.T.; resources, Y.Y.; data curation, Y.Y. and Y.A.‐S.; writing—original draft preparation, Y.Y.; writing—review and editing, Y.A.‐S. and A.T.; visualization, Y.Y. and Y.A.‐S. and A.T.; supervision, Y.Y.; project administration, Y.Y.; funding acquisition, Y.Y. All authors have read and agreed to the published version of the manuscript. Funding: This research was co‐funded by the NRC’s Vehicle Propulsion Technology (VPT) Program and Transport Canada—ecoTECHNOLOGY for Vehicles Program. Institutional Review Board Statement: Not applicable. Informed Consent Statement: Not applicable. Data Availability Statement: Not applicable. Acknowledgments: The authors recognize the contribution of Nameer Khan at the University of
Toronto‐Electrical Engineering to develop a system control platform using SCADA. The authors also recognize the contributions of Qi Liang at NRC‐EME in system integration and Heather

![Figure 5. Normalized 2 h average standard deviation signal as a part of the 24 h frequency regulation duty cycle determined by Sandia National Laboratories [20].](https://thumb-eu.123doks.com/thumbv2/123doknet/13966250.453312/7.918.282.638.396.618/normalized-standard-deviation-frequency-regulation-determined-national-laboratories.webp)