HAL Id: hal-02635706
https://hal.inrae.fr/hal-02635706
Submitted on 27 May 2020HAL is a multi-disciplinary open access
archive for the deposit and dissemination of sci-entific research documents, whether they are pub-lished or not. The documents may come from teaching and research institutions in France or abroad, or from public or private research centers.
L’archive ouverte pluridisciplinaire HAL, est destinée au dépôt et à la diffusion de documents scientifiques de niveau recherche, publiés ou non, émanant des établissements d’enseignement et de recherche français ou étrangers, des laboratoires publics ou privés.
Distributed under a Creative Commons Attribution| 4.0 International License
TMPRSS2: ERG scores and serum PHI in predicting
prostate cancer aggressiveness.
Lucile Tallon, Devillier Luangphakdy, Alain Ruffion, Marc Colombel, Marian
Devonec, Denis Champetier, Philippe Paparel, Myriam Decaussin-Petrucci,
Paul Perrin, Virginie Vlaeminck-Guillem
To cite this version:
Lucile Tallon, Devillier Luangphakdy, Alain Ruffion, Marc Colombel, Marian Devonec, et al.. Compar-ative evaluation of urinary PCA3 and TMPRSS2: ERG scores and serum PHI in predicting prostate cancer aggressiveness.. International Journal of Molecular Sciences, MDPI, 2014, 15 (8), pp.13299-316. �10.3390/ijms150813299�. �hal-02635706�
International Journal of
Molecular Sciences
ISSN 1422-0067 www.mdpi.com/journal/ijmsArticle
Comparative Evaluation of Urinary PCA3 and TMPRSS2:
ERG Scores and Serum PHI in Predicting Prostate
Cancer Aggressiveness
Lucile Tallon 1,2,†, Devillier Luangphakdy 1,2,†, Alain Ruffion 2,3,4, Marc Colombel 2,5,6,
Marian Devonec 2,3, Denis Champetier 3, Philippe Paparel 2,3, Myriam Decaussin-Petrucci 2,4,7, Paul Perrin 2,3 and Virginie Vlaeminck-Guillem 1,2,8,*
1 Medical Unit of Molecular Oncology and Transfer, Department of Biochemistry and Molecular
Biology, University Hospital of Lyon Sud, Hospices Civils of Lyon, Chemin du Grand Revoyet, 69495 Pierre Bénite, France; E-Mails: lu.tallon@gmail.com (L.T.); ldevillier@gmail.com (D.L.)
2 Department of Medicine and Pharmacy, Faculty of Lyon 1 University, 8 Avenue Rockefeller,
69373 Lyon, France; E-Mails: alain.ruffion@chu-lyon.fr (A.R.); marc.colombel@chu-lyon.fr (M.C.); marian.devonec@chu-lyon.fr (M.D.); philippe.paparel@chu-lyon.fr (P.P.);
myriam.decaussin-petrucci@chu-lyon.fr (M.D.-P.); paul.perrin@chu-lyon.fr (P.P.)
3 Department of Urology, University Hospital of Lyon Sud, Hospices Civils of Lyon,
Chemin du Grand Revoyet, 69495 Pierre Bénite, France; E-Mail: denis.champetier@chu-lyon.fr
4 Institute of Functional Genomics of Lyon, CNRS UMR5242, Lyon 1 University-CNRS-INRA,
46 Allée d’Italie, 69364 Lyon, France
5 Department of Urology, E. Herriot Hospital, Hospices Civils of Lyon, Place d’Arsonval,
69003 Lyon, France
6 Joint Research Unit INSERM 1033, Lyon 1 University, Avenue Rockefeller, 69373 Lyon, France 7 Department of Pathology, University Hospital of Lyon Sud
, Hospices Civils of Lyon,
Chemin du Grand Revoyet, 69495 Pierre Bénite, France
8 Centre de Recherche en Cancérologie de Lyon, U1052 INSERM, UMR CNRS 5286,
Université Lyon I, Centre Léon Bérard, Rue Laennec, 69008 Lyon, France
† These authors contributed equally to this work.
* Author to whom correspondence should be addressed;
E-Mail: virginie.vlaeminck-guillem@univ-lyon1.fr; Tel.: +33-(0)4-78-86-29-92; Fax: +33-(0)4-78-86-66-54.
Received: 20 June 2014; in revised form: 15 July 2014 / Accepted: 18 July 2014 / Published: 30 July 2014
Abstract: It has been suggested that urinary PCA3 and TMPRSS2:ERG fusion tests and serum PHI correlate to cancer aggressiveness-related pathological criteria at prostatectomy. To evaluate and compare their ability in predicting prostate cancer aggressiveness, PHI and urinary PCA3 and TMPRSS2:ERG (T2) scores were assessed in 154 patients who underwent radical prostatectomy for biopsy-proven prostate cancer. Univariate and multivariate analyses using logistic regression and decision curve analyses were performed. All three markers were predictors of a tumor volume ≥0.5 mL. Only PHI predicted Gleason score ≥7. T2 score and PHI were both independent predictors of extracapsular extension (≥pT3), while multifocality was only predicted by PCA3 score. Moreover, when compared to a base model (age, digital rectal examination, serum PSA, and Gleason sum at biopsy), the addition of both PCA3 score and PHI to the base model induced a significant increase (+12%) when predicting tumor volume >0.5 mL. PHI and urinary PCA3 and T2 scores can be considered as complementary predictors of cancer aggressiveness at prostatectomy. Keywords: urine biomarker; prostate cancer; PCA3; TMPRSS2-ERG gene fusion; PHI; radical prostatectomy; aggressiveness
1. Introduction
Although Prostate-Specific Antigen (PSA) assay is not recommended for prostate cancer (PCa) screening (review in [1]), it is largely used for early detection and contributes to increase the incidence of PCa. It adversely, also, led to increase in the diagnosis of clinically insignificant tumors (overdiagnosis) and their early treatment (overtreatment) [1]. Efforts are therefore currently made to develop biomarkers able to identify cancers that require intervention and to help physicians in the choice of focal treatments. Prostate cancer gene 3 (PCA3), TMPRSS2:ERG gene fusion and PHI are among the most promising biomarkers that could complement PSA for early PCa diagnosis.
PCA3 gene products a non-coding RNA, whose function is largely unknown. Although no or weak expression was reported in non-malignant prostate tissues, PCA3 overexpression was observed in up to 95% of PCas [2]. A urinary test has been proposed for a decade [3] and is now commercially available as a kit that specifically captures (magnetic beads), amplifies (transcription-mediated amplification), detects (hybridization protective assay), and quantifies PCA3 RNA copies in urine samples obtained after an attentive digital rectal examination (DRE) from patients with PCa suspicion [4]. Numerous clinical studies established the diagnostic potential of PCA3 test as a means to help physicians in deciding prostate cancer biopsies with a better specificity than serum PSA (revue in [5,6]). The test received in 2012 FDA agreement in patients 50 years of age or older who have had one or more previous negative biopsies and for whom a repeat biopsy would be recommended.
Fusion of the androgen-regulated TMPRSS2 gene promoter (transmembrane protease, serine 2) to the ETS transcription factors ERG or ETV1 was described as recurrent in the majority of PCas [7]. Subsequent studies confirmed ETS gene fusions in about 50% of PSA screened PCas [8]. TMPRSS2:ERG fusions represent about 90% of all ETS gene fusions and are typically detected at the chromosomal level by fluorescence in situ hybridization [8]. The subsequent overexpression of the TMPRSS2:ERG transcript (in situ hybridization or RT-PCR) is reported as highly specific for the presence of cancerous tissue in prostate tissue-based studies [8,9]. Similar to the PCA3 transcript, TMPRSS2:ERG mRNA is detectable in urine [10,11]. A specific urinary test, the T2 test, recently developed on the basis of the same methodology than the PCA3 test, provides quantification of the amount of TMPRSS2:ERG transcripts [12]. Recent results demonstrated that the combination of PCA3 and T2 tests enhances the utility of PSA for predicting PCa risk [12].
Prostate Health Index (PHI) is based on the assessment of both total serum PSA, its free fraction and a precursor isoform named [-2]proPSA. Some papers recently suggested that it could improve discrimination both between patients with and without PCa and it therefore received FDA agreement in 2012. It could also discriminate between cases of clinically significant or indolent cancer [13–17]. Combination of PHI with PCA3 and/or T2 scores was also acknowledged as useful [18–22].
Whether PHI and PCA3 and T2 tests allow distinction between significant and insignificant PCas is still matter of debate. Since the first report based on prostatectomy specimens [23], correlation between PCA3 score and tumor volume has been confirmed by subsequent studies [24–27]. By contrast, although also early reported [23], correlation with Gleason score (GS) has not been consistently observed in more recent papers [27–31]. We and others reported correlation between PCA3 score and number of tumor foci [27,32], while others highlighted a link with pT stage [25,26,33] or perineural extension [34]. Correlations of T2 score with GS, pT stage or tumor volume have been inconsistently found [12,30,32,35]. A recent study reported a correlation between PHI and GS, pT stage and tumor volume [36]. Biological predictors of actual GS, tumor volume, pT stage, or number of foci (PCa aggressiveness) could have significant clinical applicability in appropriately selecting patients to the most appropriate treatment: active surveillance, focal treatment or radical treatment. The aim of our study was to evaluate and compare, in a prospective cohort of patients undergoing radical prostatectomies for biopsy-proven PCa, the ability of PHI and PCA3 and T2 scores to predict GS, low tumor volume, multifocality and extracapsular extension at final pathology.
2. Results and Discussion
2.1. Baseline Characteristics of the Studied Patients
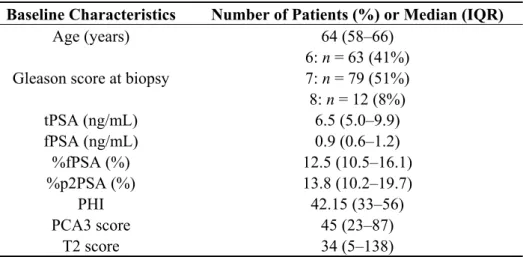
Baseline characteristics of the 154 included patients and pathological findings at biopsies and prostatectomies are shown in Tables 1 and 2. Median patient age was 64 years. Preoperative median PSA was 6.5 ng/mL. Pathologic GS at prostatectomy was ≥7 in 132 patients (86%), and 48 (31%) were diagnosed with extracapsular extension. Within the 63 patients with biopsy GS ≤6, 43 (68%) showed an upgrading of the GS at final pathology. Tumor volume was ≥0.5 mL in 134 patients (88%).
Table 1. Baseline characteristics of the 154 patients who underwent radical prostatectomy. Baseline Characteristics Number of Patients (%) or Median (IQR)
Age (years) 64 (58–66)
Gleason score at biopsy
6: n = 63 (41%) 7: n = 79 (51%) 8: n = 12 (8%) tPSA (ng/mL) 6.5 (5.0–9.9) fPSA (ng/mL) 0.9 (0.6–1.2) %fPSA (%) 12.5 (10.5–16.1) %p2PSA (%) 13.8 (10.2–19.7) PHI 42.15 (33–56) PCA3 score 45 (23–87) T2 score 34 (5–138)
Abbreviations: IQR: interquartile range; PCA3: prostate cancer gene 3; PSA: prostate-specific antigen; tPSA: total serum PSA; fPSA: free serum PSA; %fPSA: fPSA-to-tPSA ratio; %p2PSA: p2PSA-to-tPSA ratio; PHI: Prostate Health Index; SD: standard deviation; T2: TMPRSS2:ERG fusion gene.
Table 2. Pathological characteristics of the tumors in prostatectomy specimens and correlations with serum PSA (Prostate-Specific Antigen), PHI (Prostate Health Index), urinary PCA3 (Prostate Cancer gene 3) and T2 (TMPRSS2:ERG) scores.
Pathological Characteristics Prostatectomy (Number of Patients) Number of Patients (%)
Serum PSA PCA3 Score T2 Score PHI
Median (IQR) p Value Median (IQR) p Value Median (IQR) p Value Median (IQR) p Value Pathological T stage n = 154 pT2 n = 106 (69%) 6.5 (5.0–9.0) 0.467 47 (23–82) 0.724 27 (5–106) 0.027 41 (32–53) 0.086 ≥pT3 n = 48 (31%) 6.4 (5.2–10.9) 40 (25–111) 52 (10–352) 47 (34–59) Gleason stage n = 154 G6 n = 22 (14%) 6.5 (4.6–11.0) 0.739 47 (23–81) 0.897 38 (6–148) 0.123 34 (31–40) 0.013 G ≥ 7 n = 132 (86%) 6.5 (5.2–9.3) 43 (23–90) 35 (7–151) 44 (34–57) Total tumor volume
(mL) a n = 153 <0.5 n = 19 (12%) 6.2 (4.1–10.1) 0.276 23 (15–47) 0.004 14 (1–105) 0.090 32 (27–42) 0.002 ≥0.5 n = 134 (88%) 6.5 (5.1–9.3) 48 (25–94) 37 (6–154) 44 (34–57)
Number of tumor foci
n = 154 Uni n = 41 (27%) 6.1 (4.3–11.0) 0.230 27 (19–49) 0.002 55 (8–178) 0.299 41 (33–52) 0.410 Multi n = 113 (73%) 6.6 (5.4–9.2) 51 (27–94) 33 (3–127) 43 (33–57) Blood embols n = 154 No n = 148 (96%) 6.5 (5.0–9.1) 0.030 44 (23–85) 0.253 35 (5–138) 0.709 42 (33–55) 0.009 Yes n = 6 (4%) 12.9 (8.6–18.1) 103 (25–148) 20 (2–164) 79 (46–140) Positive resection margins n = 154 R0 n = 121 (79%) 6.3 (5.0–8.8) 0.029 42 (23–82) 0.241 36 (5–137) 0.620 40 (32–53) 0.007 R1 n = 33 (21%) 7.8 (5.9–14.1) 61 (26–110) 29 (3–214) 50 (41–65) Abbreviations: IQR: interquartile range; PCA3: prostate cancer gene 3; PHI: Prostate Health Index; PSA: prostate-specific antigen; T2: TMPRSS2:ERG fusion gene; a: median total tumor volume = 2.2 (IQR: 0.9–4.1).
Expectedly, serum PSA correlated with PHI. No correlation was found between PSA or PHI and PCA3 or T2 score. By contrast, PCA3 and T2 scores correlated with each other. Only PCA3 positively correlated with age. Serum PSA was correlated with prostate volume as determined by preoperative TRUS and with prostate weight at prostatectomy. No other correlation was found between the biomarkers and prostate volume or prostate weight at prostatectomy.
2.2. Correlations between Biological Biomarkers and Pathological Findings
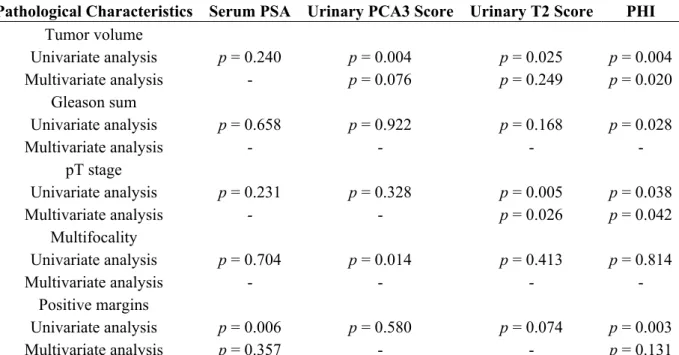
Using univariate linear regression, PCA3 score and PHI, as well as T2 score although less markedly, were predictors of a tumor volume ≥0.5 mL (Tables 2 and 3; Figure 1). Only PHI predicted GS at prostatectomy ≥7 (Figure 2). T2 score and PHI were both predictors of extracapsular extension (≥pT3) (Figure 3), while multifocality was only predicted by PCA3 score (Figure 4). Positive resection margins were predicted by both serum PSA and PHI (Table 3). Multivariate analyses showed that PHI was the only independent predictor of tumor volume ≥0.5 mL (Table 3). T2 score and PHI proved to be both independent predictors of extracapsular extension.
Table 3. Multivariate analyses evaluating the ability of clinico-biological variables to predict major outcomes at prostatectomy.
Pathological Characteristics Serum PSA Urinary PCA3 Score Urinary T2 Score PHI
Tumor volume Univariate analysis p = 0.240 p = 0.004 p = 0.025 p = 0.004 Multivariate analysis - p = 0.076 p = 0.249 p = 0.020 Gleason sum Univariate analysis p = 0.658 p = 0.922 p = 0.168 p = 0.028 Multivariate analysis - - - - pT stage Univariate analysis p = 0.231 p = 0.328 p = 0.005 p = 0.038 Multivariate analysis - - p = 0.026 p = 0.042 Multifocality Univariate analysis p = 0.704 p = 0.014 p = 0.413 p = 0.814 Multivariate analysis - - - - Positive margins Univariate analysis p = 0.006 p = 0.580 p = 0.074 p = 0.003 Multivariate analysis p = 0.357 - - p = 0.131
Abbreviations: PCA3: prostate cancer gene 3; PHI: Prostate Health Index; PSA: prostate-specific antigen; T2: TMPRSS2:ERG fusion gene.
Figure 1. Median PCA3 score (p = 0.004) and PHI (p = 0.002) according to tumor volume. Biological and pathological findings in 154 men who underwent radical prostatectomies for prostate cancer. Note: The boxes are bordered at the 25th (p25) and the 75th (p75) percentiles (the so-called inter-quartile range IQR) with the median line at the 50th percentile. Whiskers extend from the box to the upper and lower adjacent values. The upper adjacent value is defined as the largest data point ≤(p75 + 1.5 × IQR). The lower adjacent value is defined as the smallest data point ≥(p25 − 1.5 × IQR).
Figure 2. Median PHI according to Gleason sum (p = 0.013). Biological and pathological findings in 154 men who underwent radical prostatectomies for prostate cancer. (See the note in the legend of the Figure 1 for complete explanation of how to read the figure).
Figure 3. Median T2 score (p = 0.027) and PHI (p = 0.086) according to extracapsular extension. Biological and pathological findings in 154 men who underwent radical prostatectomies for prostate cancer. (See the note in the legend of the Figure 1 for complete explanation of how to read the figure).
Median = 23 Median = 48 0 50 10 0 15 0 20 0
Tumor volume <0.5 ml Tumor volume > 0.5 ml Tumor volume < 0.5 mL Tumor volume ≥ 0.5 mL
Median = 32 Median = 44 20 40 60 80
Tumor volume < 0.5 ml Tumor volume > 0.5 ml Tumor volume < 0.5 mL Tumor volume ≥ 0.5 mL
Median = 34 Median = 44 20 40 60 80
Gleason sum = 6 Gleason sum = 7 or 8
Median = 27 Median = 52 0 20 0 40 0 60 0 80 0 pT2 pT3/4 Median = 41 Median = 47 20 40 60 80 pT2 pT3/4
Figure 4. Median PCA3 score according to number of prostate cancer foci (p = 0.002). Biological and pathological findings in 154 men who underwent radical prostatectomies for prostate cancer. (See the note in the legend of the Figure 1 for complete explanation of how to read the figure).
2.3. Integration of Biological Biomarkers into Predictive Models
We next assessed whether the biological biomarkers significantly improve predictive accuracy of preoperative predictive models. Base model was defined by including age (continuous variable), DRE findings (suspicious vs. non suspicious), serum PSA (continuous variable) and GS at biopsy (6 vs. ≥7). We then assessed the additional value of those biomarkers found to be significant in above-cited analyses. The predicted accuracy of the base model in predicting GS ≥7 at prostatectomy was estimated by an AUC of 81%. The addition of PHI (the only significant biomarker) improved the AUC to 86% but this 5% difference did not reach statistical significance (Table 4).
Table 4. Prediction of Gleason sum ≥7 at prostatectomy.
Predictors
Univariate Analysis Multivariate Analysis
Base Model Base Model + PHI
OR (95% CI) p Value AUC (95% CI) OR (95% CI) OR (95% CI) Age 1.067 (0.989–1.153) 0.099 62.5% (50.1–74.8) 1.018 (0.935–1.110) 1.047 (0.954–1.150) DRE findings 1.705 (0.471–6.177) 0.393 53.8% (45.7–61.9) 0.959 (0.215–4.275) 1.413 (0.268–7.438) Serum total PSA 1.022
(0.926–1.127) 0.658 52.2% (38.0–66.4) 0.966 (0.856–1.091) 0.867 (0.738–1.018) Biopsy Gleason sum 20.698
(4.626–92.615) <0.0001 79.2% (71.8–86.5) 21.505 (4.418–104.677) 18.839 (4.018–88.335) PHI 1.030 (0.998–1.062) 0.028 66.6% (54.4–78.7) - 1.049 (1.002–1.097) Median = 51 Median = 27 0 50 10 0 15 0 20 0
Table 4. Cont.
Predictors
Univariate Analysis Multivariate Analysis
Base Model Base Model + PHI
OR (95% CI) p Value AUC (95% CI) OR (95% CI) OR (95% CI) AUC (multivariate models) 81.3% (71.1–91.5) 86.1% (79.0–93.1) Gain in predictive accuracy * - +4.8 p value * - NS
All variables were treated as continuous variables except DRE (digital rectal examination; suspicious vs. non suspicious) and Gleason sum at biopsy (6 vs. ≥7). *: as compared with the base model. AUC: area under receiver operating curves; NS: not significant; OR: odds ratio; PHI: Prostate Health Index; PSA: prostate-specific antigen.
The predicted accuracy of the base model in predicting tumor volume ≥0.5 mL at prostatectomy was estimated by an AUC of 69%. The addition of PCA3 score, T2 score and PHI improved the AUC to 74%, 72%, and 76%, respectively. No difference reached statistical significance (Table 5). The addition of PHI simultaneously to PCA3 score provided a significant 12% increase in AUC. The combination of the three biomarkers to the base model also significantly provided a significant 14% increase in AUC although T2 score appeared poorly informative (Table 5). Increased AUCs were also obtained—although non significantly—when evaluating the additional value of incorporating PHI into the base model to predict positive resection margins, incorporating PHI or T2 score into the base model to predict extracapsular extension, or incorporating PCA3 score to the base model to predict multifocality.
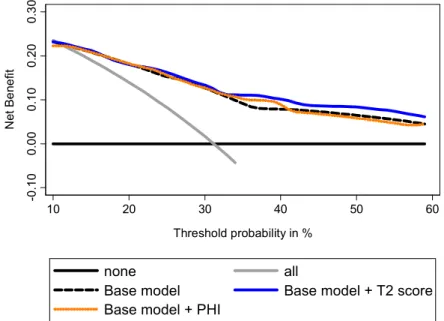
Decision curve analyses (DCA) showed a higher benefit in incorporating PHI to the base model to predict GS ≥7 at prostatectomy (Figure 5). To predict tumor volume ≥0.5 mL, DCA showed that addition of PHI to the base model provided a higher benefit, especially for intermediate prostate cancer risk (Figure 6). Addition of PCA3 score was beneficial for high prostate cancer risk. Addition of both biomarkers provided the best increase in clinical benefit (Figure 6). To predict extracapsular extension, the addition of T2 score to the base model provided the highest benefit when compared to PHI (Figure 7), while combination of both biomarkers was not beneficial (not shown).
Table 5. Prediction of tumor volume ≥0.5 mL at prostatectomy. Predictors Univariate Analysis Multivariate Analysis Base Model Base Model + PCA3 Score Base Model + T2 Score Base Model + PHI Base Model + PCA3 and T2 Scores Base Model + PCA3 Score + PHI Base Model + T2 Score + PHI Base Model + PCA3 and T2 Scores + PHI OR (95% CI) p Value AUC (95% CI) OR (95% CI) OR (95% CI) OR (95% CI) OR (95% CI) OR (95% CI) OR (95% CI) OR (95% CI) OR (95% CI) Age 1.091 (1.007–1.183) 0.035 67.2% (55.3–79.2) 1.096 (1.008–1.193) 1.066 (0.977–1.164) 1.091 (1.001–1.189) 1.119 (1.021–1.227) 1.070 (0.980–1.169) 1.087 (0.988–1.196) 1.110 (1.011–1.220) 1.089 (0.988–1.198) DRE findings 1.409 (0.383–5.177) 0.595 52.6% (43.4–61.7) 1.433 (0.371–5.543) 1.536 (0.391–6.036) 1.229 (0.314–4.807) 1.486 (0.361–6.121) 1.270 (0.319–5.052) 1.624 (0.382–6.905) 1.237 (0.291–5.259) 1.293 (0.295–5.664) Serum total PSA 1.072 (0.943–1.219) 0.240 57.7% (42.2–73.3) 1.075 (0.938–1.231) 1.057 (0.926–1.208) 1.082 (0.943–1.243) 0.932 (0.789–1.102) 1.068 (0.930–1.226) 0.917 (0.774–1.087) 0.949 (0.801–1.124) 0.935 (0.787–1.112) Biopsy Gleason sum 1.375 (0.524–3.610) 0.519 53.9% (41.6–66.2) 0.932 (0.331–2.627) 1.010 (0.354–2.883) 0.931 (0.326–2.659) 0.907 (0.322–2.553) 0.986 (0.343–2.832) 1.017 (0.354–2.925) 0.903 (0.315–2.593) 0.970 (0.334–2.818) PCA3 score 1.019 (1.002–1.036) 0.004 70.8 (58.9–82.6) - 1.016 (0.999–1.034) - - 1.013 (0.996–1.030) 1.017 (0.999–1.035) - 1.014 (0.996–1.032) T2 score 1.004 (0.999–1.009) 0.025 62.0% (49.0–75.1) - - 1.004 (0.999–1.010) - 1.003 (0.998–1.009) - 1.004 (0.998–1.009) 1.003 (0.997–1.008) PHI 1.050 (1.008–1.093) 0.004 71.7% (58.7–84.8) - - - 1.068 (1.018–1.122) - 1.068 (1.017–1.121) 1.066 (1.016–1.118) 1.065 (1.015–1.118) AUC of multivariate models 68.9% (57.2–80.5) 74.4% (63.5–85.4) 71.5% (59.9–83.1) 76.0% (62.6–89.4) 75.2% (64.5–85.9) 81.1% (69.2–93.0) 79.2% (69.2–93.0) 82.7% (71.6–93.8) Gain in predictive accuracy * - +5.5 +2.6 +7.1 +6.3 +12.2 +10.3 +13.8 p value * - 0.056 0.428 0.240 0.052 0.028 0.076 0.011
All variables were treated as continuous variables except DRE (digital rectal examination; suspicious vs. non suspicious) and Gleason sum at biopsy (6 vs. ≥7). *: as compared with the base model. AUC: area under receiver operating curves; OR: odds ratio; PCA3: prostate cancer gene 3; PHI: Prostate Health Index; PSA: prostate-specific antigen; T2: TMPRSS2:ERG fusion gene.
In summary, we demonstrated that PHI and T2 and PCA3 scores correlated with tumor volume at prostatectomy. PHI correlated with Gleason score. T2 score proved to predict extracapsular extension while PCA3 score was able to predict multifocal prostate cancer. Association of PHI and PCA3 score was the most performing association.
Figure 5. Evaluation of the ability of PHI to predict Gleason sum ≥7 using decision curve analysis. Base model: age, DRE findings, total serum PSA and Gleason sum at biopsy.
Figure 6. Evaluation of the ability of PHI and PCA3 score to predict tumor volume ≥0.5 mL using decision curve analysis. Base model: age, DRE findings, total serum PSA, and Gleason sum at biopsy.
0. 0 0 0.2 0 0.40 0.60 0. 8 0 Net B e n e fit 50 60 70 80 90 Threshold probability in % none all
Base model Base model + PHI
0. 0 0 0.2 0 0.4 0 0.60 0.80 Ne t B e n e fit 50 60 70 80 90 Threshold probability in % none all Base model
Base model + PCA3 score Base model + PHI
Figure 7. Evaluation of the ability of PHI and T2 score to predict extracapsular extension using decision curve analysis. Base model: age, DRE findings, total serum PSA, and Gleason sum at biopsy.
2.4. Discussion
In the current study, we investigated the relationship between three biomarkers—PHI, urinary PCA3 and T2 scores—and PCa characteristics at final pathology in a population of patients treated with radical prostatectomy for localized PCa. The results of the study supported the hypothesis that each biomarker is able to predict some of the pathological disease characteristics, namely tumor volume ≥0.5 mL, extracapsular extension (≥pT3 tumors), multifocality, and Gleason sum. Of interest, while tumor volume is predicted by both PCA3 and T2 scores and PHI, the three tests predict specifically different characteristics, PCA3 score being indicative of multifocality, T2 score of extracapsular extension and PHI of Gleason sum.
Smaller tumors are thought to be less aggressive and less frequently associated with progression [37]. That is why Nakanishi et al. assessed the ability of PCA3 score to predict tumor volume at prostatectomy [23]. They observed a correlation, which was confirmed by several other published series whether the tumor volume was directly assessed on prostatectomy specimens [23,25–27,38] or indirectly by biopsy markers such as number or proportion of invaded cores, or length or proportion of invaded tissue (review in [5]). Two previous studies also suggested a correlation between PHI and tumor volume whether this correlation was evaluated on the basis of the number of positive cores at prostate biopsy [18] or the prostatectomy results [36]. Our results further support the relationships between both biomarkers and tumor volume. We failed however to find such a correlation between tumor volume and T2 score. Two studies previously evaluated this correlation in regards to prostatectomy results [12,32]. In the largest study (n = 187), Tomlins et al. found a correlation between T2 score and tumor volume while Young et al. did not (n = 41 specimens in which tumor volume was assessed by summed total linear dimensions) [32].
Extracapsular extension is also an obvious and major prognosis-related pathological feature [39]. Correlation with extracapsular extension has been reported for PHI [36], as well as for PCA3 [25,26,33]
-0 .1 0 0. 00 0. 1 0 0. 20 0. 30 Ne t B e ne fit 10 20 30 40 50 60 Threshold probability in % none all
Base model Base model + T2 score
and T2 scores [30,35]. We could only confirm this relationship for T2 score, a result consistent with a recently published meta-analysis [9]. When evaluating such relationship in specimens from prostatectomies (8003 patients), biopsies (423 patients) or transurethral resections (350 patients), this meta-analysis indeed found that men with TMPRSS2:ERG fusion-positive cancers were more likely to have advanced stage tumors (T3 or greater vs. T2 or lower) [9]. Conversely to some studies [25,26,33], we did not observe any association between the PCA3 score and extracapsular extension. The lack of correlation was previously reported [23,24,28–31,34,38], although not explained.
As another pathological characteristic likely to influence treatment decision between radical or focal therapies [39], we tested PCa multifocality as an outcome to predict by PCA3 or T2 score or PHI. We previously reported the first study establishing a correlation between the PCA3 score and multifocality [27] and here confirm the results in a larger cohort. Another study found similar results with PCA3 test but failed, as in our results, to find relationship between tumor focality and T2 score [32]. In recent years, several efforts have been made to find biomarkers or combination of biomarkers that could help clinicians preoperatively determine PCa pathological characteristics and aggressiveness and therefore choose the best treatment option based on these parameters. In relation with the widespread use of PSA for individual screening, an increasing number of men are diagnosed with lower stage of PCa. These patients are consequently offered numerous options including radical prostatectomy and radiotherapy, but also prostate-sparing managements such as active surveillance and focal therapy. The use of a reliable, robust and accurate biomarker or a combination of such biomarkers could be dramatically helpful in clinical decision making. Such biomarkers could also be used as indicators of whether additional pretreatment examinations (prostatic MRI for example to assess extracapsular extension [40]) is warranted before making a definitive decision. These major clinical considerations prompted us to evaluate whether incorporating PHI, PCA3 score, and/or T2 score into the regression base model improved the accuracy of the prognostic model and therefore the clinical management. We showed that all three can improve predictive accuracy when compared to a base model that reflects clinical practice by including clinico-biological criteria and Gleason sum at biopsy. The decision strategy can, therefore, be meaningfully incremented by incorporating these biomarkers, in particular because they provide significant prediction for different aspects of PCa aggressiveness. This is of importance because the real interest in associating PHI, and PCA3 and T2 scores has not been established when evaluated for diagnostic purposes [18,19,30].
Our study presents some limitations, such as the relatively small size of our cohort, the inclusion of Caucasian only patients, or the fact that pathological examinations were not performed by a unique reference pathologist even all were experienced in the prostate pathology field. Results should therefore be considered with caution before applying them to all populations. Nevertheless, with well-documented and no missing data, data collection proved to be reliable and prediction models are likely to be robust.
3. Experimental Section
3.1. Patients and Study Design
From February 2008 to April 2012, 154 patients with informative preoperative urine sample (>10,000 copies/mL PSA RNA) and radical prostatectomy because of biopsy-proven PCa were prospectively included in the Department of Urology at Hospices Civils of Lyon. Prior to biopsy, the patients underwent clinical and biological evaluation including digital rectal examination (DRE) and transrectal ultrasonography (TRUS). Urine samples were obtained at that time and the mean interval between serum and urine sampling and prostatectomy was 4.2 months. Patients who received 5alpha-reductase inhibitors prior to urine sampling and surgery were excluded. None received neoadjuvant treatment. The institutional review board approved this study and all patients provided written informed consent to participate.
First voided urines were collected and transferred into a specific transport tube (Progensa® PCA3 Urine Specimen Transport Kit, San Diego, CA, USA) after attentive DRE [4]. Samples were stored at −80 °C until use. PCA3 and PSA RNA were quantified in our lab (Progensa® PCA3 Assay, Hologic Gen-Probe) [4]. Determination of T2 score was performed by Hologic Gen-Probe (San Diego, CA, USA), using the second-generation TMA assay as described [12]. The PSA mRNA levels determined in our lab to calculate PCA3 scores and the ones determined by Hologic Gen-Probe to calculate T2 scores were strongly correlated: p < 0.001 using linear regression, ρ coefficient = 0.974 and p < 0.0001 using Spearman test. PCA3 and T2 scores were calculated as the ratio of PCA3 or TMPRSS2:ERG to PSA RNA ×1000 or 100,000, respectively. Access® 2 Hybritech p2PSAs were measured on the Access Immunoassay Systems (Beckman Coulter, Brea, CA, USA) as recommended [41], in combination with measurements of total and free PSA levels. The PHI was calculated using the formula PHI = ([-2]proPSA/free PSA) × √(total PSA). PHI, PCA3, and TMPRSS2:ERG analyses were performed without knowing pathological results.
3.2. Tissue Samples
The prostate was weighted after removing the seminal vesicles and measured in 3 dimensions. Prostate volume was calculated using the formula for elliptical volume: π/6 × height × width × length. All specimens were inked and processed using the standard technique. The apical segment, basal portion, bladder neck and seminal vesicles were handled separately. Each remaining prostate specimen was formalin fixed, paraffin embedded and sectioned at regular intervals in a transverse plane perpendicular to the posterior surface. Radical prostatectomies were examined by pathologists all experienced with prostate disease and blinded to PCA3 and T2 scores and PHI results. Pathological tumor staging used 2002 UICC TNM classification, 6th edition. The product of the 3 tumor dimensions was multiplied by 0.4 to estimate volume, as recommended by Chen et al. [42].Total tumor volume was determined by adding the volume of each tumor focus. Microscopic tumor foci were numbered but considered to have negligible volume. If more than 1 tumor was reported, the highest GS was used.
3.3. Data Analysis and Statistics
The primary end point of the study was to determine the accuracy of PCA3 score, T2 score and PHI to predict GS, tumor volume, multifocality, and extracapsular extension. Medians were compared using Mann-Whitney test. Spearman test and linear regression analyses were done to determine associations between PSA mRNA levels as quantified in our department for PCA3 score calculation and in Hologic Gen-Probe lab for T2 score calculation. Univariate logistic regression models addressed each outcome of interest. A base model was defined by the combination of age (continuous variable), DRE findings (suspicious vs. non-suspicious), serum PSA (continuous variable) and Gleason score (≤6 vs. ≥7). To evaluate whether incorporating PCA3 score and/or T2 score and/or PHI into the regression base model improved the accuracy of the prognostic model and therefore the clinical management, comparison of regression models or areas under curves and decision curve analyses (DCA) [43,44] were performed. Indeed, DCA examined the theoretical relationship between the threshold probability of the outcome of interest (GS, extracapsular extension, tumor volume ≥0.5 mL, multifocality) and the relative value of false-positive and false-negative results [43,45]. In our study, this analysis estimated the magnitude of benefit resulting from altering clinical management in patients with different threshold probabilities of PCa, as previously used [36]. Data were analyzed using software package STATA® v11.0 (College Station, TX, USA) with p < 0.05 considered statistically significant. 4. Conclusions
We showed that PHI and urinary PCA3 and T2 scores are predictors of PCa pathological characteristics at radical prostatectomy such as tumor volume <0.5 mL, extracapsular extension and tumor multifocality. PHI and PCA3 and T2 scores could complement each other since they predict different pathological characteristics.
Acknowledgments
We thank Martine Cottancin and Blandine Grangier for excellent technical assistance and Hologic Gen-Probe for their support in performing T2-assays. We thank Pierre-Eloi Briant, Jean-Louis Campos-Fernandes, Sandra Genevois, Nicolas Gobeaux and Maxime Vinet for their contribution in patient recruitment.
Author Contributions
Alain Ruffion, Marc Colombel, Marian Devonec, Denis Champetier, Philippe Paparel, Paul Perrin and Virginie Vlaeminck-Guillem assumed patients recruitment, data collection treatments. Lucile Tallon, Devillier Luangphakdy and Virginie Vlaeminck-Guillem performed experiments and data analysis. Myriam Decaussin-Petrucci performed pathological examinations. Writing, management and submission tasks were done by Virginie Vlaeminck-Guillem.
Conflicts of Interest
References
1. Wilt, T.J.; Ahmed, H.U. Prostate cancer screening and the management of clinically localized disease. BMJ 2013, 346, f325. doi:10.1136/bmj.f325.
2. Bussemakers, M.J.; van Bokhoven, A.; Verhaegh, G.W.; Smit, F.P.; Karthaus, H.F.; Schalken, J.A.; Debruyne, F.M.; Ru, N.; Isaacs, W.B. DD3: A new prostate-specific gene, highly overexpressed in prostate cancer. Cancer Res. 1999, 59, 5975–5979.
3. Hessels, D.; Klein Gunnewiek, J.M.; van Oort, I.; Karthaus, H.F.; van Leenders, G.J.; van Balken, B.; Kiemeney, L.A.; Witjes, J.A.; Schalken, J.A. DD3(PCA3)-based molecular urine analysis for the diagnosis of prostate cancer. Eur. Urol. 2003, 44, 8–15.
4. Groskopf, J.; Aubin, S.M.; Deras, I.L.; Blase, A.; Bodrug, S.; Clark, C.; Brentano, S.; Mathis, J.; Pham, J.; Meyer, T.; et al. APTIMA PCA3 molecular urine test: Development of a method to aid in the diagnosis of prostate cancer. Clin. Chem. 2006, 52, 1089–1095.
5. Auprich, M.; Bjartell, A.; Chun, F.K.; de la Taille, A.; Freedland, S.J.; Haese, A.; Schalken, J.; Stenzl, A.; Tombal, B.; van der Poel, H. Contemporary role of prostate cancer antigen 3 in the management of prostate cancer. Eur. Urol. 2011, 60, 1045–1054.
6. Vlaeminck-Guillem, V.; Ruffion, A.; Andre, J.; Devonec, M.; Paparel, P. Urinary prostate cancer 3 test: Toward the age of reason? Urology 2010, 75, 447–453.
7. Tomlins, S.A.; Rhodes, D.R.; Perner, S.; Dhanasekaran, S.M.; Mehra, R.; Sun, X.W.; Varambally, S.; Cao, X.; Tchinda, J.; Kuefer, R.; et al. Recurrent fusion of TMPRSS2 and ETS transcription factor genes in prostate cancer. Science 2005, 310, 644–648.
8. Tomlins, S.A.; Bjartell, A.; Chinnaiyan, A.M.; Jenster, G.; Nam, R.K.; Rubin, M.A.; Schalken, J.A. ETS gene fusions in prostate cancer: From discovery to daily clinical practice. Eur. Urol. 2009,
56, 275–286.
9. Pettersson, A.; Graff, R.E.; Bauer, S.R.; Pitt, M.J.; Lis, R.T.; Stack, E.C.; Martin, N.E.; Kunz, L.; Penney, K.L.; Ligon, A.H.; et al. The TMPRSS2:ERG rearrangement, ERG expression, and prostate cancer outcomes: A cohort study and meta-analysis. Cancer Epidemiol. Biomark. Prev. 2012, 21, 1497–1509.
10. Hessels, D.; Smit, F.P.; Verhaegh, G.W.; Witjes, J.A.; Cornel, E.B.; Schalken, J.A. Detection of TMPRSS2-ERG fusion transcripts and prostate cancer antigen 3 in urinary sediments may improve diagnosis of prostate cancer. Clin. Cancer Res. 2007, 13, 5103–5108.
11. Laxman, B.; Tomlins, S.A.; Mehra, R.; Morris, D.S.; Wang, L.; Helgeson, B.E.; Shah, R.B.; Rubin, M.A.; Wei, J.T.; Chinnaiyan, A.M. Noninvasive detection of TMPRSS2:ERG fusion transcripts in the urine of men with prostate cancer. Neoplasia 2006, 8, 885–888.
12. Tomlins, S.A.; Aubin, S.M.; Siddiqui, J.; Lonigro, R.J.; Sefton-Miller, L.; Miick, S.; Williamsen, S.; Hodge, P.; Meinke, J.; Blase, A.; et al. Urine TMPRSS2:ERG fusion transcript stratifies prostate cancer risk in men with elevated serum PSA. Sci. Transl. Med. 2011, 3, 94ra72. doi:10.1126/scitranslmed.3001970.
13. Le, B.V.; Griffin, C.R.; Loeb, S.; Carvalhal, G.F.; Kan, D.; Baumann, N.A.; Catalona, W.J. [-2]Proenzyme prostate specific antigen is more accurate than total and free prostate specific antigen in differentiating prostate cancer from benign disease in a prospective prostate cancer screening study. J. Urol. 2010, 183, 1355–1359.
14. Jansen, F.H.; van Schaik, R.H.; Kurstjens, J.; Horninger, W.; Klocker, H.; Bektic, J.; Wildhagen, M.F.; Roobol, M.J.; Bangma, C.H.; Bartsch, G. Prostate-specific antigen (PSA) isoform p2PSA in combination with total PSA and free PSA improves diagnostic accuracy in prostate cancer detection. Eur. Urol. 2010, 57, 921–927.
15. Guazzoni, G.; Nava, L.; Lazzeri, M.; Scattoni, V.; Lughezzani, G.; Maccagnano, C.; Dorigatti, F.; Ceriotti, F.; Pontillo, M.; Bini, V.; et al. Prostate-specific antigen (PSA) isoform p2PSA significantly improves the prediction of prostate cancer at initial extended prostate biopsies in patients with total PSA between 2.0 and 10 ng/mL: Results of a prospective study in a clinical setting. Eur. Urol. 2011, 60, 214–222.
16. Stephan, C.; Vincendeau, S.; Houlgatte, A.; Cammann, H.; Jung, K.; Semjonow, A. Multicenter evaluation of [-2]proprostate-specific antigen and the prostate health index for detecting prostate cancer. Clin. Chem. 2013, 59, 306–314.
17. Filella, X.; Foj, L.; Maria Auge, J.; Molina, R.; Alcover, J. Clinical utility of %p2PSA and prostate health index in the detection of prostate cancer. Clin. Chem. Lab. Med.: CCLM/FESCC 2014, doi:10.1515/cclm-2014-0027.
18. Ferro, M.; Bruzzese, D.; Perdona, S.; Marino, A.; Mazzarella, C.; Perruolo, G.; D’Esposito, V.; Cosimato, V.; Buonerba, C.; di Lorenzo, G.; et al. Prostate Health Index (Phi) and Prostate Cancer Antigen 3 (PCA3) significantly improve prostate cancer detection at initial biopsy in a total PSA range of 2–10 ng/mL. PLoS One 2013, 8, e67687.
19. Ferro, M.; Bruzzese, D.; Perdona, S.; Mazzarella, C.; Marino, A.; Sorrentino, A.; di Carlo, A.; Autorino, R.; di Lorenzo, G.; Buonerba, C.; et al. Predicting prostate biopsy outcome: Prostate health index (phi) and prostate cancer antigen 3 (PCA3) are useful biomarkers. Clin. Chim. Acta 2012, 413, 1274–1278.
20. Perdona, S.; Bruzzese, D.; Ferro, M.; Autorino, R.; Marino, A.; Mazzarella, C.; Perruolo, G.; Longo, M.; Spinelli, R.; di Lorenzo, G.; et al. Prostate health index (phi) and prostate cancer antigen 3 (PCA3) significantly improve diagnostic accuracy in patients undergoing prostate biopsy. Prostate 2013, 73, 227–235.
21. Scattoni, V.; Lazzeri, M.; Lughezzani, G.; de Luca, S.; Passera, R.; Bollito, E.; Randone, D.; Abdollah, F.; Capitanio, U.; Larcher, A.; et al. Head-to-head comparison of prostate health index and urinary PCA3 for predicting cancer at initial or repeat biopsy. J. Urol. 2013, 190, 496–501. 22. Stephan, C.; Jung, K.; Semjonow, A.; Schulze-Forster, K.; Cammann, H.; Hu, X.; Meyer, H.A.;
Bogemann, M.; Miller, K.; Friedersdorff, F. Comparative assessment of urinary prostate cancer antigen 3 and TMPRSS2:ERG gene fusion with the serum [-2]proprostate-specific antigen-based prostate health index for detection of prostate cancer. Clin. Chem. 2013, 59, 280–288.
23. Nakanishi, H.; Groskopf, J.; Fritsche, H.A.; Bhadkamkar, V.; Blase, A.; Kumar, S.V.; Davis, J.W.; Troncoso, P.; Rittenhouse, H.; Babaian, R.J. PCA3 molecular urine assay correlates with prostate cancer tumor volume: Implication in selecting candidates for active surveillance. J. Urol. 2008,
179, 1804–1809.
24. Auprich, M.; Chun, F.K.; Ward, J.F.; Pummer, K.; Babaian, R.; Augustin, H.; Luger, F.; Gutschi, S.; Budaus, L.; Fisch, M.; et al. Critical assessment of preoperative urinary prostate cancer antigen 3 on the accuracy of prostate cancer staging. Eur. Urol. 2011, 59, 96–105.
25. Durand, X.; Xylinas, E.; Radulescu, C.; Haus-Cheymol, R.; Moutereau, S.; Ploussard, G.; Forgues, A.; Robert, G.; Vacherot, F.; Loric, S.; et al. The value of urinary prostate cancer gene 3 (PCA3) scores in predicting pathological features at radical prostatectomy. BJU Int. 2012, 110, 43–49.
26. Whitman, E.J.; Groskopf, J.; Ali, A.; Chen, Y.; Blase, A.; Furusato, B.; Petrovics, G.; Ibrahim, M.; Elsamanoudi, S.; Cullen, J.; et al. PCA3 score before radical prostatectomy predicts extracapsular extension and tumor volume. J. Urol. 2008, 180, 1975–1978.
27. Vlaeminck-Guillem, V.; Devonec, M.; Colombel, M.; Rodriguez-Lafrasse, C.; Decaussin-Petrucci, M.; Ruffion, A. Urinary PCA3 score predicts prostate cancer multifocality.
J. Urol. 2011, 185, 1234–1239.
28. Augustin, H.; Mayrhofer, K.; Pummer, K.; Mannweiler, S. Relationship between prostate cancer gene 3 (PCA3) and characteristics of tumor aggressiveness. Prostate 2013, 73, 203–210.
29. Hessels, D.; van Gils, M.P.; van Hooij, O.; Jannink, S.A.; Witjes, J.A.; Verhaegh, G.W.; Schalken, J.A. Predictive value of PCA3 in urinary sediments in determining clinico-pathological characteristics of prostate cancer. Prostate 2010, 70, 10–16.
30. Leyten, G.H.; Hessels, D.; Jannink, S.A.; Smit, F.P.; de Jong, H.; Cornel, E.B.; de Reijke, T.M.; Vergunst, H.; Kil, P.; Knipscheer, B.C.; et al. Prospective multicentre evaluation of PCA3 and TMPRSS2-ERG gene fusions as diagnostic and prognostic urinary biomarkers for prostate cancer.
Eur. Urol. 2014, 65, 534–542.
31. Van Gils, M.P.; Hessels, D.; Hulsbergen-van de Kaa, C.A.; Witjes, J.A.; Jansen, C.F.; Mulders, P.F.; Rittenhouse, H.G.; Schalken, J.A. Detailed analysis of histopathological parameters in radical prostatectomy specimens and PCA3 urine test results. Prostate 2008, 68, 1215–1222.
32. Young, A.; Palanisamy, N.; Siddiqui, J.; Wood, D.P.; Wei, J.T.; Chinnaiyan, A.M.; Kunju, L.P.; Tomlins, S.A. Correlation of urine TMPRSS2:ERG and PCA3 to ERG+ and total prostate cancer burden. Am. J. Clin. Pathol. 2012, 138, 685–696.
33. Van Poppel, H.; Haese, A.; Graefen, M.; de la Taille, A.; Irani, J.; de Reijke, T.; Remzi, M.; Marberger, M. The relationship between Prostate CAncer gene 3 (PCA3) and prostate cancer significance. BJU Int. 2012, 109, 360–366.
34. Liss, M.A.; Santos, R.; Osann, K.; Lau, A.; Ahlering, T.E.; Ornstein, D.K. PCA3 molecular urine assay for prostate cancer: Association with pathologic features and impact of collection protocols.
World J. Urol. 2011, 29, 683–688.
35. Rostad, K.; Hellwinkel, O.J.; Haukaas, S.A.; Halvorsen, O.J.; Oyan, A.M.; Haese, A.; Budaus, L.; Albrecht, H.; Akslen, L.A.; Schlomm, T.; et al. TMPRSS2:ERG fusion transcripts in urine from prostate cancer patients correlate with a less favorable prognosis. APMIS 2009, 117, 575–582. 36. Guazzoni, G.; Lazzeri, M.; Nava, L.; Lughezzani, G.; Larcher, A.; Scattoni, V.; Gadda, G.M.;
Bini, V.; Cestari, A.; Buffi, N.M.; et al. Preoperative prostate-specific antigen isoform p2PSA and its derivatives, %p2PSA and prostate health index, predict pathologic outcomes in patients undergoing radical prostatectomy for prostate cancer. Eur. Urol. 2012, 61, 455–466.
37. Epstein, J.I. Prognostic significance of tumor volume in radical prostatectomy and needle biopsy specimens. J. Urol. 2011, 186, 790–797.
38. Ploussard, G.; Durand, X.; Xylinas, E.; Moutereau, S.; Radulescu, C.; Forgue, A.; Nicolaiew, N.; Terry, S.; Allory, Y.; Loric, S.; et al. Prostate cancer antigen 3 score accurately predicts tumour volume and might help in selecting prostate cancer patients for active surveillance. Eur. Urol. 2011, 59, 422–429.
39. Mouraviev, V.; Villers, A.; Bostwick, D.G.; Wheeler, T.M.; Montironi, R.; Polascik, T.J. Understanding the pathological features of focality, grade and tumour volume of early-stage prostate cancer as a foundation for parenchyma-sparing prostate cancer therapies: Active surveillance and focal targeted therapy. BJU Int. 2011, 108, 1074–1085.
40. Leyten, G.H.; Wierenga, E.A.; Sedelaar, J.P.; van Oort, I.M.; Futterer, J.J.; Barentsz, J.O.; Schalken, J.A.; Mulders, P.F. Value of PCA3 to predict biopsy outcome and its potential role in selecting patients for multiparametric MRI. Int. J. Mol. Sci. 2013, 14, 11347–11355.
41. Semjonow, A.; Kopke, T.; Eltze, E.; Pepping-Schefers, B.; Burgel, H.; Darte, C. Pre-analytical
in vitro stability of [-2]proPSA in blood and serum. Clin. Biochem. 2010, 43, 926–928.
42. Chen, M.E.; Johnston, D.; Reyes, A.O.; Soto, C.P.; Babaian, R.J.; Troncoso, P. A streamlined three-dimensional volume estimation method accurately classifies prostate tumors by volume.
Am. J. Surg. Pathol. 2003, 27, 1291–1301.
43. Vickers, A.J.; Cronin, A.M. Traditional statistical methods for evaluating prediction models are uninformative as to clinical value: Towards a decision analytic framework. Semin. Oncol. 2010,
37, 31–38.
44. Vickers, A.J.; Cronin, A.M.; Begg, C.B. One statistical test is sufficient for assessing new predictive markers. BMC Med. Res. Methodol. 2011, 11, 13. doi:10.1186/1471-2288-11-13.
45. Vickers, A.J.; Elkin, E.B. Decision curve analysis: A novel method for evaluating prediction models. Med. Decis. Mak. 2006, 26, 565–574.
© 2014 by the authors; licensee MDPI, Basel, Switzerland. This article is an open access article distributed under the terms and conditions of the Creative Commons Attribution license (http://creativecommons.org/licenses/by/3.0/).