HAL Id: hal-01765083
https://hal-amu.archives-ouvertes.fr/hal-01765083
Submitted on 29 Oct 2018
HAL is a multi-disciplinary open access
archive for the deposit and dissemination of
sci-entific research documents, whether they are
pub-lished or not. The documents may come from
teaching and research institutions in France or
abroad, or from public or private research centers.
L’archive ouverte pluridisciplinaire HAL, est
destinée au dépôt et à la diffusion de documents
scientifiques de niveau recherche, publiés ou non,
émanant des établissements d’enseignement et de
recherche français ou étrangers, des laboratoires
publics ou privés.
Distributed under a Creative Commons Attribution| 4.0 International License
Inherited GINS1 deficiency underlies growth retardation
along with neutropenia and NK cell deficiency
Julien Cottineau, Molly C. Kottemann, Francis P. Lach, Young-Hoon Kang,
Frederic Vely, Elissa K. Deenick, Tomi Lazarov, Laure Gineau, Yi Wang,
Andrea Farina, et al.
To cite this version:
Julien Cottineau, Molly C. Kottemann, Francis P. Lach, Young-Hoon Kang, Frederic Vely, et al..
Inherited GINS1 deficiency underlies growth retardation along with neutropenia and NK cell
defi-ciency. Journal of Clinical Investigation, American Society for Clinical Investigation, 2017, 127 (5),
pp.1991-2006. �10.1172/JCI90727�. �hal-01765083�
Inherited GINS1 deficiency underlies growth
retardation along with neutropenia and NK cell
deficiency
Julien Cottineau, … , Agata Smogorzewska, Emmanuelle
Jouanguy
Inborn errors of DNA repair or replication underlie a variety of clinical phenotypes. We
studied 5 patients from 4 kindreds, all of whom displayed intrauterine growth retardation,
chronic neutropenia, and NK cell deficiency. Four of the 5 patients also had postnatal growth
retardation. The association of neutropenia and NK cell deficiency, which is unusual among
primary immunodeficiencies and bone marrow failures, was due to a blockade in the bone
marrow and was mildly symptomatic. We discovered compound heterozygous rare
mutations in Go-Ichi-Ni-San (GINS) complex subunit 1 (GINS1, also known as PSF1) in the
5 patients. The GINS complex is essential for eukaryotic DNA replication, and homozygous
null mutations of GINS component–encoding genes are embryonic lethal in mice. The
patients’ fibroblasts displayed impaired GINS complex assembly, basal replication stress,
impaired checkpoint signaling, defective cell cycle control, and genomic instability, which
was rescued by WT GINS1. The residual levels of GINS1 activity reached 3% to 16% in
patients’ cells, depending on their GINS1 genotype, and correlated with the severity of
growth retardation and the in vitro cellular phenotype. The levels of GINS1 activity did not
influence the immunological phenotype, which was uniform. Autosomal recessive, partial
GINS1 deficiency impairs DNA replication and underlies intra-uterine (and postnatal) growth
retardation, chronic neutropenia, and NK cell deficiency.
Introduction
NK lymphocytes are innate lymphoid cells (ILCs) that contribute to protective immunity to viruses in the course of experimental infec-tion in inbred mice (1, 2). In humans, their funcinfec-tion remains unclear,
due to the rarity of well-documented inherited disorders involving a selective and complete lack of NK cells (3, 4). An autosomal reces-sive (AR) and partial deficiency of mini-chromosome maintenance 4 (MCM4) was recently reported in consanguineous kindreds (5, 6). All patients displayed intra- and extrauterine growth retardation, adrenal insufficiency, and a selective lack of CD56dim NK cells. The occurrence of unusually severe but poorly characterized viral infec-tions in some of these patients suggested that human NK cells might be essential for host defense, at least against some viruses, under conditions of natural infection (7). These patients had normal num-bers of other leukocyte subsets, including T and B lymphocytes, which apparently functioned normally. However, subtle functions of leukocytes or non-hematopoietic cells might be altered and have contributed to the observed viral diseases.
Inborn errors of DNA repair or replication underlie a variety of clinical phenotypes. We studied 5 patients from 4 kindreds, all of whom displayed intrauterine growth retardation, chronic neutropenia, and NK cell deficiency. Four of the 5 patients also had postnatal growth retardation. The association of neutropenia and NK cell deficiency, which is unusual among primary immunodeficiencies and bone marrow failures, was due to a blockade in the bone marrow and was mildly symptomatic. We discovered compound heterozygous rare mutations in Go-Ichi-Ni-San (GINS) complex subunit 1 (GINS1, also known as PSF1) in the 5 patients. The GINS complex is essential for eukaryotic DNA replication, and homozygous null mutations of GINS component–encoding genes are embryonic lethal in mice. The patients’ fibroblasts displayed impaired GINS complex assembly, basal replication stress, impaired checkpoint signaling, defective cell cycle control, and genomic instability, which was rescued by WT GINS1. The residual levels of GINS1 activity reached 3% to 16% in patients’ cells, depending on their GINS1 genotype, and correlated with the severity of growth retardation and the in vitro cellular phenotype. The levels of GINS1 activity did not influence the immunological phenotype, which was uniform. Autosomal recessive, partial GINS1 deficiency impairs DNA replication and underlies intra-uterine (and postnatal) growth retardation, chronic neutropenia, and NK cell deficiency.
Inherited GINS1 deficiency underlies growth retardation
along with neutropenia and NK cell deficiency
Julien Cottineau,1,2 Molly C. Kottemann,3 Francis P. Lach,3 Young-Hoon Kang,4 Frédéric Vély,5,6 Elissa K. Deenick,7 Tomi Lazarov,8
Laure Gineau,1,2 Yi Wang,1,2 Andrea Farina,4 Marie Chansel,2,9 Lazaro Lorenzo,1,2 Christelle Piperoglou,5,6 Cindy S. Ma,7
Patrick Nitschke,2,10 Aziz Belkadi,1,2 Yuval Itan,11 Bertrand Boisson,1,2,11 Fabienne Jabot-Hanin,1,2 Capucine Picard,1,2,11,12,13
Jacinta Bustamante,1,2,11,12 Céline Eidenschenk,1,2 Soraya Boucherit,1,2 Nathalie Aladjidi,14 Didier Lacombe,15 Pascal Barat,16
Waseem Qasim,17 Jane A. Hurst,18 Andrew J. Pollard,19 Holm H. Uhlig,19,20 Claire Fieschi,21,22 Jean Michon,23 Vladimir P. Bermudez,4
Laurent Abel,1,2,11 Jean-Pierre de Villartay,2,9 Frédéric Geissmann,8 Stuart G. Tangye,7 Jerard Hurwitz,4 Eric Vivier,5,6
Jean-Laurent Casanova,1,2,11,13,24 Agata Smogorzewska,3 and Emmanuelle Jouanguy1,2,11
1Laboratory of Human Genetics of Infectious Diseases, Necker Branch, INSERM U1163, Paris, France. 2Paris Descartes University, Imagine Institute, Paris, France. 3Laboratory of Genome Maintenance, The
Rockefeller University, New York, New York, USA. 4Molecular Biology Program, Memorial Sloan-Kettering Cancer Center, New York, New York, USA. 5Aix Marseille University, CNRS, INSERM, CIML, Marseille,
France. 6Assistance Publique–Hôpitaux de Marseille, Hôpital de la Conception, Service d’Immunologie, Marseille, France. 7Immunology Division, Garvan Institute of Medical Research, and St. Vincent’s
Clinical School, University of New South Wales, Sydney, New South Wales, Australia. 8Centre for Molecular and Cellular Biology of Inflammation (CMCBI), King’s College London, London, United Kingdom. 9Laboratory of Genome Dynamics in the Immune System, INSERM U1163, Paris, France. 10Bioinformatics Unit, Assistance Publique–Hôpitaux de Paris (AP-HP), Necker Hospital for Sick Children, Paris,
France. 11St. Giles Laboratory of Human Genetics of Infectious Diseases, Rockefeller Branch, The Rockefeller University, New York, New York, USA. 12Center for the Study of Primary Immunodeficiencies and 13Pediatric Hematology-Immunology Unit, AP-HP, Necker Hospital for Sick Children, Paris, France. 14Pediatric Hemato-Oncology Unit, Bordeaux Hospital, Bordeaux, France. 15Bordeaux University, EA4676,
Laboratoire de Maladies Rares: Génétique et Métabolisme (MRGM), and Centre Hospitalier Universitaire (CHU) de Bordeaux, Medical Genetics, Bordeaux, France. 16Pediatric Endocrinology and Diabetology
Unit, Clinical Investigation Center (CIC 05), Bordeaux Hospital, Bordeaux, France. 17Molecular and Cellular Immunology, Institute of Child Health and Great Ormond Street Hospital, London, United Kingdom. 18North East Thames Genetics Service, Great Ormond Street Hospital, London, United Kingdom. 19Department of Paediatrics, University of Oxford, Children’s Hospital, Oxford, United Kingdom. 20Translational
Gastroenterology Unit, University of Oxford, John Radcliffe Hospital, Oxford, United Kingdom. 21Adult Immunopathology Unit, AP-HP, Saint-Louis Hospital, Paris, France. 22Paris Diderot University, Paris,
France. 23Department of Pediatric Oncology, Institut Curie, Paris, France.24Howard Hughes Medical Institute, New York, New York, USA.
Related Commentary: p. 1616
Authorship note: M.C. Kottemann, F.P. Lach, Y.H. Kang, and F. Vély contributed equally to
this work. J. Hurwitz and E. Vivier contributed equally to this work. E.K. Deenick, T. Laza-rov, L. Gineau, and Y. Wang contributed equally to this work. J.L. Casanova, A. Smogorze-wska, and E. Jouanguy contributed equally to this work.
gous mutations of GINS1 in these two sisters, and in three other unrelated patients with similar clinical and immunological phe-notypes who were subsequently recruited. Interestingly, although MCM4 and GINS1 are functionally related, the two corresponding deficits only partly overlap biologically and clinically.
Results
Clinical and immunological features of the patients. The clinical
features of the 5 patients from 4 kindreds studied are described in Methods and in the supplemental material (Supplemental Fig-ures 1–3 and Supplemental Tables 1 and 2; supplemental mate-rial available online with this article; https://doi.org/10.1172/ JCI90727DS1). Briefly, the patients presented with growth retar-Unexpectedly, we found that maturation of CD56bright NK
cells into CD56dim NK cells was highly dependent on MCM4 and, therefore, probably dependent on cell proliferation (5). We pur-sued the genetic dissection of human inborn errors of NK cells by investigating two French sisters (born to unrelated parents), who, as we previously reported, displayed intrauterine growth retarda-tion, neutropenia, and a low NK cell count (8). We also previously described a possible mechanism of NK cell deficiency (NKD) in these siblings, associated with impaired IL-2–dependent survival of T lymphocytes (9). In the absence of candidate gene and link-age information, we took advantlink-age of whole exome sequencing (WES) to search for the underlying genetic etiology (10). We report here the discovery and characterization of compound
heterozy-Figure 1. NK cell and neutrophil deficiency. (A) Representative flow cytometry plots of peripheral total NK cells in PBMCs from a travel control and 4 patients. (B) Quantification, by flow cytometry, of peripheral total, CD56bright, and CD56dim NK cells, in the travel controls and patients (*P < 0.05, **P < 0.01,
***P < 0.001; 1-way bidirectional ANOVA). Het, heterozygote. (C) NK cell expansion upon cytokine stimulation was assessed by culture of PBMCs with complete medium supplemented or not with IL-2 (100 U/ml) or IL-15 (10 ng/ml) for 3.5 days. (D) Quantification, by flow cytometry, of peripheral total ILC and ILC1, ILC2, and ILC3 subsets in CD45+ PBMCs, MAIT (CD3+Vα7.2+CD161hi) cells and NKT (CD3+Vα24+Vβ11+) cells in the travel controls and patients. ns, not
response to stimulation with mitogenic phytohemagglutinin (PHA), and low but not abolished in response to recall anti-gens (Supplemental Table 2). Serum IgA levels were high, IgM levels were low, and IgG levels were low or in the nor-mal range (Supplemental Figure 2D). Moreover, all patients displayed an almost complete lack of circulating NK cells, in terms of both absolute numbers (1 to 6/mm3, for a norm above 100/mm3) and proportions of lymphocytes (0.1% to 0.5%, for a norm above 5%) (Figure 1, A and B, and Supple-mental Table 3). We further investigated the phenotype of the few NK cells in the patients’ blood. In contrast to observa-tions for patients with partial MCM4 deficiency, all patients tested here had very low proportions of both the CD56bright and CD56dim subsets (Figure 1B). In addition, after 4 days of IL-2 or IL-15 activation of peripheral blood mononuclear cells (PBMCs) in vitro, no increase in the proportion of NK cells (0.1%–0.2% to 0.1%–0.2%) was observed with respect to controls (0.4% to 4%) (Figure 1C), suggesting that their NK cell deficiency could not be overcome by cytokine treatment. We also investigated other circulating ILCs and invariant T lymphocyte subsets in 3 patients. The numbers of all circu-lating ILCs were low in P4 and P5, while P2 had low ILC2 and ILC3 levels but normal numbers of ILC1 cells (Figure 1D). P2, P3, and P4 also had decreased proportions of mucosal- associated invariant T (MAIT) and NKT cells (Figure 1D). Chronic neutropenia was noted in all these patients, from infancy onward (Figure 1E). The oxidative burst of P2 neutro-phils was normal, as measured by hydrogen peroxide produc-tion in response to PMA (Supplemental Figure 3E). All other myeloid cells, including the plasmacytoid DC (pDC), myeloid DC (mDC), and monocyte subsets, were present at normal levels (Supplemental Figure 3F). We investigated whether neutropenia was due to a central or peripheral event by ana-lyzing bone marrow aspirates. As shown in Figure 1F, the pro-portion of myeloblasts was normal in all patients. However, promyelocyte proportions were high, and metamyelocytes and neutrophils were reduced. Interestingly, treatment with granulocyte colony-stimulating factor (G-CSF) restored the numbers of both metamyelocytes and mature neutrophils (Figure 1F), suggesting that there might be an imbalance between proliferation and apoptosis that could be overcome functionally. This is consistent with both the virtual lack of clin-ical signs normally associated with chronic neutropenia in these patients and the normal neutrophil counts occasionally mea-sured in the course of bacterial infection. The similarity in clini-cal and immunologiclini-cal phenotypes between these 5 patients and MCM4-mutated patients suggested that they might have a genetic disease due to mutations in a gene related to MCM4 or involved in DNA replication.
Compound heterozygous GINS1 mutations in kindred A. We
investigated siblings P1 and P2 by WES (Supplemental Table 4). We found 15 homozygous and 452 heterozygous coding vari-ants common to both sisters that had not previously been report-ed at a minor allele frequency (MAF) >1% in any database (1000 Genomes, http://www.internationalgenome.org; HapMap, http:// www.sanger.ac.uk/resources/downloads/human/hapmap3.html; dbSNP, https://www.ncbi.nlm.nih.gov/projects/SNP/) or in our dation (intra- and extrauterine) and mild facial dysmorphism,
except patient 4 (P4; no extrauterine growth retardation), togeth-er with infections with viruses but also some documented cases of bacterial infection; P2 had osteosarcoma; P3 presented with protein-losing enteropathy, hypothyroidism, and some features of premature aging; P5 had autoimmune hemolytic anemia and glau-coma. During the first 3 years of life, the two patients tested (P2 and P3) displayed low counts of blood T cells, especially CD8+ T cells. The patients had otherwise low or normal numbers of circu-lating T and B lymphocytes (except P3, who had lower numbers), and normal proportions of naive and memory CD4+ and CD8+ T lymphocytes, Th lymphocyte subsets, and γδ-T lymphocytes (Sup-plemental Figure 3, A–C). There were respective increases and decreases in proportions of naive and memory B cell subsets, but the frequency of memory B cells that underwent class switching in vivo was normal (Supplemental Figure 3D). Proliferation of T lymphocytes from all patients in vitro was slightly decreased in
Figure 2. Identification of GINS1 mutations. (A) Pedigrees of the 4 families, showing allele segregation. The index case is indicated by an arrow, and “E?” indicates an unknown genotype. The age of each patient is indicated in parenthe-ses. (B) Schematic diagram of the structure of the GINS1 cDNA, consisting of 7 exons, indicating the positions of mutations. The arrows show the primers used for cDNA amplification. Electrophoresis of PCR products from GINS1 cDNA for a control (C+), P2, P2’s father (F), P2’s mother (M), P3, P4, and P5. Ex1, exon 1. (C) Schematic diagram of the relative expression levels of each allele corresponding to the various genotypes as assessed by cloning of the cDNA molecules from patient fibroblasts.
a c.455G>A substitution in exon 6 leading to the replacement of a cysteine with a tyrosine residue in position 152 (p.C152Y), which is predicted to be damaging (CADD score 32) (Figure 2A and Supplemental Figure 4, A and B). Overall, the 5 patients from 4 unrelated kindreds studied were found to be compound hetero-zygous for only 4 rare variants, including two missense (p.R83C and p.C152Y) and two 5′ UTR nucleotide substitutions (at posi-tions –48 and –60 relative to the ATG). Only the R83C substitu-tion was found in 1000 Genomes, with a low MAF (4 per 10,000). Both the R83C and C152Y substitutions were reported in the Exome Aggregation Consortium (ExAC) database (http://exac. broadinstitute.org/), with low MAFs of 9 and 0.25 per 10,000, respectively. The 5′ UTR variants were not reported in any data-bases, nor were they detected in 945 healthy controls from 52 eth-nic groups from the Centre d’Etudes du Polymorphisme Humain– Human Genome Diversity (CEPH-HGD) panel. There are currently no double-heterozygous non-synonymous mutations, and there is only one homozygous mutation (E35G) found in our in-house and public databases with a MAF of 3.8 and 1.4 per 1,000 in 1000 Genomes and ExAC, respectively (Supplemental Figure 4B and Supplemental Tables 5 and 6). The gene damage index (GDI) of 2.48 for GINS1 is intermediate, and its neutrality index estimate of 76.2 shows that it is under strong positive selection (22, 23). These data suggest that the 4 variants identified are more like-ly to be rare pathogenic mutations than irrelevant polike-lymorphisms. Haplotype analysis at the GINS1 locus suggested that the 2 recur-rent alleles (R83C and c.–48C>G) were not due to founder effects and that the patients did not share a common ancestor (data not shown). In the 4 kindreds, familial segregation patterns of the
GINS1 genotype and clinical phenotype were consistent with AR
inheritance with complete penetrance (Figure 2A).
The 5′ UTR mutations in GINS1 affect mRNA splicing and are leaky. We assessed the impact of the 5′ UTR variants by
study-ing GINS1 mRNAs in cell lines derived from all patients. HPVE6/ E7-transformed fibroblast cell lines (E6/E7-fibroblasts) contained normal or reduced levels of GINS1 mRNA, as assessed by quanti-tative real-time RT-PCR (qPCR) (Supplemental Figure 4C). Thus, the mutations might affect the production of GINS1 mRNA. As the 5′ UTR mutations were predicted to create new donor splice sites, we searched for alternative splicing products. Amplification of the own database of 3,000 patients with various infectious diseases
(Supplemental Table 5). The most striking candidates were hetero-zygous variants of GINS1. This gene is functionally related to MCM4 (11). GINS1 (also known as PSF1) belongs along with GINS2 (also known as PSF2), GINS3 (also known as PSF3), and GINS4 (also known as SLD5) to the heterotetrameric Go-Ichi-Ni-San (GINS) complex, which, together with the MCM complex, is required for DNA replication (12, 13). To ensure that the entire set of genetic information is replicated once, and only once, per division, DNA replication is tightly regulated and coordinated with the cell cycle (14–16). The first step is the recruitment of CDT1, CDC6, and an inactive form of the MCM complex to the origin recognition com-plex (ORC) at origins of replication, to yield the pre-replicative complex (pre-RC) during the G1 phase (17). The second step is the recruitment of CDC45 and the GINS complex, to form the CDC45-MCM-GINS (CMG) complex, during the transition of G1/S phase, to trigger the firing and the elongation of replication forks in S-phase (12, 13, 18, 19). Sanger sequencing of GINS1 in patients and their par-ents showed that P1 and P2 were compound heterozygous for the two following variants: a 5′ UTR variation (c.–48C>G) predicted to create a new donor splice site (NetGene2 [http://www.cbs.dtu.dk/ services/NetGene2/] score 0.85; Combined Annotation Depen-dent Depletion [CADD, http://cadd.gs.washington.edu/] score 3.6, for a GINS1-specific mutation significance cutoff [MSC, http://lab. rockefeller.edu/casanova/MSC] score of 16.5) and a missense vari-ation (c.247C>T) in exon 4, resulting in the replacement of an argi-nine with a cysteine residue in position 83 (p.R83C), a change pre-dicted to be damaging (CADD score 35 for a GINS1-specific MSC of 16.5) (20, 21) (Figure 2A and Supplemental Figure 4, A and B).
Compound heterozygous GINS1/PSF1 mutations in kindreds B, C, and D. Subsequently, we identified compound heterozygous GINS1 rare mutations by WES in 3 other, unrelated patients from
kindreds B, C, and D. Their parents were all heterozygous for one of each of the 4 mutations. P3 has a substitution in the 5′ UTR, at position c.–60A>G (Figure 2A and Supplemental Figure 4, A and B), which is predicted to create a new donor splice site (NetGen2 score 0.87, CADD score 10.4). P3 and P5 both have the missense substitution of P1 and P2 (c.247C>T, p.R83C) in exon 4 (Figure 2A and Supplemental Figure 4, A and B), while P4 and P5 both have the 5′ UTR mutation of P1 and P2 (c.–48C>G). Finally, P4 also has
Figure 3. The GINS1 mutants are associated with CMG complex loss of function or instability. (A) Western blot analysis of total protein extracts from HEK293T cells expressing GINS1 cDNAs. Cells were not transfected (NT), mock transfected (MO), or transfected with pCMV6 empty (EV), pCMV6 GINS1 WT-Flag (WT), pCMV6 GINS1 R83C-Flag (R83C), pCMV6 GINS1 delEx1-Flag (ΔE1), or pCMV6 GINS1 C152Y-Flag (C152Y), with antibodies against Flag-tag and GINS1. An antibody against α-tubulin was used as a loading control. (B) Western blot analysis of total protein extracts from HEK293T cells not transfected, mock transfected, or transfected with pCMV6 empty vector (EV), pCMV6 GINS1 WT- or ΔE1-Flag (WT, ΔE1), pCMV6 GINS1 WT- or ΔE1-ATG1-Flag (WT- or ΔE1-ATG1), pCMV6 GINS1 WT or ΔE1-ATG2-Flag (WT- or ΔE1-ATG2), pCMV6 GINS1 WT or ΔE1-ATG3-Flag (WT- or ΔE1-ATG3), pCMV6 GINS1 WT or ΔE1-AT-G1+2+3-Flag (WT- or ΔE1-ATG1,2,3) vectors. An antibody against α-tubulin was used as a loading control. (C) Western blot analysis of GINS1 expression on total protein extracts from patient and control E6/E7-fibroblasts. An antibody against GAPDH was used as a loading control. (D) Western blot analysis of GINS2, GINS3, GINS4, and MCM4 in total protein extracts from patient and control E6/E7-fibroblasts. An antibody against GAPDH was used as a loading control. (E) Western blot analysis of GINS1 and GINS3 expression in total protein extracts from control and P2 E6/E7-fibroblasts lentiviral transduced by empty vector (EV), GINS1-WT (WT), GINS1-R83C (R83C), or GINS1-ΔE1 (ΔE1) or not transduced (NT). An antibody against GAPDH was used as a loading control. Results in A–E are representative of 3 independent experiments. (F) Total protein extracts from HeLa cells transfected with pIRESpuroHF-GINS1 WT or mutant constructs (R83C, ΔE1, C152Y) encoding N-terminally His6Flag2-tagged proteins were subjected to immunoprecipitation with an antibody
against the Flag tag, in the presence (+Flag) or absence of the 3XFlag peptide. Western blotting was performed with antibodies against the Flag tag, GINS3, and GINS4. Results are representative of 4 independent experiments. (G) Left: Purification of the CMG complex from Sf9 insect cells co-infected with viruses expressing the 11 CMG subunits, including GINS1 WT or C152Y, as described in Methods. Gradient fractions were subjected to SDS-PAGE separation followed by silver staining: 5 μl for GINS1 WT and 15 μl for GINS1 C152Y. Right: The peak fractions of both CMG (WT or C152Y) purification (5 μl fraction 7) were subjected to SDS-PAGE separation. Results are representative of 2 independent experiments.
5′ UTR of the GINS1 cDNA from all patients, heterozygous indi-viduals and control EBV-B cell lines or E6/E7-fibroblasts yielded a product of the expected MW for all individuals and a product with a lower MW only for individuals carrying a 5′ UTR mutation (Fig-ure 2B). Sequencing of this product confirmed that it was a trun-cated form of GINS1 cDNA, with two forms corresponding to a deletion of 123 or 135 nucleotides from the c.–48C>G or c.–60A>G variant to the beginning of exon 2, respectively (Supplemental Fig-ure 4D). The canonical translation initiation codon is located in exon 1, so these mutations are predicted to be deleterious. We fur-ther characterized the impact of the two 5′ UTR variants on mRNA splicing by analyzing the full-length GINS1 cDNAs obtained from the E6/E7-fibroblasts of patients and controls by PCR. We
quan-tified the various cDNA species by cloning and sequencing 100 individual GINS1 cDNA molecules from P2, P3, P4, and P5 E6/E7- fibroblasts. About 30% of GINS1 clones carried one of the mis-sense mutations, suggesting that these mRNAs are stable. We found that 7%, 3%, 10%, and 8% of full-length cDNAs, respec-tively, carried the 5′ UTR mutation in P2, P3, P4, and P5 (Figure 2C), suggesting that splicing using the new donor splice site cre-ated by the mutations was not fully efficient. The principal splic-ing event was the deletion of 123 or 135 bp, as described above, but other types of aberrant splicing were also observed (data not shown). These results suggest that the two 5′ UTR variants do not abolish the production of the full-length transcript, allowing about 5%–10% residual expression of the full-length mRNA
correspond-Figure 4. Abnormal nuclear structure and cell cycle defects in primary cells of patients with
GINS1 mutations. (A) Nuclear
abnormalities visualized and quantified in 100 cells analyzed by fluorescence microscopy after DAPI staining on primary fibro-blasts. Left: Images illustrating the different nucleus morphol-ogies observed in patients’ cells. Right: Cells were scored as normal or having cytokinesis abnormalities (1), micronuclei (2), multi-lobed nuclei (3), and nuclei with grossly abnormal morphology (4) (n = 3; 3 inde-pendent controls in each experi-ment). (B) Left: Image illustrat-ing the increased nucleus size in P3 versus a control. Right: Measurement of nucleus area with ImageJ software after DAPI staining of primary fibroblasts (***P < 0.001; 1-way bidirection-al ANOVA). (C) Cell cycle analysis by BrdU/propidium iodide stain-ing of unsynchronized primary fibroblasts from healthy control (CTL) and 3 patients (P2, P3, and P4). Results are representative of 3 independent experiments. (D) Growth curve (left) and viability (right) of primary fibro-blasts from 5 healthy controls and 3 patients (P2, P3, and P5). Results are representative of 2 independent experiments.
ing to the WT coding region in heterozygous cells, relative to the levels in control cells. Thus, although deleterious, these variants are therefore hypomorphic, potentially accounting for the live birth of the patients, while targeted deletion of Gins1 causes early embryonic lethality in mice (24).
GINS1 protein production from the mutant alleles. We
investi-gated the proteins encoded by the mutant GINS1 alleles by trans-fecting HEK293T cells with various expression vectors carrying C- terminally Flag-tagged WT or mutant GINS1 cDNAs, such as the R83C and C152Y variants, and the most common abnormal prod-uct of the two 5′ UTR mutations (deletion of exon 1, designated as ΔE1). As expected, WT, R83C, and C152Y variant cDNA encoded a single full-length 26-kDa protein (Figure 3A). By contrast, cells transfected with ΔE1 generated lower-MW products, suggesting that translation was initiated from a downstream ATG. There are 3 putative ATG codons in the ΔE1 construct, in positions 36, 106, and 111, giving rise to proteins of approximately 22, 16, and 14
kDa, respectively. We investigated the possibility that these lower- MW proteins result from downstream initiation by transfect-ing HEK293T cells with various Flag-tagged expression vectors of WT and various ΔE1 GINS1 cDNAs carrying different methi-onine-to-glycine substitutions: M36G ATG1), M106G (ΔE1-ATG2), M111G (ΔE1-ATG3), or all 3 mutations (ΔE1-ATG1-3) (Fig-ure 3B). Western blots with anti-Flag and anti-GINS1 antibodies revealed 3 proteins of ~22, ~16, and ~14 kDa in ΔE1-transfected cells, not detectable with an antibody raised against the N- terminus of GINS1 (data not shown), with one of these proteins in each case selectively absent from cells transfected with ΔE1-ATG1, ΔE1-ATG2, or ΔE1-ATG3. None of these proteins were detected in ΔE1-ATG1-3–transfected cells (Figure 3B). Thus, the alternatively spliced mRNAs are competent for the translation re-initiation from 3 different ATG codons downstream from the original ATG codon.
Impaired expression of GINS1 protein and some GINS complex components. GINS1 forms a highly conserved heterotetrameric
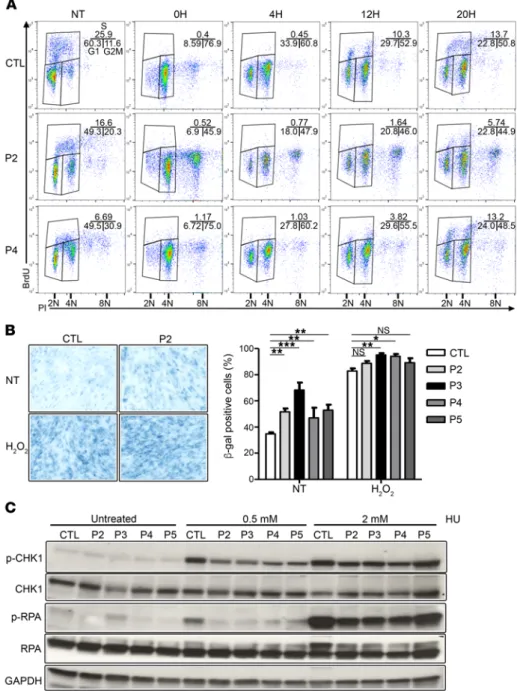
Figure 5. GINS1 mutations are associated with poor ATR pathway activation. (A) Cell cycle analysis by BrdU/propidium iodide staining on E6/E7-fibroblasts from a healthy control (CTL) and 2 patients (P2 and P4) from the indicated time points (0, 4, 12, to 20 hours) after nocodazole synchronization. Results are representative of 3 independent experiments. (B) Percentage of E6/E7- fibroblasts from controls and patients posi-tive for senescence-associated β-gal activity (n = 3, 300 cells analyzed/experiment), as determined by microscopy. (*P < 0.05, **P < 0.01, ***P < 0.001; 1-way bidirectional ANOVA). Original magnification, ×20. (C) Phosphorylation of CHK1 and RPA, assessed by Western blot analysis of total protein extracts from untreated or treated (incuba-tion for 20 hours with 0.5 or 2 mM HU) E6/ E7-fibroblasts from controls and patients, with antibodies against P-CHK1, P-RPA, CHK1, and RPA. GAPDH was used as a load-ing control. The data shown are representa-tive of 3 independent experiments.
of the GINS complex, but probably not of the MCM com-plex. The complementation of the expression levels of oth-er components of the GINS complex also confirms that the
GINS1 mutations are deleterious.
Impaired function of the N-terminal-truncated and mis-sense GINS1 proteins. We assessed the functional
conse-quences of each GINS1 mutation by studying the formation of the GINS complex in transfection experiments. The mutant proteins were produced in HeLa cells, in which the R83C and ΔE1 proteins failed to form the 4-subunit GINS complex (Figure 3F), unlike the WT and C152Y pro-teins. These results are consistent with the crystal structure of human GINS1 (18). Indeed, the N-terminus (or alpha helix–rich [A] domain; residues 1–145) of GINS1 has been implicated in interactions with GINS3 and GINS4, whereas the C-terminus (or beta strand–rich [B] domain; residues 146–196) is dispensable for GINS complex formation (18, 26). However, Chang et al. suggested that the B-domain may be important for interactions with GINS complex partners, such as MCMs, CDC45, or DNA polymerases (18), and Sengupta et al. have shown that in yeast, the C- terminus of GINS1 interacts with DPB2, a subunit of DNA polymerase ε (27). The C152 amino acid is located in the B-domain; we therefore investigated CMG complex for-mation and its binding to DNA. In a baculoviral expression system using Sf9 insect cells, CMG complex formation with the C152Y protein was only 17% of that observed with the WT protein (Figure 3G), despite the production of similar amounts of the WT and C152Y proteins (Supplemental Fig-ure 5A) and the assembly of GINS complexes (FigFig-ure 3F). We investigated the consequences of the C152Y mutation for the CMG complex further by measuring the ATPase and helicase (Supplemental Figure 5, B and C) activities of the mutant complex in vitro. No differences in the specific activity of the CMG-WT and CMG-C152Y mutant com-plexes were observed, suggesting that the C152Y mutation affects the formation of the CMG complex but not its activ-ity once it has been formed. These results show that the R83C and C152Y alleles are loss-of-function and hypomor-phic, respectively, in terms of their functional impact on GINS and CMG complex formation. The two 5′ UTR mutations are hypomorphic due to residual correct splicing leading to production of a small amount of WT mRNA, with the N-truncated products being loss-of-function. Our findings indicate that the 5 patients are compound heterozygous for 2 deleterious GINS1 alleles, at least one of which is hypomorphic (C152Y, c.–48C>G, c.–60A>G) and no more than one of which is loss-of-function (R83C).
Nuclear and cell cycle abnormalities in primary GINS1- deficient fibroblasts. The maintenance of genomic integrity
requires complete and accurate DNA replication (14–16). A pre-vious study showed that the in vitro depletion of GINS2 in asyn-chronous HeLa cells promotes an aberrant nuclear morphology and chromosome mis-segregation defects (28). We investigated these phenotypes in the patients’ cells, with DAPI staining on dermal primary fibroblasts at an early passage. Abnormal nucle-ar morphology was observed in GINS1-deficient cells, including micronuclei, as well as misshapen and multilobed nuclei (Fig-complex with GINS2, GINS3, and GINS4, known as the GINS
com-plex (18, 19). Overexpression experiments in NIH3T3 cells showed that GINS1 expression levels might affect the levels of the other GINS complex components (25). For this reason, all GINS pro-teins levels in E6/E7-fibroblasts from controls and patients were assessed. Cells from patients had lower GINS1 protein levels than control cells (40% of WT on average, ranging from 29% to 53%), suggesting that both 5′ UTR and missense mutations affected pro-tein levels (Figure 3C and Supplemental Table 7). Interestingly, GINS3 and GINS4 levels were also lower in the E6/E7-fibroblasts of patients (17% of WT on average, ranging from 10% to 27%, and 65%, ranging from 44% to 88%, respectively), whereas GINS2 and MCM4 levels were normal (Figure 3D and Supplemental Table 7). Lentiviral transduction of P2 E6/E7-fibroblasts with WT GINS1, but not the empty vector, R83C, or ΔE1-GINS1 allele, restored GINS1 and GINS3 expression, as assessed by Western blotting (Figure 3E). Thus, GINS1 contributes to the stability of other components
Figure 6. GINS1 mutations are associated with increased DNA damage. Top: E6/ E7-fibroblasts were seeded on glass coverslips before treatment with 0.5 or 2 mM HU for 20 hours or left untreated. Cells were fixed before staining with γH2AX and 53BP1 antibodies and DAPI. Bottom: Quantification of slides for percentage of cells with at least 3 foci. Values represent the mean averages ± SEM of scoring from 3 independent experiments (*P < 0.05, **P < 0.01, ***P < 0.001; 1-way bidirectional ANOVA).
of GINS1-deficient E6/E7-fibroblasts to replication stress, we evaluated CHK1 and RPA phosphor-ylation after treatment with hydroxyurea (HU). Although HU treatment led to robust induction of CHK1 and RPA phosphorylation in control cells, that response was much more muted in GINS1- deficient cell lines (36% and 45% [P-CHK1], 48% and 75% [P-RPA] on average of controls) (Figure 5C and Supplemental Table 8). Replicative stress may also lead to genomic instability. We evaluated the presence/accumulation of DNA damage markers, such as the phosphorylation of γH2AX and 53BP1, with or without HU treatment, by immunofluo-rescence. We observed higher numbers of spon-taneous γH2AX and 53BP1 foci in the P2, P3, and P5 E6/E7-fibroblasts than in control fibroblasts (Figure 6), suggesting an increase in basal replica-tion stress and DNA damage when GINS1 is defi-cient. P4 cells, with higher levels of functional GINS1, displayed an intermediate phenotype in this assay. HU treatment increased markers of damage in both control and patient cells (Figure 6), suggesting that the ataxia telangiectasia mutated (ATM) pathway may be compensating in patients’ cells. To test ATM activity, we assessed the phosphorylation of CHK2 by Western blot analy-sis following treatment with phleomycin, which creates dsDNA breaks. We observed normal induction of CHK2 phosphorylation in patients’ E6/E7-fibroblats, as compared with controls (Supple-mental Figure 6). These results indicate that ataxia telangiectasia and Rad3-related protein–dependent (ATR-dependent), but not ATM-dependent, signaling is defective when cells do not have a full complement of CMG complexes. Levels of GINS/CMG complexes below 10% of those in controls were associated with a basal induction of replication stress and impaired ATR/CHK1 pathway activation upon HU treatment, while only an impairment of ATR/CHK1 pathway induction, but no basal replication stress, was observed when complex levels were between 15% and 20% of control levels (Table 1).
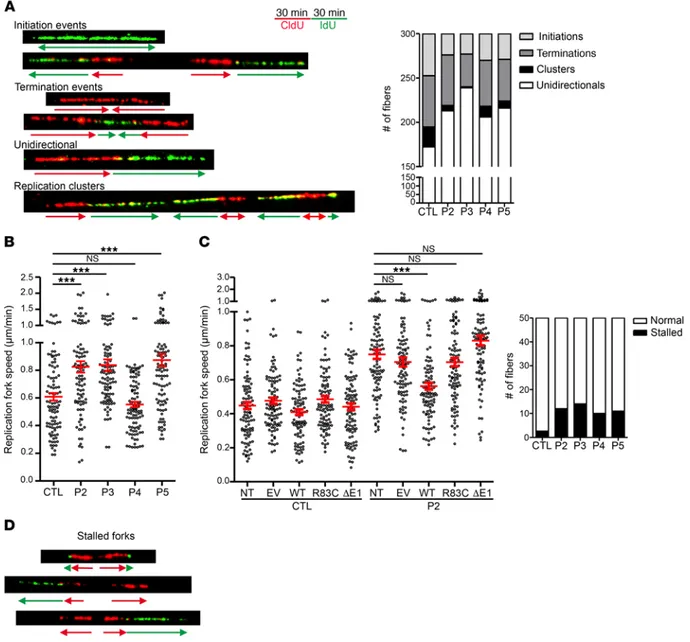
Abnormal replication pattern in cells deficient in GINS1. GINS
complex recruitment is essential for replication origin firing (13, 31). To directly investigate replication patterns in cells deficient for GINS1, we carried out DNA fiber combing analysis (Figure 7A) (32, 33). Assessment of 300 independent DNA fibers per cell line revealed greatly decreased numbers of replication clusters and few-er bidirectional replication forks in cells from patients, when com-pared with those from controls (Figure 7A). This most likely reflects a smaller number of firing replication forks in the patients’ cells. Interestingly, analysis of 50 initiation bidirectional forks showed higher replication rates in E6/E7-fibroblasts of all patients except P4 (Figure 7B), suggesting that the replication speed is increased to compensate for the decreased number of active replication forks. Such a compensatory effect has already been reported in vitro, when the dNTP levels were increased or decreased by chem-ical treatments (34, 35). Importantly, expression of the WT GINS1 allele significantly decreased the replication speed, bringing it into WT range, whereas expression of the mutant R83C or ΔE1 alleles did not (Figure 7C). Furthermore, assessment of 50 independent initiating bidirectional forks showed an increase in stalled forks ure 4A). Moreover, cell population analysis showed that GINS1-
deficient cells had a significantly larger mean nuclear size (Figure 4B), suggesting an impaired cell cycle. This result is consistent with the finding that the depletion of GINS1 and GINS2 is associ-ated with an impaired S-phase progression in human dermal fibro-blasts (28). We further analyzed the cell cycle in unsynchronized primary fibroblasts from 3 of 4 patients. There were decreased percentages of cells in G1 phase and increased percentages of G2/M cells in patients, as compared with controls, with the most pronounced phenotype in P3 cells (Figure 4C), which also had the largest mean nuclear size. In addition, higher proportions of cells with abnormal DNA content were observed in P2 and P3, but not P4 (Figure 4C). Finally, primary fibroblasts from GINS1- deficient patients proliferated more slowly but displayed a similar death rate, as estimated by trypan blue staining, compared with their WT counterparts (Figure 4D). Altogether, these morpho-logical changes and cell growth characteristics are suggestive of senescent cells (29), due to an impaired DNA replication.
DNA damage and checkpoint signaling in patient cells. To
fur-ther study the proliferation defect, we analyzed the progression of the normal cell cycle in E6/E7-fibroblasts after release from nocodazole, which synchronizes cells in M phase. At 4 hours after release by mitotic shake-off, a lower proportion of patients’ cells were in G1 phase, as compared with controls. In addition, at 12 hours after release, only 2%–3% of patients’ cells were in S phase, compared with 8%–10% of the controls, and 20 hours after release, the proportion of cells in S phase was similar in controls and P4, which has the greatest GINS1 expression level, but was still low in P2 (Figure 5A). We also investigated whether a senescence-like state may occur prematurely in E6/E7-fibroblasts from patients by carrying out β-galactosidase (β-gal) staining in the absence or presence of H2O2 (120 μM). The analysis showed that β-gal stain-ing in untreated cells was higher in fibroblasts from patients than from controls (Figure 5B), indicative of increased senescence. The phenotype in G2/M to G1 transition is consistent with increased DNA damage that needs to be resolved during mitosis to allow for cell cycle transition (30). Previous studies have shown that deple-tion of GINS1 and GINS2 by specific siRNAs in human dermal fibroblasts induces replication stress (28). To assess the response Table 1. Correlation between clinical phenotype and genotype
Genotype c.–48C>G/R83C c.–60A>G/R83C c.–48C>G/C152Y
Kindred A, D B C
Patient P2, P5 P3 P4
Proportion of altered transcripts
(altered splice/missense) 58/35 73/24 55/35 Proportion of WT transcript 7–8 3 10 Activity of each allele
(altered splice/missense) 0/0 0/0 0/17 Estimated residual CMG activity 7%–8% 3% 15%–16% Replication speed Increased Increased Normal Checkpoint activity Impaired Impaired Impaired DNA damage markers High High Intermediate Immune phenotyping Low NK cells and
neutrophils Low T, B, NK cells and neutrophils Low NK cells and neutrophils Clinical severity ++ +++ +
Discussion
We describe here patients with inherited, partial GINS1 deficien-cy. Compound heterozygous GINS1 mutant alleles were found to underlie an AR disorder in 5 patients from 4 non-consanguineous and unrelated European families from France (n = 3) and Britain (n = 1). All displayed intrauterine growth retardation, chronic neu-tropenia, and NK cell deficiency. Four also had postnatal growth retardation, severe infections (mostly viral), and cancer. The clin-(length of IdU tract ≤10% of length of CldU tract) in patients’ cells
(Figure 7D). Overall, these results suggest that the WT GINS1 pro-tein levels produced by the patients’ cells is sufficient to initiate DNA replication but not to activate all replication origins, with a potential impact on the regulation and stability of replication forks. Altogether, our results provide evidence for a quantitative thresh-old of functional GINS/CMG complexes, responsible for the tight genotype-phenotype correlation observed in patients (Table 1).
Figure 7. GINS1-deficient patient cells show impaired DNA replication. (A) Left: Scheme of the protocol used for double-pulse labeling of replication forks in asynchronous E6/E7-fibroblasts. Successive pulses with CldU and IdU enable recognition of ongoing forks, and initiation and termination events. Red and green arrows represent neo-synthesized DNA labeled with CldU (first pulse) and IdU (second pulse), respectively. Representative pictures of DNA fibers of replication, initiation, termination, uni- or bidirectional forks and clusters are shown. Right: Analysis of replication parameters in untreated E6/ E7-fibroblasts from patients and 3 independent controls (CTL). Quantification of all events in 300 fibers was analyzed in 2 independent experiments. One representative control is shown. (B) Measurement of the CldU signal length of 50 CldU+IdU bidirectional starting signals. Measurement was done in patients and 3 independent controls in 2 independent experiments; red bars represent the mean. One representative control is shown. (C) Measurement of the CldU signal length of 50 CldU+IdU bidirectional starting signals from control and P2 E6/E7-fibroblasts lentiviral transduced by empty vector (EV); or GINS1-WT (WT), GINS1-R83C (R83C), or GINS1-ΔE1 (ΔE1); or not transduced (NT). The experiment was repeated two times. Red bars represent the mean. (D) Quantification of normal/stalled/collapsed replication forks in 50 bidirectional starting signals from patients and 3 independent controls. Replication forks were considered to have collapsed if there was no IdU signal or this signal was ≤10% of the CldU signal. ***P < 0.001; 1-way bidirectional ANOVA. Quantification was analyzed in 2 independent experiments. One representative control is shown.
The Journal of Clinical Investigation
a phase of proliferation (myeloblasts to metamyelocytes), followed by a phase of differentiation (metamyelocytes to neutrophils), before migrating to the blood. The low proportion of metamyelo-cytes and neutrophils in the bone marrow of patients with GINS1 mutations is consistent with an impact of GINS1 deficiency on the cell cycle and maintenance of neutrophil progenitors. GINS1 defi-ciency is thus a new genetic etiology of congenital chronic neutro-penia (40). The other myeloid lineages appear to develop normal-ly. However, surprisingly, the patients rarely displayed the typical acute or chronic infections observed in neutropenic children and adults, even in the absence of prophylaxis, suggesting that the bone marrow blockade might be overcome upon infectious chal-lenge. Accordingly, normal neutrophil counts were measured upon G-CSF treatment and in the course of natural infections.
Besides these gene-specific differences, the salient feature common to patients with MCM4 and GINS1 mutations leading to their study was not their growth retardation, but a profound NKD (5, 6, 8, 9). Unlike the neutropenia, the patients’ NK cell deficit was permanent. Both MCM4 and GINS1 deficiencies selectively affect the NK cell branch of the lymphoid lineage, with no major detectable effect on the development of T and B lymphocytes (8). GINS1 deficiency affects the CD56dim subset of NK cells, like MCM4 deficiency, but also the CD56bright subset (albeit to a less-er extent), unlike MCM4 deficiency. This suggests that the defect of NK cell development in patients with GINS1 mutations occurs upstream from or is more profound than that of patients with
MCM4 mutations. As in cells from patients with MCM4 mutations
(5), but not in those from healthy controls, the few blood NK cells in GINS1-deficient patients displayed impaired responses to IL-2 and IL-15, as previously reported for the T lymphocytes of P2 (9). Overall, the MCM and GINS complexes play crucial and related roles in the maintenance of NK cells. By analogy with our previous results (5, 9), we hypothesized that the NK cell deficit is due to a defect of cell survival. Residual MCM4 or GINS1 activity is suffi-cient for the normal development of most lymphoid subsets, but not for that of MAIT cells, NKT, cells and some ILCs, including NK cells in particular. The NK cell deficit is the most pronounced lymphoid deficit in both MCM4 and GINS1 deficiencies. The patients developed lymph nodes, suggesting that lymphoid tissue inducer (LTi) cell development is unaffected, contrary to what was observed for ILC2 and ILC3 cells. Our data suggest that a prolifer-ation step is crucial for some ILC subsets, and that this step occurs downstream from the common ILC precursor (CILP) cells, also referred to as CXCR6+IL-7Rα+ α-LP (lymphoid progenitor) cells, which may give rise to NK cells and other ILC subsets (41).
The mechanisms responsible for this selective impact of MCM4 and GINS1 deficiencies in NK cell development remain to be identified. There might be a defect in the signaling pathways controlling cell proliferation and/or survival signaling. Several hypotheses appear worth testing experimentally. First, the nature of the signals necessary for the development of B, T, and ILC lin-eages is different. The differentiation of adaptive lymphocytes is controlled by pre–B cell receptor (pre-BCR) for B lymphocytes and by pre–T cell receptor (pre-TCR) and γc-related cytokine signaling for T lymphocytes, whereas ILC, or at least NK cell, development seems to be strictly cytokine dependent (42). Thus, the selective impact of GINS and MCM4 on ILCs, when compared with con-ical phenotype of these patients is milder than that of inbred mice
homozygous for a null allele of Gins1, which die in utero at the implantation stage (24). The presence of at least one hypomorphic allele in each patient most likely explains their survival and devel-opment, although with growth retardation. Consistent with this hypothesis, the only patient with two hypomorphic alleles (P4) had the mildest growth retardation (–2.5 SD at birth and no post-natal growth retardation), whereas patients with one hypomor-phic and one loss-of-function allele (P2, P3, P5) had more severe growth retardation (–4/–6 SD, both pre- and postnatal) (Table 1). Overall, the global pre- and postnatal development phenotype of the patients was consistent with the ubiquitous expression of and requirement for the GINS1-containing GINS complex for DNA replication and cell proliferation (19).
The overall impact of GINS1 deficiency on pre- and postnatal development is reflected in experiments testing various relevant phenotypes in dermal fibroblasts. The residual GINS1 activity, estimated with the percentage of WT expressed allele and the CMG formation, in the patients’ cells was sufficient to initiate DNA replication. However, the low level of CMG complexes avail-able is associated with a reduced number of active replication forks in the patients’ cells. In Chinese hamster fibroblasts, it was reported that an increased replication speed will impact the den-sity of initiation events, with a lower number of active forks (35). Interestingly, we observed a higher replication speed in cells from patients, suggesting that the increased speed may compensate for the low number of active forks. In addition, we observed abnor-mally low phosphorylation of the CHK1 and RPA proteins in the patients’ cells upon HU treatment. This result is similar to those reported in yeast, where the intensity of intra–S-phase check-point activation correlates with the number of active forks (36), suggesting that the level of checkpoint responses, normally coor-dinated by ATM and ATR in response to the genotoxic effect of replication stress (37), may be regulated by a threshold of active replication forks in human cells. As CMG activity is necessary for single-stranded DNA (ssDNA) production, itself required for the activation of the ATR pathway (38, 39), fewer active forks would produce impaired activation of the DNA damage response. In turn, the compromised signaling would result in DNA damage and genome instability, as observed by increase in γH2AX and 53BP1 staining in dermal fibroblasts and accompanying cellular growth arrest. Overall our data are consistent with GINS1 being involved not only in the initiation of DNA replication but also in ATR-medi-ated checkpoint control during S-phase progression.
Mutations of GINS1 and MCM4 both result in fibroblast pheno-types that reflect and perhaps underlie pre- and postnatal growth retardation, but affected patients also display gene-specific clin-ical manifestations. Adrenal insufficiency has been reported in patients with MCM4 deficiency (5, 6) but was not observed in any of the patients with GINS1 deficiency. Conversely, patients with MCM4 deficiency do not display chronic neutropenia (5, 6). These observations suggest that the GINS and MCM complexes may play specific, non-redundant roles that may not be based on their inter-action. Alternatively, the levels of residual MCM4- and GINS1- dependent DNA replication activity may differ between patients with MCM4 and GINS1 mutations, accounting for these differenc-es. Neutrophil precursors in the bone marrow normally go through
iphosphamide, cisplatin, and adriamycin for 4 months. She recovered well after these treatments and has been healthy ever since, except for one respiratory infection, probably due to a bacterium.
In kindred B, patient P3, born in 2008, presented with a complex syndrome including severe intra- and extrauterine growth retarda-tion, mild facial dysmorphism, some facial features of premature aging, and immunodeficiency, with a particularly low NK cell count in peripheral blood. The karyotype analysis done at 3 months of age was normal. Serum IgE and eosinophil counts were normal. No autoanti-bodies were detected. Reduced myelopoiesis and erythroid dysplasia were documented in bone marrow analysis. The growth retardation was extremely pronounced and did not respond to enteral feeding support including percutaneous endoscopic gastrostomy (PEG) feed-ing or to parenteral feedfeed-ing. P3 presented multiple episodes of severe viral infections, including prolonged acute CMV and varicella zoster (VZV) infection, several severe airway infections with adenovirus and respiratory syncytial virus (RSV) requiring hospitalization, and multiple episodes of diarrhea and gastroenteritis. Only during two of the many diarrheal episodes was a viral infection detected (astrovi-rus and rotavi(astrovi-rus). The diarrhea was associated with severe protein- losing enteropathy. Progressive lymphopenia and neutropenia were observed, particularly during periods of infection. Due to low serum IgM and IgG levels, particularly during episodes of protein-losing enteropathy, immunoglobulin replacement and antibiotic prophylaxis were initiated, greatly decreasing the frequency of airway infections.
In kindred C, patient P4, born in 1986, displayed intrauterine growth retardation (though extrauterine growth was normal), and had low NK cell and neutrophil counts. The karyotype analysis done in blood at 9 years of age was normal. She developed dry skin and ichthyosis phenotypes. Eosinophil counts were normal. No autoanti-bodies were reported. A slight dysgranulopoiesis was documented in bone marrow analysis. She received prophylactic antibiotic treatment (trimethoprim/sulfamethoxazole) from 15 to 24 years of age. In the first few months of life, she developed post-vaccination abscesses and vulvar boils. At the age of 1 year, she developed a severe necrotizing varicella infection, associated with lymphadenopathy. At the ages of 2 and 7 years, she had herpes simplex infections with lymphadenop-athy. At the age of 9 years, she developed folliculitis with associat-ed lymphadenopathy and had widespread boils over a period of 10 months. A staphylococcal infection was suspected. The patient expe-rienced repeated ear, nose, and throat (ENT) and digestive infections (of unknown etiology) during her teenage years. She developed sev-eral fungal lesions of the scalp at the age of 14 years and had another staphylococcal infection at the age of 17 years. She was tested several times for viruses, and positive serological test results were obtained for CMV, EBV, and VZV, although no viruses were detected in her blood. She experienced an ENT infection associated with a lymphade-nopathy at the age of 20 years and since has been healthy.
In kindred D, patient P5, born in 1997, displayed severe intra- and extrauterine growth retardation, despite enteral and parenteral support and growth hormone therapy. No increases in sister chroma-tid exchanges and in DNA breaks were found in karyotype analysis done in bone marrow, blood, and fibroblasts. However, an increase in endomitosis was noticed in blood and fibroblast cells at 10 years of age. Myelodysplasia was documented in bone marrow analysis. She experienced precocious chronic diarrhea linked to bacterial episodes, food allergies, and villous atrophy. Her cutaneous phenotype
includ-ventional B and T cells, might result from signals initiated by pre-BCR and pre-TCR, which could modify cell proliferation, apopto-sis/senescence, or both, whereas cytokine signaling alone might not (43, 44). Second, whereas the control of DNA breaks is a crit-ical part of the development of T and B cells, NK cells and other ILCs do not productively rearrange the gene segments encoding for antigen receptors. It is therefore possible that the molecular machinery controlling DNA integrity and DNA repair is regulat-ed differently in adaptive lymphocytes versus ILCs. Although the impact of GINS1 deficiency on MAIT and NKT cells does not fully support this possibility, it remains that MAIT and NKT cells express invariant T cell receptors and might experience fewer DNA breaks during development. It would thus be interesting to evaluate whether members of the CMG complex participate in other DNA transactions beyond DNA replication. Along this line, it has been recently reported that the RAG recombinase may play a novel function beyond V(D)J recombination, and endow ILCs including NK cells with a better response to DNA damage and repair of DNA breaks (45). Finally, the NK phenotype of patients with MCM4 or GINS1 deficiency might be related to POLE1 and POLE2 deficiency, two inborn errors of DNA replication that underlie a complex phenotype including NKD and growth retar-dation (46, 47). Irrespective of these data, our results suggest that the maintenance of human NK cells and some ILCs, as well as that of neutrophils, is more dependent of the integrity of the MCM-GINS multi-molecular complex than other lymphoid and myeloid lineages, attesting to the strong dependence of the process on rep-lication and genomic stability during their development.
Methods
Case reports. Detailed clinical features of the patients are described in
Supplemental Table 1.
Briefly, two children from kindred A had very few or no NK cells and neutrophils in their peripheral blood. Both were born with severe intra- and extrauterine growth retardation, microcephaly, and mild dysmorphism. At the age of 5 months, the index case, P1, born in 1993, was diagnosed with atopic dermatitis, followed by generalized erythroderma desquamativa. A new episode of erythroderma was diagnosed at the age of 9 months. High serum IgE levels and high eosinophil counts were reported. At the ages of 1 year and 18 months, she developed episodes of pneumonia, with no pathogen isolation in the first episode and CMV infection diagnosed in the second. The patient suffered hemodynamic failure and died. This patient had pre-viously experienced recurrent childhood viral infections, with recur-rent respiratory tract infections and lung disease consisting of bron-chiectasis, fibrosis, and respiratory failure. Her younger sister P2 was born in 1998. The karyotype analysis done in blood at 3 months of age was normal. Serum IgE and eosinophil counts were normal. No auto-antibodies were detected. At 17 months of age, she developed eczema-tous lesions. She has had no unusual infections, but is on prophylactic antibiotic treatment due to neutropenia. She displayed growth retar-dation associated with insufficient growth hormone secretion and was treated with synthetic growth hormone between the ages of 4 and 12 years. However, this treatment was stopped when she developed an osteosarcoma at the age of 12 years. She received two lines of chemo-therapy, the first based on methotraxate and adriamycin for 3 months followed by local conservative surgery and the second based on VP16,
The Journal of Clinical Investigation
substrate (Pierce) were used. Anti–α-tubulin or GAPDH antibodies (Santa Cruz Biotechnology Inc.) were used for normalization.
Transient transfection. The C-terminal Flag-tagged pCMV6 empty
vector and the human GINS1 expression vector were purchased from OriGene (RC203049). Other constructs were generated by direct mutagenesis with fusion Taq from Finnzymes. We transiently trans-fected HEK293T cells by the calcium phosphate method (Invitrogen).
Immunoprecipitation assay. HeLa cells were transiently
transfect-ed with pIRESpuroHF-Psf1 (WT or mutants). GINS1 exon 2 starts at the first amino acid of helix2. We constructed a plasmid for expres-sion of the GINS1 ΔE1 mutant by inserting a Kozak sequence and a start codon (ATG) immediately in front of helix 2. After 48 hours of transfection, cells were harvested and lysed as described previously (48). The lysate was sonicated and treated with Benzonase (Novagen; final concentration, 1.25 U/l) at 4°C for 2 hours, followed by centrifu-gation at 15,000 g for 10 minutes. The supernatant (~640 μg protein) was mixed with anti-Flag M2 agarose beads in the presence (+Flag) or absence (–F) of 1 mg/ml 3XFlag peptide and incubated overnight. The beads were then washed 3 times, and the bound proteins were eluted in 1× SDS buffer.
CMG complex purification. Sf9 insect cells were co-infected with
viruses expressing the 11 CMG subunits, including CDC45 with an HF tag and GINS4 with a GST tag. After 60 hours of infection, the CMG complexes were purified, as previously described (48). Gradient frac-tions were subjected to SDS-PAGE separation followed by silver staining.
ATPase assay. Reactions were performed as described previously
(48). Aliquots (1 μl) were spotted onto a polyethylenimine-cellulose TLC plate (Merck) and developed in 0.5 M LiCl/1.0 M formic acid, and products were analyzed using a PhosphorImager (Fujifilm).
Preparation of a DNA substrate and helicase assay. M13 DNA
heli-case substrate was prepared, and heliheli-case assays were carried out as described previously (48). The resolved DNA products were quantified using a PhosphorImager.
Growth curve and apoptosis rate in primary fibroblasts. Primary
fibro-blasts from 5 healthy controls and patients were seed at 25 × 103 total
cells in a 12-wells plate. Cells were cultured and harvested at the follow-ing time points: 1, 3, 6, and 9 days. Total cell numbers and viability rate were assessed with trypan blue using the Vi-CELL-XR Cell Viability Analyzer (Beckman Coulter). The experiment was done twice. Growth curve represents the mean and SD of all controls, and each patient.
Nuclear analysis. Primary fibroblasts were fixed by incubation in
3.7% PFA for 10 minutes. The slides were washed and mounted in DAPI-containing mounting medium (Life Technologies). Images were acquired with a fluorescence microscope (Leica, DMR), and the area covered by the nuclei was measured with ImageJ software (NIH).
Senescence assay. β-gal staining was performed with a Senescence
β-Galactosidase Staining Kit (9860, Cell Signaling Technology). The E6/E7-fibroblasts from 3 different controls and from patients were left untreated or were treated with HU (2 mM) or H2O2 (120 μM) for 20 hours; 300 cells were analyzed by microscopy. Three independent experiments were carried out.
Cell cycle analysis. Cells were plated at a density of 1 × 10⁵ cells/
ml, pulse labeled with BrdU for 30 minutes, and washed with PBS. Cells were fixed with methanol and stained with anti-BrdU–FITC antibody (BD Biosciences) and propidium iodide. Flow cytometry analysis was carried out with the BD LSRII flow cytometry system and BD FACSDiva software.
ed initial atopic dermatitis, lipoatrophy, and pale and thin skin. Serum IgE and eosinophil counts were normal. At the age of 5 years, she developed severe glaucoma that steadily worsened and progressed to definitive bilateral blindness. She had recurrent viral or bacterial pulmonary infections: mild neutropenia with dysmyelopoiesis was noticed from the age of 1 year, hypogammaglobulinemia and low NK cell counts from the age of 7 years, and progressive lymphopenia. At the age of 13 years, she developed Aspergillus nidulans pneumonia. Prophylactic cotrimoxazole was initiated at 3 years of age, immuno-globulin replacement at age 7 years, and daily caspofungin and G-CSF therapy at age 13 years; all of these have continued to the present. From the age of 9, she had 4 severe episodes of autoimmune hemo-lytic anemia (a Coombs test was positive), treated with short steroid courses, rituximab, cyclosporine, and azathioprine and complicated by a severe hemophagocytic syndrome at the age of 10 years.
Whole-exome sequencing. Whole-exome sequencing was carried
out, as previously described, with the Agilent SureSelect Human All Exon 50 or 71 Mb Kit (Agilent Technologies) for exome capture. Paired-end sequencing generated 100 base reads, sequences were aligned with the hg19 build of the human genome, and all calls with a read coverage of less than 2× and a phred-scaled SNP quality of less than 20 were filtered out.
Cell purification and culture. Fresh human PBMCs were isolated
by Ficoll-Hypaque centrifugation (Amersham Pharmacia Biotech) from whole-blood samples. Lymphoblastoid cell lines (EBV-B) were maintained in RPMI 1640 medium supplemented with 10% heat- inactivated fetal calf serum (FCS) (Gibco BRL; Invitrogen). Primary and transformed E6/E7-fibroblasts were maintained in DMEM medium supplemented with 10% heat-inactivated FCS (Gibco BRL; Invitrogen).
DNA, RNA, PCR, sequencing. Genomic DNA and RNA were
puri-fied from blood, EBV-B cells, or E6/E7-fibroblasts. Total RNA was extracted with TRIzol (Invitrogen) and reverse transcribed with SuperScript II Reverse Transcriptase (Invitrogen). The GINS1 cDNA was amplified with different pairs of primers. PCR was performed with Taq polymerase (Invitrogen). The products were sequenced with the BigDye Terminator cycle sequencing kit and analyzed on a 3130 ABI Prism Genetic Analyzer (Applied Biosystems).
Determination of mRNA levels by qPCR. Total RNA was purified
with the RNeasy plus Micro Kit (QIAGEN) and reverse transcribed with the High Capacity RNA-to-cDNA kit (Applied Biosystems). qPCR was performed in an ABI PRISM 7700 Sequence Detection Sys-tem (Applied BiosysSys-tems) using an exon-spanning probe for GINS1 (Hs01040835_m1, Applied Biosystems), with normalization to the β-glucuronidase (GUS) housekeeping gene by the ΔCt method.
Western blots. Cells were lysed in 1% Triton X-100 lysis buffer
plus protease and phosphatase inhibitors. Samples were subjected to criterion TGX precast 10% or 18% gel separation and transferred onto membranes by iBlot Gel Transfer (Invitrogen). Primary anti-Flag (OriGene, 4C5), anti-GINS1 (10R-1766, Fitzgerald), anti-GINS2 (A304-140A, Bethyl Laboratories Inc.), anti-GINS3 (15651-1-AP, Pro-teinTech), anti-GINS4 (ab139683, Abcam), anti-CHK1 (2G1D5, Cell Signaling Technology), anti–phospho-CHK1 (S317) (D12H3, Cell Sig-naling Technology), anti-RPA32 (A300-244A, Bethyl Laboratories Inc.), anti–phospho-RPA32 (S4+S8) (ab87277, Abcam), anti-CHK2 (H300, sc9064, Santa Cruz Biotechnology Inc.), and anti–phospho- CHK2 (ABE343, Millipore) antibodies were used. Secondary peroxi-dase-conjugated antibody (GE Healthcare) and ECL Western blotting