HAL Id: hal-00105476
https://hal.archives-ouvertes.fr/hal-00105476
Preprint submitted on 11 Oct 2006
HAL is a multi-disciplinary open access
archive for the deposit and dissemination of
sci-entific research documents, whether they are
pub-lished or not. The documents may come from
teaching and research institutions in France or
abroad, or from public or private research centers.
L’archive ouverte pluridisciplinaire HAL, est
destinée au dépôt et à la diffusion de documents
scientifiques de niveau recherche, publiés ou non,
émanant des établissements d’enseignement et de
recherche français ou étrangers, des laboratoires
publics ou privés.
Finite size effects in the Verwey transition of magnetite
thin films
Alexandre Bataille, Eric Vincent, Susana Gota, Martine Gautier-Soyer
To cite this version:
Alexandre Bataille, Eric Vincent, Susana Gota, Martine Gautier-Soyer. Finite size effects in the
Verwey transition of magnetite thin films. 2006. �hal-00105476�
ccsd-00105476, version 1 - 11 Oct 2006
A.M. Bataille,1,∗ E. Vincent,2 S. Gota,1,† and M. Gautier-Soyer1
1
DRECAM/SPCSI, CEA Saclay, 91191 Gif-sur-Yvette, France
2
DRECAM/SPEC, CEA Saclay, 91191 Gif-sur-Yvette, France
We report on the finite size effects in the Verwey transition of stress-free magnetite (Fe3O4) thin
films. A limit thickness of 20 nm is evidenced, above which the transition temperature TV is constant
and close to 120 K (bulk value) and below which no genuine transition is observed. Field Cooled and Zero Field Cooled measurements evidence irreversibilities for all thicknesses. This irreversible behavior abruptly disappears around TV for the thicker films, when the magnetic anisotropy
van-ishes. These behaviors are interpreted in terms of assemblies of interacting magnetic Fe3O4clusters,
which are smaller than the antiphase domains present in the films.
The Verwey transition has been the subject of a huge research effort for almost a century[1, 2]. The phe-nomenon is observed in various compounds like Fe3O4[3],
Eu3S4 [4] and Ti4O7 [5]. Though it was first evidenced
through anomalies concerning magnetite (Fe3O4)
spe-cific heat[6] and magnetization [7], the feature mostly as-sociated to the transition is the sharp drop in resistivity observed when heating the sample above the transition temperature TV (≃ 120 K for Fe3O4). The phenomenon
is extremely sensitive to the pressure applied to the sam-ple [8, 9] and to very small variations of stoichiometry [10]. In a pioneering work, Verwey carved the concept of charge ordering [3] in order to explain this peculiar metal-insulator transition observed in materials in which elec-tronic correlations, electron-phonon coupling and kinetic energy of the carriers are of the same order of magnitude [1].
The Verwey transition has given a great impulse to studies of its prototypical material Fe3O4, which were
mostly carried out on bulk single crystals (for recent reviews, see refs. [1] and [2]). However, growth and study of Fe3O4thin films has recently gained
momen-tum given its potential interest for spintronics [11, 12] triggered by the prediction of the total spin polarization (half-metallicity) of the compound[13]. Exploring this potential use requires that Fe3O4thin films be part of
multilayers later patterned into devices like spin valves and magnetic tunnel junctions [14]. Studies on the Ver-wey transition through transport and magnetism mea-surements then provide a simple, non destructive way of studying Fe3O4independently of the other parts of the
device and of checking that it has not been affected dur-ing the whole process.
From a more fundamental point of view, the study of the Verwey transition of nanometric objects can also un-ravel finite size effects. However, the studies published so far on the Verwey transition of Fe3O4thin films were
carried out on stressed samples given the small lattice mismatch with the substrate (MgO [15, 16, 17, 18, 19, 20, 21, 22], MgAl2O4 [18, 22, 23] or ZnFe2O4[23]). Epitaxy
thus create an interplay between strain and film thick-ness h, the films adopting the lattice parameter of the
substrate up to a substrate-dependant critical thickness and relaxing continuously afterward. The continuous de-crease of TV with decreasing thickness below h ≃ 200 nm
has thus been ascribed to epitaxial stress [17]. Relaxed films are then required in order to study the influence of the film thickness on the Verwey transition. Besides, a superparamgnetic behavior has been reported [24, 25] for very thin films (h ≤ 5 nm), which has been ascribed to the presence of antiphase boundaries (APBs) in the sam-ples. These defects are indeed observed regardless of the substrate used [15], the mean antiphase domain (APD) size, typically a few tens of nm, evolving [26, 27] as h1/2.
A second finite lengthscale comes into play when dealing with Fe3O4epitaxial thin films. The aim of this paper is
to unravel finite size effects in the Verwey transition of Fe3O4thin films by studying well characterized,
stress-free samples, focusing on the low thickness (h < 50 nm) regime.
Fe3O4(111) thin films were grown onto α-Al2O3(0001)
substrates in a Molecular Beam Epitaxy setup dedicated to oxide thin films elaboration by co-deposition of atomic oxygen and metal, which is described in details elsewhere [28, 29]. Deposition rates are evaluated in situ using a quartz balance and also ex situ by X-ray reflectivity ; the precision on the thickness of the Fe3O4layers is about
5%. X-ray photoelectron spectra at the Fe 2p photoe-mission line recorded in situ for each film were typical of stoichiometric Fe3O4. Punctual X-ray magnetic
cir-cular dichroism measurement [12] also showed no sign of deviation from perfect magnetite for the studied film.
Full relaxation of the films is expected even for very thin films given the large lattice mismatch (and hence the small critical thickness) between Fe3O4and
α-Al2O3 (8 %) . This relaxation has been evidenced
by real-time RHEED (Reflection High Energy Electron Diffraction)[28], even though a dilation is observed dur-ing the first growth stages . The latter phenomenon is purely dynamic, since transmission electron micrographs show no sign of a gradient of lattice parameter after the end of sample growth, and all the films presented in this paper are fully relaxed indeed. The growth is 2D as ev-idenced by the RHEED patterns recorded during
depo-2 sition, even though a few films showed additional spots
aside from the streaks characteristic of 2D growth (unless otherwise stated, the RHEED patterns of the samples considered in the following exhibited only well defined streaks). The mean antiphase domain size does evolve as h1/2and is about 25 nm for a 15-nm thick film[27].
100 110 120 130 140 150 0.1 1 50 nm 25 nm 20 nm 15 nm 10 nm 8 nm 5 nm R (T )/ R (1 0 0 K ) Temperature (K) 100 110 120 130 140 150 -0.05 -0.04 -0.03 -0.02 d l o g (R )/ d T Temperature (K)
FIG. 1: (color online) Transport measurements on Fe3O4thin
films. Resistivities have been normalized with respect to ρ(100K) for the sake of clarity. The inset shows the loga-rithmic derivative of the resistivity, which shows the second order Verwey transition as a minimum for films thicker than 20 nm
Two- and four-probe transport measurements were carried out within a Quantum Design physical proper-ties measurements system, using either the device elec-tronics or some external apparatus designed for high re-sistance measurements (up to 10 GΩ). Measurements were performed during sample warming at a very slow rate (less than 0.1 K/min in the transition region) in or-der to ensure a complete thermalization of the sample. R(T ) measurements reported here were realized under zero magnetic field though we checked that the results are not affected by the application of constant fields up to 70 kOe.
Resistivity vs temperature measurements for seven samples are displayed in figure 1. As already reported for stressed Fe3O4thin films [21, 22], the Verwey transition
is second order for the Fe3O4films grown on α-Al2O3,
and not first order as in the case of single crystals. The Verwey temperature TV is thus defined as the minimum
of the logarithmic derivative of the resistance. In sharp contrast to the continuous variation of TV reported for
strained samples, the films for which RHEED patterns indicated purely 2D growth fall into two categories as a function of film thickness: those with h ≥ 20 nm exhibit a clear, rather sharp Verwey transition at a temperature close to 120 K, whereas those with h < 20 nm do not show any sign of transition. The few thick films of lesser crys-talline quality (for which RHEED patterns show spots aside from streaks) exhibit either a reduced TV or no
transition at all.
Field-Cooled (FC), together with and
Zero-Field-50 100 150 200 250 300 0.90 0.92 0.94 0.96 0.98 1.00 1.02 50 nm 25 nm 15 nm 10 nm 5 nm M( T )/ M( 1 3 0 K ) Temperature (K)
FIG. 2: Field-cooled magnetization of selected Fe3O4thin
films. Magnetizations have been normalized with respect to MFC(130K) for the sake of clarity. The Verwey transition
ap-pears as a drop of magnetization, readily seen for the 25 nm and 50 nm-thick films. Although no genuine transition exist for the 10-nm thick film, the MFCcurve shows a maximum at
T ≃ 125 K.
Cooled (ZFC) measurements were realized with a super-conducting quantum interference device (SQUID) mag-netometer. The ZFC curve was acquired first, after AC-demagnetization of the sample at room temperature. MFCcorresponds to the reversible part of the
magneti-zation and FC measurements are thus the genuine test of the Verwey transition (MZFCand its comparison with
MFCwill be discussed later in this paper). Figure 2
dis-plays some representative examples of FC measurements. The transition appears as a sharp variation of the FC magnetization of the 50- and 25 nm-thick films at 119 K, TV being defined as the temperature for which the slope
of MFC(T ) is maximum. The thinnest films (h < 10
nm) show no signs of transition. However, FC measure-ments also evidence an intermediate class of films (10 nm≤ h ≤ 15 nm) which do not exhibit a proper tran-sition, but show a broad maximum of MFCat T ≃ 120
K. As for transport measurements, TV is independent of
film thickness and close to the bulk value above a treshold thickness. Moreover, both measurements give consistent values of this treshold thickness above which a genuine Verwey transition is observed.
Coercivity was measured as a function of temper-ature with a vibrating sample magnetometer. A 10 kOe field was applied during cooling to avoid twinning while cooling through TV [30]. No shift in the
hystesis loops was observed, contrary to what has been re-ported for Fe3O4(100) films grown on MgO[31]. For all
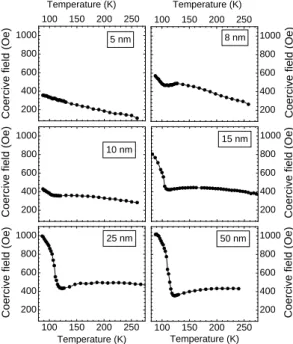
but the thinner films (h ≤ 5 nm), the coercive field Hc also presents anomalies in the vicinity of 120 K,
namely a local minimum followed in the case of the thicker films by a sharp increase when cooling the sam-ple below T ≃ 120K , as evidenced by figure 3. This phenomenon is to be linked with the peculiar behav-ior of Fe3O4anisotropy in this temperature range.
tempera-100 150 200 250 200 400 600 800 1000 200 400 600 800 1000 200 400 600 800 1000 100 150 200 250 200 400 600 800 1000 200 400 600 800 1000 100 150 200 250 100 150 200 250 200 400 600 800 1000 10 nm 15 nm 50 nm Temperature (K) C o e rc iv e f ie ld ( O e ) Co e rc iv e f ie ld ( O e ) C o e rc iv e f ie ld ( O e ) Co e rc iv e f ie ld ( O e ) Co e rc iv e f ie ld ( O e ) C o e rc iv e f ie ld ( O e ) 8 nm 5 nm Temperature (K) Temperature (K) 25 nm Temperature (K)
FIG. 3: Coercivity vs temperature curves for various film thicknesses
ture noted TK (a few K above TV) for which the
mag-netic anisotropy vanishes[32]. TK can also be deduced
from the Hc(T ) curves, since it corresponds to the
co-ercivity minimum [22]. Fig. 3 shows that all but the thinnest film exhibit a local minimum of Hc, and TK is
indeed found slightly higher than TV when the Verwey
transition does occur (h ≥ 20 nm), and still above 110 K for samples of intermediate thickness (8 nm ≤ h ≤ 15 nm).
We now focus on the ZFC measurements, of which relevant examples are displayed in figure 4. A strong separation of the ZFC and FC curves at low tempera-ture is observed for all samples, and is the signatempera-ture of a frozen magnetic state. In the thinnest samples, the mag-netic irreversibilities extend up to at least room temper-ature (since no control of the oxygen partial pressure was available in the magnetometer, no heating beyond 300 K was attempted to avoid the irreversible transformation of Fe3O4into α-Fe2O3). Irreversibilities are observed in the
ZFC/FC curves of the thinnest samples for a measure-ment field of 1kOe which is higher than the coercive field obtained from hysteresis loops (see Fig. 3), suggesting that the zero-field cooled state (established after demag-netization of the sample) is more strongly frozen than the state obtained by decreasing the field from the satu-ration value. It is likely that the demagnetized zero-field cooled state consists in a microstructure of numerous and strongly pinned magnetic domains.
All samples exhibit a slow increase of the ZFC curve below 100 K (see Fig. 4) which is character-istic of the progressive magnetic unblocking observed in frozen superparamagnetic systems in response to a
250 300 350 400 50 100 150 200 250 300 100 200 300 400 50 100 150 200 250 300 100 200 300 400 Temperature (K) M a g n e ti z a ti o n ( k A /m ) Temperature (K) (a) (b) (c) h= 5 nm h= 10 nm h= 25 nm
FIG. 4: Field Cooled (− • −) and Zero Field Cooled (− ◦ −) magnetization of selected samples
temperature increase [33] , and the FC curve shows a superparamagnetic-like decrease when heating above 120 K. However, the 25 nm film shows a spectacular rise up of the ZFC magnetization in the 110 K region, where an abrupt decrease of the coercive field is correlatively ob-served (Fig 3) close to the Verwey transition, slightly be-low TKat which anisotropy cancels out. The frozen
mag-netic domains are suddenly free to relax in this tempera-ture range, as would happen for frozen magnetic nanopar-ticles whose anisotropy barriers decrease [33]. This phe-nomenon is only observed for thicker films ( h ¿ 20 nm), where the Verwey transition and the coercivity fall off are well marked. The temperature dependence of the ZFC magnetization of the thinner films (which do not exhibit these features) is comparable with that of a frozen super-paramagnet in which some large magnetic grains remain blocked at room temperature.
The slope of the high temperature region (150-300 K) of the FC curves can be analyzed in terms of a superpara-magnetic Curie-Weiss behavior, in order to roughly esti-mate the size of the fluctuating magnetic Fe3O4clusters
which are involved in the freezing process at lower tem-peratures. Given the extremely small amount of matter comprised in the samples, and hence the weakness of the signal, no direct measurement of the initial susceptibil-ity could be performed, and we approximate it with the M/H ratio obtained from the FC measurements under
4 H=1 kOe. We write: H M ≃ 1 χ = 3kB(T − θ) µ0N nm20 (1) where N is the density of iron atoms of moment m0in
Fe3O4, n the number of iron moments strongly coupled
in a superparamagnetic Fe3O4cluster, and θ the Curie
temperature which corresponds to the inter-cluster in-teraction energy. For the 7 samples analyzed, we obtain θ ≃ −700 K, and n slowly increasing from 3000 to 5000 when the film thickness varies from 5 to 50 nm. Since the two fitting parameters n and θ depend only weakly on the film thickness, there is no obvious relation be-tween these magnetic entities and the antiphase domains which are observed in Fe3O4epitaxial thin films. The
antiphase domains are indeed 1-2 orders of magnitude larger, and their in-plane size has been shown to vary as h1/2 [26, 27], (their volume thus varies as h2). The
magnetic Fe3O4clusters which give rise to the observed
superparamagnetic behavior should be thought of as a microstructure of the domains or of their boundaries, the exact nature of which remains unclear.
In summary, we report on the Verwey transition on stress-free Fe3O4thin films epitaxially grown onto
α-Al2O3as a function of the film thickness h. A limiting
thickness is evidenced: the films exhibit a clear Verwey transition at a temperature TV close to 120 K (which
is also the transition temperature of bulk samples) for h ≥ 20 nm, whereas there is no hint of transition when his below 10 nm. FC/ZFC measurements show an irre-versible behavior for all the films, the sharp variation of the ZFC curve for h ≥ 20 nm being linked to the vari-ation of the anisotropy, evidenced by the anomalous be-havior of the coercivity. These results are interpreted in terms of interacting magnetic Fe3O4clusters smaller than
antiphase domains, their size and interactions hardly de-pending on film thickness.
Acknowledgments: We would like to thank M.-J. Guittet for her help concerning sample growth, A. Vit-tiglio for technical support, D. Parker, G. Lebras, and P. Bonville for their help during SQUID measurements, and M. Viret for fruitful discussions.
∗ Present address: Laboratoire de Physique des mat´eriaux,
Universit´e Henri Poincar´e, 54506 Vandœuvre-les-Nancy, France; Electronic address: alexandre.bataille@lpm.u-nancy.fr
† Present address: Laboratoire L´eon Brillouin, UMR
012 CEA-CNRS, CEA Saclay, F-91191 Gif-sur-Yvette, France
[1] F. Walz, J. Phys: Condens. Matter 14 R285 (2002) [2] J. Garc`ia and G. Sub`ias, J. Phys.: Condens. Matter 16
R145 (2004)
[3] E. J. W. Verwey, Nature 144 327 (1939)
[4] D. Ihle and B. Lorenz, Phys. Stat. Sol. (b) 116 539 (1983)
[5] B. K. Chakraverty, Phil. Mag. B 42 473 (1980)
[6] G. S. Parks and K. K. Kelley, J. Phys. Chem. 30 47 (1926)
[7] P. Weiss and R. Forrer, Ann. Phys. 12 279 (1929) [8] G. K. Rozenberg, G. R. Hearne, M. P. Pasternak, P. A.
Metcalf and J. M. Honig, Phys. Rev. B 53 6482 (1996) [9] S. Todo, N. Takeshita, T. Kanehara, T. Mori and
N. Mˆori, J. Appl. Phys. 89 7347 (2001)
[10] N. Guigue-Millot, N. Keller and P. Perriat, Phys. Rev. B 64012402 (2001)
[11] A. M. Bataille, J.-B. Moussy, F. Paumier, S. Gota, M.-J. Guittet, M. Gautier-Soyer, P. Warin, P. Bayle-Guillemaud, P. Seneor, K. Bouzehouane and F. Petroff, Appl. Phys. Lett. 86 012509 (2005)
[12] A.M. Bataille, A. Tagliaferri, S. Gota, C. de Nada¨ı, J.-B. Moussy, M.-J. Guittet, K. Bouzehouane, F. Petroff, M. Gautier-Soyer and N.B. Brookes, Phys. Rev. B 73 172201 (2006)
[13] A. Yanase and K. Siratori, J. Phys. Soc. Jpn. 52 312 (1984)
[14] A. Bataille, PhD Thesis, Universit´e Paris XI (2005), (in french)
[15] D. T. Margulies, F. T. Parker, F. E. Spada, R. S. Gold-man, J. Li, R. Sinclair and A. E. Berkowitz, Phys. Rev. B 53 9175 (1996)
[16] M. Ziese and H. J. Blythe, J. Phys.: Condens. Matter 1213 (2000)
[17] X. W. Li, A. Gupta, G. Xiao and G. Q. Gong, J. Appl. Phys. 83 7049 (1998)
[18] M. G. Chapline and S. X. Whang, J. Appl. Phys. 97 123901 (2005)
[19] W. Eerenstein, T. T. M. Palstra, T. Hibma and S. Celotto, Phys. Rev. B 66 201101 (2002)
[20] G. Q. Gong, A. Gupta, G. Xiao, W. Qian and V. P. Dravid, Phys. Rev. B 56 5096 (1997)
[21] S. P. Sena, R. A. Lindley, H. J. Blythe, C. Sauer, M. Al-Kafarji and G. A. Gehring, J. Magn. Magn. Mater. 176 111 (1997)
[22] A. Bollero, M. Ziese, R. H¨ohne, H. C. Semmelhack, U. K¨ohler, A. Setzer and P. Esquinazi, J. Magn. Magn. Mater. 285 279 (2004)
[23] C.A. Kleint, M.K. Krause, R. H¨ohne, M. Lorenz, H.C. Semmelhack, A. Schneider, D. Hesse, H. Sieber, J. Taubert and W. Andr¨a, J. Phys. IV (France) 7 593 (1997)
[24] F. C. Voogt, T. T. M. Palstra, L. Niesen, O. C. Rogojanu, M. A. James and T. Hibma, Phys. Rev. B 57 R8107 (1998)
[25] W. Eerenstein, T. Hibma and S. Celotto, Phys. Rev. B 70184404 (2004)
[26] W. Eerenstein, T. T. M. Palstra, T. Hibma and S. Celotto, Phys. Rev. B 68 014428 (2003)
[27] A. M. Bataille, L. Ponson, S. Gota, L. Barbier, D. Bonamy, M. Gautier-Soyer, C. Gatel and E. Snoeck, Phys. Rev. B, in press
[28] S. Gota, J.-B. Moussy, M. Henriot, M.-J. Guittet and M. Gautier-Soyer, Surf. Sci. 482-485 809 (2001) [29] J.-B. Moussy, S. Gota, A. Bataille, M.-J. Guittet,
M. Gautier-Soyer, F. Delille, B. Dieny, F. Ott, T. D. Doan, P. Warin, P. Bayle-Guillemaud, C. Gatel and E. Snoeck, Phys. Rev. B 70 174448 (2004)
[30] M. Iizumi, T. F. Koetzle, G. Shirane, S. Chikazumi, M. Matsui and S. Todo, Acta Cristallogr. B 38 2121 (1982)
[31] S. K. Arora, R. G. S. Sofin, A. Nolan and I. V. Shvets, J. Magn. Magn. Mater. 286 463 (2005)
[32] K. Abe, Y. Miyamoto and S. Chikazumi, J. Phys. Soc. Jpn. 41 1894 (1976)
[33] D. Fiorani J.L. Dormann and E. Tronc, Advances in Chemical Physics, XVIII, 283, (Wiley, New York, 1997), and references therein