HAL Id: hal-01982390
https://hal.archives-ouvertes.fr/hal-01982390
Submitted on 15 Jan 2019HAL is a multi-disciplinary open access
archive for the deposit and dissemination of sci-entific research documents, whether they are pub-lished or not. The documents may come from teaching and research institutions in France or abroad, or from public or private research centers.
L’archive ouverte pluridisciplinaire HAL, est destinée au dépôt et à la diffusion de documents scientifiques de niveau recherche, publiés ou non, émanant des établissements d’enseignement et de recherche français ou étrangers, des laboratoires publics ou privés.
Carbonation of hardened cement pastes : Influence of
temperature
Emeline Drouet, Stéphane Poyet, Patrick Le Bescop, Jean Michel Torrenti,
Xavier Bourbon
To cite this version:
Emeline Drouet, Stéphane Poyet, Patrick Le Bescop, Jean Michel Torrenti, Xavier Bourbon. Carbon-ation of hardened cement pastes : Influence of temperature. Cement and Concrete Research, Elsevier, 2019, 115, pp. 445-459. �10.1016/j.cemconres.2018.09.019�. �hal-01982390�
Carbonation of hardened cement pastes: influence
of temperature
Emeline DROUET a, Stéphane POYET a,*, Patrick LE BESCOP a, Jean-Michel TORRENTI b,
Xavier BOURBON c
a Den-Service d’Etude du Comportement des Radionucléides (SECR), CEA, Université de
Paris-Saclay, F-91191, France
b Université Paris-Est, IFSTTAR, Département Matériaux, 58 boulevard Lefebvre, F-75015 Paris,
France
c Andra, Parc de la Croix Blanche, 1-7 rue Jean-Monnet, F-92298 Châtenay-Malabry cedex, France
Corresponding author: Stéphane POYET
Postal address: CEA Paris-Saclay, DEN/DANS/DPC/SECR/LECBA, B158 PC25, F-91191 Gif-sur-Yvette cedex, France.
E-mail: stephane.poyet@cea.fr
Abstract
The impact of temperature on carbonation was investigated in laboratory conditions using a device developed for this purpose. Two hardened cement pastes (CEM I and CEM V/A) were tested between 20°C and 80°C at different levels of relative humidity (RH). The carbonation rate of the CEM I increased with temperature, whereas that of CEM V/A reached a maximum at around 50°C.
Keywords: Carbonation (C) – Temperature (A) – Humidity (A) – Cement paste (D)
1. Introduction
Atmospheric carbonation involves a reaction between carbon dioxide (CO2) and cementitious
materials. Gaseous CO2 present in the atmosphere diffuses through the concrete cover, dissolves
in the pore solution, and then reacts with calcium ions to precipitate calcium carbonate (CaCO3).
The result of carbonation is the dissolution of calcium-bearing hydrates, the first of them being portlandite, Ca(OH)2. This causes the pH of the pore solution to drop, which provides the ideal
conditions for the active corrosion of reinforcing steel. As carbonation has been studied for many years, the main mechanisms and influential parameters are well-known and efficient models are available to calculate the rate of the carbonation reaction [1–8]. Among all the influential parameters, the following are worth citing:
Gaseous diffusion of CO2: carbonation is driven by the gaseous diffusion of CO2 in the
ambient air through the carbonated layer to the calcium carbonate precipitation zone: the carbonated depth is proportional to the square root of time at steady-state [1,9,10]. Concentration of solid phases which can be carbonated (and especially portlandite)
[1,6,11].
Moisture content: water is necessary for the chemical reactions to occur (reaction medium), but it is also hampers CO2 diffusion. The higher the water content, the more
likely the chemical reactions but the slower the diffusion rate. These two contradictory phenomena justify the existence of an optimal RH for carbonation around 40-60% [1,12– 14].
In the field of radioactive geological disposal in France, reinforced concrete would be broadly used for waste packages, vaults, galleries or shafts that should remain stable during the
operating period (up to 120 years) in order to ensure retrievability of the waste emplaced in the repository (reversibility). During this period, atmospheric carbonation would be one of the main phenomena concrete will have to cope with. Atmospheric carbonation is not expected to
generate significant physical degradation by itself but rather through its major consequences (rebar corrosion). Due to the thermal output of some waste, the temperature in the vaults could be significantly higher than the ambient for several decades (it could reach 50 °C).
The effect of temperature is difficult to estimate because different contradictory mechanisms are at work. First, temperature modifies the solubility of the reactants: the higher the temperature, the lower the calcium [15,16] and CO2 contents in solution [17,18]. This effect is expected to
portlandite to check the influence of temperature between 10 and 40°C. They found that the higher the temperature, the lower the carbonation kinetics. The calcium carbonate crust formed around the portlandite grains was not found to inhibit carbonation [20,21] and the kinetic decrease with the temperature increase was therefore attributed to the decrease in the calcium solubility.
Temperature is also known to activate transport. Carbonation is a phenomenon driven by transport: a temperature increase is favourable to carbonation since it increases the diffusivity of CO2 through the carbonated layer towards the CaCO3 precipitation zone. In the same way,
calcium ionic diffusion from the sound core to the precipitation zone is also enhanced. Transport can be described using the classical Arrhenius activation law with an activation energy of about 15-20 kJ/mol for CO2 gas diffusion [22] and 44 kJ/mol for calcium diffusion [23,24].
Water retention is also affected by temperature: for a given RH, a temperature increase reduces the water retained at equilibrium [25–31]. Because the water content impacts both CO2 diffusion
and the chemical reactions, it is impossible to predict the influence of water retention modifications induced by temperature on carbonation. Moreover, temperature also impacts water transport; drying is faster when the temperature is increased [32–36]. From this perspective, the interaction between carbonation and water transport appears to be essential and even more important than at ambient temperature.
Several studies are available in the literature that address the effect of temperature on carbonation [1,37–44]. In these studies, carbonation was mainly characterized through the variations in the carbonated depth versus time using phenolphtalein projection. Papadakis et al. [1] observed limited increase in the carbonation kinetics between 22 and 42°C (about 15-20%) in their study using concretes (w/c=0.65). Similar results were obtained by He [42], Jae-Dong et al. [39] and Loo et al. [40] over small temperature ranges (between 15 °C and 40°C). Mori et al. [37] found that the carbonated depth at 40°C was twice the value obtained at 20°C. In the same way, Uomoto and Takada [38] reported a multiplication factor of 1.7 between 10 and 30°C,
Matsuzawa et al. [43] obtained a factor 2 between 20 and 60°C. and Li et al. [44] obtained a factor 3 between 10 and 60°C. The compilation of these results is shown in Figure 1. Despite some discrepancies and uncertainties, the trend is clear: the carbonation rate increases with temperature.
The results of Liu et al. [41] were quite different. They used samples prepared by compaction of recycled autoclaved lightweight concrete (ALC) and water to achieve target water content. It must be recalled here that 11 Å-tobermorite (C/S = 5/6) is the main component of ALC. The samples were carbonated at temperatures ranging from 20 to 100°C with 100% CO2 which was
introduced into the chamber after bubbling into water to prevent sample drying. Between 20 and 60°C, the amount of adsorbed CO2 strongly increased. Yet beyond 60°C, it decreased by
about 30% (between 60 and 100°C, Figure 2). It therefore seemed that 60°C was the optimal temperature for carbonation, i.e. the temperature at which the carbonation rate was maximal. According to the authors, the fall in absorbed CO2 above 60°C was attributed to the
temperature-induced decrease in solubility (Ca2+ and CO
2). This unexpected result was supported by the
modelling study of Ishida and Li [45]. They accounted for the temperature influence on CO2
dissolution and transport as well as on the solubility of calcium-bearing phases. Performing simulations between 10 and 50°C, they obtained an increase in the carbonation rate between 10 and 30°C and a decrease for higher temperatures. The value of 30°C itself is not significant because it depends on the input data. It is in fact important to consider that the two opposite effects of temperature can theoretically result in an optimal temperature for the carbonation rate.
At a first glance, all these results may appear contradictory, but it remains impossible to confirm this because most of them were obtained at temperatures below 60°C i.e. lower than the optimal temperature proposed by Liu et al. [41]. Moreover, all these experiments were not conducted using similar protocols (in terms of preconditioning, CO2 concentration) or materials, and
sometimes the preliminary drying was questionable as it can generally be said that most of the samples were probably not in equilibrium at the beginning of carbonation. The results might
therefore have inadvertently included the contribution of drying. For this reason, the main goal of this paper is to study the impact of temperature on the carbonation of two hardened cement pastes up to 80°C.
2. Materials and methods
2.1. Materials
We used two hardened pastes prepared using commercial cements, which were selected for their potential use in radioactive waste management in France:
CEM I (ordinary Portland cement including at least 95% clinker) from Lafarge, Val d’Azergues factory, France
CEM V/A (clinker with 22 wt% slag and 22 wt% fly ash) from Calcia, Airvault factory, France.
These two cements were selected by the French Radioactive Waste Management Agency (Andra) as references for all R&D studies. The water-to-binder ratio (w/b) of the pastes was fixed to enable comparison between the two pastes. We chose a w/b ratio of 0.40 because the properties of fresh paste seemed suitable, i.e. good workability, with neither visible segregation nor
bleeding. The elementary composition of each paste is given in Table 1.
All the samples were cast in laboratory conditions in seven consecutive batches spanning over two days. The fresh paste was poured into cylindrical moulds (Ø35 × H60 mm) and vibrated. The samples were then kept seven days at ambient temperature in their closed moulds. After
unmoulding, they were immersed three months in a small volume of solution in an airtight container to prevent carbonation. The curing solution composition was designed to prevent calcium and alkalis leaching [46,47].
The composition of the curing solution was determined by i) expression of the inner solution [48,49] of samples kept three months in sealed bags, and ii) analysis using ionic chromatography
(Table 2). The curing solution compositions were also determined before the samples were added and then at the end of the curing process: only small changes could be observed, which confirmed that there was no significant leaching.
After the cure, the top and bottom parts of the samples were cut off and discarded, resulting in Ø35×H50 mm samples which were assumed to be homogeneous. It was verified that the samples were fully saturated (no water uptake after 48 hours in water and a vacuum): no additional procedure was used to ensure initial saturation.
2.2. Specimen preparation and preconditioning
Once cured, the samples were divided into different sets (including at least four samples for each formulation), which were preconditioned at 20, 50 and 80°C with different RHs using airtight containers and saturated salt solutions. Table 3 summarises the solutions used for the three temperatures.
The containers were regularly opened and the samples weighed to compute their relative mass variation according to:
, (1)
(
∆𝑚 𝑚)
(𝑡) =𝑚(𝑡) ‒ 𝑚0
𝑚0
where 𝑚0 and 𝑚(𝑡) are the initial mass and the mass measured at the time t respectively. The deviation from equilibrium was estimated using the following equation:
. (2) 𝜀(𝑡) =
(
∆𝑚 𝑚)
(𝑡 + 1) ‒(
∆𝑚 𝑚)
(𝑡)(
∆𝑚 𝑚)
(𝑡)The pastes were assumed to be at equilibrium when ε became lower than 0.05%. These results (mass at equilibrium) were used to assess the water retention curves; see [31] for more details.
The cylinders were covered with overlapping adhesive aluminium foils [50], leaving only the top side accessible to carbonation and to ensuring that one-dimensional CO2 diffusion could occur.
The samples were then put back in the containers from which they were taken seven days before being submitted to carbonation. Note that all the sample sets were not used for accelerated carbonation (see after).
2.3. Accelerated carbonation
A specific device was designed to conduct accelerated carbonation experiments under controlled environmental conditions (Figure 3). It was composed of different components with different purposes. First a commercial climatic chamber was used to control temperature and RH in the volume used for the experiments (340 L). The chamber made it possible to perform experiments between 20 and 90°C and between 20 to 95% RH. A device was added to analyse and regulate the CO2 content within the chamber. It was composed of a commercial CO2 analyser (making use
of infra-red absorption), together with a complex system of pumps and servo-valves to remove the gas from the chamber, transferring it to the CO2 analyser and back to the chamber. When the
CO2 content in the chamber was lower than the target, pure CO2 was injected until both of them
corresponded. The analyser was automatically calibrated using ambient air (0,04% CO2) and
pure CO2 (100%). A gas cooling system (Peltier effect) was added between the chamber and the
analyser to prevent penalising water condensation inside the analyser.
A thermo-hygrometer and a CO2 sensor were introduced into the chamber to monitor the
conditions during the experiments. Figure 4 presents the results of a preliminary test conducted at 80°C, 70% RH and using 50% CO2. Despite the increased variability of the environmental
conditions induced by the addition of dry CO2 into the chamber (on day 1), the environment was
regulated correctly and the CO2 content revealed the fact that the variations remained limited.
These variations were much smaller than those defined in the French standard for the
accelerated carbonation test (NF P18-458), i.e. ± 3°C for temperature and ± 5% for RH and the CO2 content.
Accelerated carbonation tests were conducted at 50% CO2 for seven days (168 hours) using the
environmental conditions in which the samples were at equilibrium. A period of 7 days appeared as the best compromise between the time needed to test different configurations (temperature and RH) and the time needed for each test. After the test, the CO2 regulation
system was shut down and the CO2 withdrawn from the chamber by injection of compressed air.
The chamber could then be opened and the samples taken out for characterization.
It must be noted that accelerated carbonation using 50% CO2 is known to be unduly aggressive
and not representative of natural carbonation in terms of the consequences [51]. In this study, using 50% CO2 made it possible to perform all the carbonation tests in a reasonable time,
however, readers must keep in mind that the transposition of some of the results and
conclusions to natural carbonation is arguable. For more carbonation results on these pastes at lower CO2 concentration, the readers are referred to [52,53].
2.4. Characterization methods
After carbonation, the specimens were cut along their vertical axis. One part was sprayed with phenolphthalein and the carbonated depth was measured. The other part was cut into thin slices (about 500 µm thick) that were used for X-ray diffraction (XRD) and thermo-gravimetric
analysis (TGA).
XRD was used to characterize the mineralogical changes during carbonation. Data was collected using a PANalytical X'Pert diffractometer with an X'Celerator detector (CuKα, λ = 1.5405 Å). The analyses were performed directly on the disk surface [54]. The disks were scanned between 5 and 65° with a step size of 0.017°, for a total duration of 20 minutes. Plotting the diffracted intensity of the main peak of a phase versus depth provided a mineralogical profile from the surface exposed to CO2 to the noncarbonated core that was used to identify the presence of the
The XRD results were processed to estimate the polymorphic abundance of calcium carbonate (calcite, aragonite and vaterite) in the carbonated zone. To this end, we tried to use Rietveld
refinement but the results were not satisfactory because suitable model structures could not be found for the C-S-H [55] and the alternative methods such as PONCKS or that of Snellings [56] could not be easily used here because of carbonation itself. Rather, we found easier and more straightforward to use a modified version of the method proposed by Chung [57,58]: it is
presented in Appendix 1. It was used to estimate the weight fraction in the carbonated zone of vaterite ( ) and aragonite ( ) relative to that of calcite ( ) using: 𝑣 𝑎 𝑐
(3) 𝑥𝑣 𝑥𝑐=
(
𝑘𝑐 𝑘𝑣)
∫𝐼𝑣𝑑𝑣 ∫𝐼𝑐𝑑𝑣 (4) 𝑥𝑎 𝑥𝑐=(
𝑘𝑐 𝑘𝑎)
∫𝐼𝑎𝑑𝑣 ∫𝐼𝑐𝑑𝑣 with: 𝑥𝑖 mean value of the weight fraction of compound in the carbonated zone 𝑖 𝐼𝑖 is the diffracted intensity for the compound 𝑖
𝑘𝑖 ratio of intensity of the compound to that of corundum. 𝑖
TGA was used to quantify the amount of portlandite and calcium carbonate. Some disks were powdered and then introduced into a Netzsch STA 409 analyser. The sample (120 mg ± 1 mg) was left in the device for 72 hours at ambient temperature under a dry nitrogen flowrate (80 mL/min) to remove all evaporable water before it was heated from 25°C up to 1150°C at 10°C/min under a constant nitrogen flow (80 mL/min). The amount of portlandite and calcium carbonate was computed using the mass loss recorded between 400 and 550°C and between 600 and 900°C respectively.
3. Results
3.1. Initial state
The mineralogical assemblage obtained at 20°C and characterized using XRD (Figure 5) was considered usual for those binders. Portlandite, ettringite and C-S-H (broad peak around 29°) [59–63] were detected for CEM I, as well as traces of anhydrous compounds (C4AF and C2S). The
CEM V paste was similar to that of CEM I with monosulfoaluminate and traces of mullite and quartz. Table 5 lists some of the properties of the non-carbonated pastes obtained elsewhere [31].
The first desorption isotherms obtained at 20°C (Figure 6) are of type IV according to the classification originally proposed by Brunauer [64,65]: the monomolecular layer edification at low RH is clearly visible, as is the presence of a plateau near saturation (CEMV) representative of capillary condensation within a meso-porous medium. Whatever the paste, a temperature increase led to a significant reduction in the water retained at equilibrium with any arbitrary RH.
After the preconditioning period, the mineralogical assemblage at 50 and 80°C was more or less the same as that of 20°C: for PV (CEM V/A) katoite (Ca3Al2(SiO4)(OH)8, see [66]) was detected at
the expense of ettringite and monosulfoaluminate [67–69] (Table 6). Results of TGA tests
conducted on CEM I samples preconditioned at 20 and 80°C showed that the portlandite content remained stable (around 5.8 mol/L of paste) whatever the RH (Figure 7). This indicates that the 3-month cure was long enough for the CEM I paste to reach maturity. Conversely, the portlandite content of the CEM V/A samples kept at 80°C decreased when the RH increased. This was
assumed to be an indication of ongoing hydration (due to pozzolanic reactions) during the preconditioning. We believe that this may have impacted the results of the CEM V/A pastes, but we did not attempt to quantify it.
3.2. Impact of carbonation on mineralogy
Regardless of the temperature and RH, the XRD results (Figure 8) showed the precipitation of the three usual polymorphs of calcium carbonate, i.e. calcite, aragonite and vaterite [70,71], at the expense of portlandite. In most cases, portlandite was not completely depleted in the carbonated zone. It was believed (but not verified) that the precipitation of calcium carbonate around the crystals of portlandite tended to inhibit the dissolution of portlandite [72–75] (Table 7).
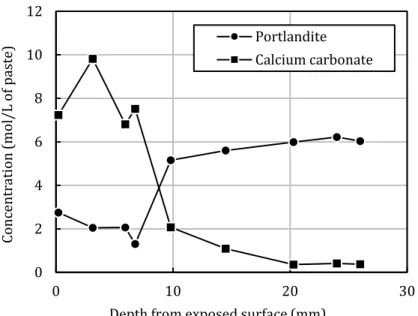
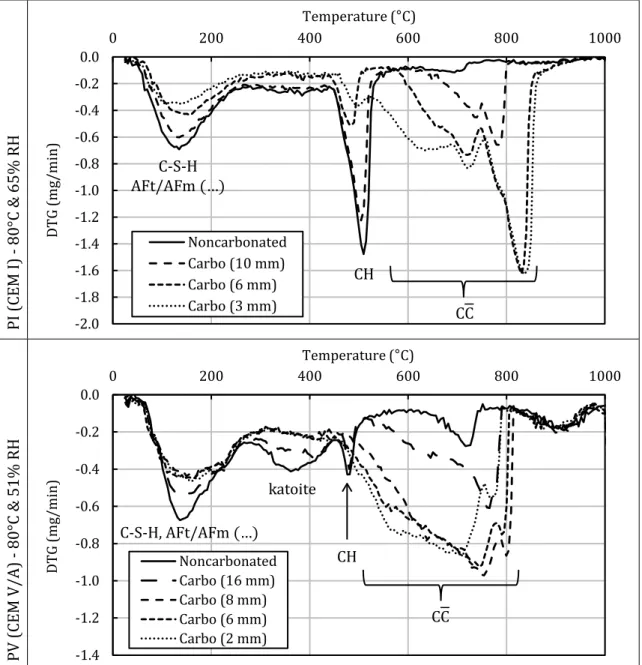
Using TGA (Figure 9), a carbonation profile (portlandite and calcium carbonate concentrations versus depth) was determined for the CEM I paste carbonated at 80°C and 65% RH. The resulting profile was very similar to that obtained using XRD (Figure 8), thus confirming that XRD could be used in a semi-quantitative approach [76]. The decrease in the mass loss between 25°C and 200°C observed on DTG (Figure 10) was attributed to the carbonation of C-S-H [77,78]. The decomposition of calcium carbonate appeared to be characterized by different peaks
ranging from 550 to 900°C as has already been observed in the past [6,77,79,80]. This was assumed to be due to the presence of aragonite and vaterite (and perhaps also to amorphous calcium carbonate) in addition to calcite [79–81]. It sometimes proved hard to distinguish the decomposition peak of portlandite from those of calcium carbonate, rendering the quantification process difficult.
Using the modified RIR method, the mean value of the weight fractions of aragonite ( ) and 𝑥𝑎 vaterite ( ) relative to that of calcite ( ) could be computed. In most cases, the amounts of 𝑥𝑣 𝑥𝑐 vaterite and aragonite increased when the RH decreased (Figure 11). At high RH, calcite was the major calcium carbonate (ratio close to zero), but it no longer appeared to be the major calcium carbonate at low RH. For instance, considering the CEM I paste carbonated at 80°C and 26% RH, the weight fraction of aragonite in the carbonated zone was four times that of calcite. Aragonite also always appeared in higher amounts than vaterite. The results obtained at 20°C for the CEM I
paste were quite different from all the others; they may not be reliable because of the very small carbonation depth (Figure 12).
These results were interpreted as follows. The presence of metastable forms of calcium
carbonate (vaterite and aragonite) together with the stable form (calcite) was considered as an intrinsic feature of carbonation because it has been broadly observed for years [70,82,83] and because of the temperature increase in the present tests [84,85]. Aragonite and vaterite are generally obtained in the carbonation of C-S-H and sulfoaluminate phases [68,71,81,86–88]. The increase in the polymorphic abundance at low RH was believed to be due to the inhibition of the polymorphic transformation from the metastable state to the thermodynamically stable one [84,89,90] due to the lack of water in the pores [91].
3.3. Carbonation depth
Figure 12 shows the measured carbonation depths versus RH. The results depicted the well-known bell curves for both pastes, with a maximum at around 50% RH [1,12–14]. It must, however, be noted that the 20°C-optimal RH of the CEM V paste was much lower: around 33%. This was believed to be due to its unusual type IV water retention curve (plateau at high RH) that required a very low RH (down to 26%) to desaturate the pore system (Figure 6) [31]. For CEM I, the fact that the optimal RH remained the same for all three temperatures tended to indicate that the temperature-induced modification of the water retention was minor for carbonation but this was not confirmed by the CEM V results that were clearly changed beyond 20°C. Whatever the temperature, the carbonation depth of the composite cement (CEM V/A) paste was greater than that of Portland (CEM I) as we already know [11,92–96].
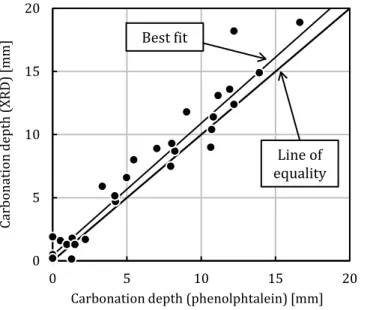
Figure 13 compares the carbonation depth values measured using phenolphthalein and XRD. In the latter case, we used the mineralogical profiles to evaluate the depth at which the portlandite peak intensity became lower than the average obtained in the non-carbonated zone (Figure 8). Unlike the results of references [6,97,98], the comparison was quite good: all the data aligned
along the equality line, although the carbonation depth obtained using XRD was almost always greater than that obtained using phenolphthalein. This was believed to be due to the short duration of the experiments (7 days) that helped reduce the difference between the two methods.
The carbonated zone appeared to be frequently cracked as has already been observed, see references [52,53,99–101]. Figure 14 illustrates the cracking patterns obtained at 80°C between 26% and 76% RH. For both cements, the cracking increased when the RH decreased: cracking was thus believed to be due to a combination of desiccation and carbonation shrinkage [14,102– 104]. Furthermore, the CEM V/A pastes were generally cracked more severely than the CEM I. This was believed to be due to the greater amount of C-(A)-S-H in the CEM V/A paste, which induced more shrinkage when they were decalcified [103,105]
4. Discussion
Figure 15(a) reports the maximal carbonation depth obtained at a given temperature as a function of the test temperature. The latter appeared to increase the depth of carbonation, though not in the same way for both cements. Considering the CEM I paste, the carbonation depth increased almost linearly with temperature: the maximal carbonation depth increased threefold between 20 and 80°C. Obviously, the thermo-activation of CO2 transport and chemical
reactions controlled the temperature influence on carbonation. This was consistent with most of the results in literature [37–40,43,44] - see Figure 15(b). The results of the CEM V/A paste were quite different. The carbonation rate increased between 20 and 50°C, but decreased between 50 and 80°C; the rate at 80°C remained greater than that of 20°C. The results clearly show that temperature has an accelerating effect, but with a maximum at 50°C. This observation is consistent with the results of Liu et al. [41].
Such a difference between the two pastes was not expected because all the samples were submitted to the same test sequence. This difference was thought to result from the differences
in their mineralogical composition and properties (Table 5): less portlandite and more C-(A)-S-H for the CEM V paste with regards to CEM I. The reduced C/S ratio of the C-(A)-S-H in the CEM V paste [106–109] may also have played a prominent role, as the calcium concentration at equilibrium is known to be lower (whatever the temperature between 25°C and 85°C) [16].
5. Conclusion
In the field of radioactive waste management, the impact of temperature on the atmospheric carbonation of cement-based materials was investigated. Two hardened cement pastes made with CEM I and CEM V/A were carbonated at three temperatures ranging from 20 and 80°C. The tests were conducted at different RH with 50% CO2 using a device that was specifically set up for
this purpose. The device was designed to maintain the temperature, RH and CO2 content over
large ranges with great accuracy. Prior to carbonation, all the paste samples were brought as close to hygral equilibrium as possible. The pastes were carbonated 7 days and then the samples were tested using phenolphthalein, XRD and TGA.
The results showed that the carbonation process was not significantly impacted at temperatures higher than the ambient temperature: the calcium-bearing phases were dissolved to precipitate calcium carbonate. The two metastable forms of calcium carbonate (aragonite and vaterite) were always observed in varying amounts. Their presence was inferred to be an intrinsic feature of carbonation. Furthermore, the amount of metastable phases increased when the RH
decreased: this indicates that the polymorphic transformation into calcite was inhibited due to the lack of water.
In terms of carbonation rate, temperature was found to accelerate carbonation though not in the same manner for the two pastes. The carbonation rate of the CEM I paste increased linearly with temperature between 20 and 80°C, whereas that of the CEM V/A paste reached a maximum at around 50°C. This disparity was thought to be due to differences in the mineralogical
Acknowledgments
Financial support from the French Agency for Radioactive Waste Management (Andra) and the French Alternative Energies and Atomic Energy Commission (CEA) is gratefully acknowledged. The authors would like to thank Patrick Rougeau (CERIB) who was of great help in the
development of the accelerated carbonation device. Fruitful discussions with and help from Jérôme Verdier (LMDC Toulouse) were greatly appreciated.
References
[1] V.G. Papadakis, C.G. Vayenas, M.N. Fardis, Fundamental modeling and experimental investigation of concrete carbonation, ACI Mater. J. 88 (1991) 363–373.
[2] A.V. Saetta, B.A. Schrefler, R.V. Vitaliani, 2-D model for carbonation and moisture/heat flow in porous materials, Cem. Concr. Res. 25 (1995) 1703–1712. doi:10.1016/0008-8846(95)00166-2.
[3] A. V. Saetta, R. V. Vitaliani, Experimental investigation and numerical modeling of carbonation process in reinforced concrete structures Part I: Theoretical formulation, Cem. Concr. Res. 34 (2004) 571–579. doi:10.1016/j.cemconres.2003.09.009.
[4] B. Bary, A. Sellier, Coupled moisture - Carbon dioxide-calcium transfer model for carbonation of concrete, Cem. Concr. Res. 34 (2004) 1859–1872.
doi:10.1016/j.cemconres.2004.01.025.
[5] B. Bary, C. Mügler, Simplified modelling and numerical simulations of concrete carbonation in unsaturated conditions, Rev. Eur. Génie Civ. 10 (2006) 1049–1072. doi:10.1080/17747120.2006.9692905.
[6] M. Thiery, G. Villain, P. Dangla, G. Platret, Investigation of the carbonation front shape on cementitious materials: Effects of the chemical kinetics, Cem. Concr. Resear. 37 (2007) 1047–1058. doi:10.1016/j.cemconres.2007.04.002.
[7] N. Hyvert, A. Sellier, F. Duprat, P. Rougeau, P. Francisco, Dependency of C-S-H carbonation rate on CO2 pressure to explain transition from accelerated tests to natural carbonation, Cem. Concr. Res. 40 (2010) 1582–1589. doi:10.1016/j.cemconres.2010.06.010.
[8] C. Giarma, Estimation of carbonation depth based on hygrothermal calculations, ACI Mater. J. 108 (2011) 209–218.
[9] M.R. Jones, R.K. Dhir, M.D. Newlands, a. M.O. Abbas, A study of the CEN test method for measurement of the carbonation depth of hardened concrete, Mater. Struct. 33 (2000) 135–142. doi:10.1007/BF02484168.
[10] I. Monteiro, F.A. Branco, J. De Brito, R. Neves, Statistical analysis of the carbonation coefficient in open air concrete structures, Constr. Build. Mater. 29 (2012) 263–269. doi:10.1016/j.conbuildmat.2011.10.028.
[11] P.H.R. Borges, N.B. Milestone, J.O. Costa, C.J. Lynsdale, T.H. Panzera, A.L. Christophoro, Carbonation durability of blended cement pastes used for waste encapsulation, Mater.
Struct. 45 (2012) 663–678. doi:10.1617/s11527-011-9788-8.
[12] H.J. Wierig, Long-term studies on the carbonation of concrete under normal outdoor exposure, in: R.C.P.C. CPC14 (Ed.), Rilem Semin. Durab. Concr. Struct. under Norm. Outdoor Expo., Rilem, Hannover (Germany), 1984: pp. 239–249.
[13] I. Galan, C. Andrade, M. Castellote, Natural and accelerated CO2 binding kinetics in cement paste at different relative humidities, Cem. Concr. Res. 49 (2013) 21–28.
doi:10.1016/j.cemconres.2013.03.009.
[14] G.J. Verbeck, Carbonation of Hydrated Portland Cement, ASTM Spec. Tech. Publ. 205 (1958) 17–36.
[15] H. Bassett, Notes on the system lime-water, and the determination of calcium, J. Chem. Soc. (1934) 1270–1275. doi:10.1039/JR9340001270.
[16] F.P. Glasser, J. Pedersen, K. Goldthorpe, M. Atkins, Solubility reactions of cement
components with NaCl solutions: I. Ca(OH)2 and C-S-H, Adv. Cem. Res. 17 (2005) 57–64. doi:10.1680/adcr.2005.17.2.57.
[17] R. Crovetto, Evaluation of Solubility Data of the System CO2–H2O from 273 K to the Critical Point of Water, J. Phys. Chem. Ref. Data. 20 (1991) 575–589.
doi:10.1063/1.555905.
[18] J.J. Carroll, J.D. Slupsky, A.E. Mather, The solubility of carbon dioxide in water at low pressure, J. Phys. Chem. Ref. Data. 20 (1991) 1201–1209. doi:10.1063/1.555900. [19] R.M. Dheilly, J. Tudo, Y. Sebaibi, M. Quéneudec, Influence of storage conditions on the
carbonation of powdered Ca(OH)2, Constr. Build. Mater. 16 (2002) 155–161. doi:10.1016/S0950-0618(02)00012-0.
[20] D.T. Beruto, R. Botter, Liquid-like H2O adsorption layers to catalyze the Ca(OH)2/CO2 solid-gas reaction and to form a non-protective solid product layer at 20°C, J. Eur. Ceram. Soc. 20 (2000) 497–503. doi:10.1016/S0955-2219(99)00185-5.
[21] G. Montes-Hernandez, D. Daval, R. Chiriac, F. Renard, Growth of nanosized calcite through gas-solid carbonation of nanosized portlandite under anisobaric conditions, Cryst.
Growth Des. 10 (2010) 4823–4830. doi:10.1021/cg100714m.
[22] B. Madé, A. Clément, B. Fritz, Modélisation thermodynamique et cinétique des réactions diagénétiques dans les bassins sédimentaires (in French), Rev. l’Institut Français Du Pétrole. 49 (1994) 569–602.
[23] M. Fuhrmann, R. Pietrzak, J. Heiser III, E.-M. Franz, P. Colombo, The effects of temperature on the leaching behavior of cement waste forms - the cement/sodium sulfate system, Mater. Res. Soc. Symp. Proc. 176 (1990) 75–80.
[24] S. Goñi, M.S. Hernandez, A. Guerrero, M.P. Lorenzo, Effect of temperature on the leaching performance of a simulated cement-based immobilization system. Calcium and hydroxyl behaviour, Constr. Build. Mater. 10 (1996) 171–177. doi:10.1016/0950-0618(95)00082-8.
[25] J. Hundt, H. Kantelberg, Sorptionsuntersuchungen an zemenstein, zementmörtel und beton (in German), Dtsch. Aussch. Stahlbet. 297 (1978) 25–39.
[26] J.-F. Daïan, Condensation and isothermal water transfer in cement mortar Part I - Pore size distribution, equilibrium water condensation and imbibition, Transp. Porous Media. 3 (1988) 563–589.
[27] F. Radjy, E.J. Sellevold, K.K. Hansen, Temperature data for water sorption in hardened cement paste: enthalpy, entropy and sorption isotherms at different temperatures, Report 057, Technical University of Denmark (Lyngby Denmark), 2003.
[28] T. Ishida, K. Maekawa, T. Kishi, Enhanced modeling of moisture equilibrium and transport in cementitious materials under arbitrary temperature and relative humidity history, Cem. Concr. Res. 37 (2007) 565–578. doi:10.1016/j.cemconres.2006.11.015.
[29] S. Poyet, Experimental investigation of the effect of temperature on the first desorption isotherm of concrete, Cem. Concr. Res. 39 (2009) 1052–1059.
doi:10.1016/j.cemconres.2009.06.019.
[30] F. Brue, C.A. Davy, F. Skoczylas, N. Burlion, X. Bourbon, Effect of temperature on the water retention properties of two high performance concretes, Cem. Concr. Res. 42 (2012) 384– 396. doi:10.1016/j.cemconres.2011.11.005.
[31] E. Drouet, S. Poyet, J.-M. Torrenti, Temperature influence on water transport in hardened cement pastes, Cem. Concr. Res. 76 (2015) 37–50. doi:10.1016/j.cemconres.2015.05.002. [32] N.L. Hancox, The role of moisture diffusion in the drying of cement paste under the
influence of temperature fradients, J. Phys. D. 1 (1968) 1769–1777.
[33] B.P. Hughes, I.R.G. Lowe, J. Walker, The diffusion of water in concrete at temperatures between 50 and 95°C, Br. J. Appl. Phys. 17 (1966) 1545–1552.
[34] G.M. Glover, E. Raask, Water diffusion and microstructure of hydrated cement pastes, Mater. Struct. 5 (1972) 315–322.
[35] S. Wong, T. Wee, S. Swaddiwudhipong, S. Lee, Study of water movement in concrete, Mag. Concr. Res. 53 (2001) 205–220.
[36] R. Cerný, J. Drchalová, P. Rovnanı́ková, The effects of thermal load and frost cycles on the water transport in two high-performance concretes, Cem. Concr. Res. 31 (2001) 1129– 1140. doi:10.1016/S0008-8846(01)00556-7.
[37] T. Mori, K. Shiroyama, K. Kamimura, A. Yoda, On carbonation of Portland blast-furnace slag cement concrete, in: Proc. 26th Gen. Meet. Cem. Assoxiation Japan, The Cement Association of Japan, Tokyo (Japan), 1972: pp. 184–188.
[38] T. Uomoto, Y. Takada, Factors affecting concrete carbonation ratio, Concr. Libr. JSCE. 21 (1993) 31–44.
[39] J. Jae-Dong, K. Hirai, H. Mihashi, Influence of Environmental Moisture and Temperature on Carbonation of Mortar (in Japanese), Concr. Res. Technol. 1 (1990) 85–94.
[40] Y. Loo, M. Chin, C. Tam, K. Ong, A carbonation prediction model for accelerated carbonation testing of concrete, Mag. Concr. Res. 46 (1994) 191–200.
[41] L. Liu, J. Ha, T. Hashida, S. Teramura, Development of a CO2 solidification method for recycling autoclaved lightweight concrete waste, J. Mater. Sci. Lett. 20 (2001) 1791–1794. doi:10.1023/A:1012591318077.
[42] R. He, A Study on Carbonation for Low Calcium Fly Ash Concrete under Different Temperature and Relative Humidity, Electron. J. Geotech. Eng. 15 (2010) 1871–1877. http://www.ejge.com/2010/Ppr10.137/Ppr10.137.pdf.
[43] K. Matsuzawa, Y. Kitsutaka, M. Tsukagoshi, Effect of Humidity on Rate of Carbonation of Concrete Exposed to High-Temperature Environment, in: 4th Int. Symp. Ageing Manag. Maint. Nucl. Power Plants (ISaG 2010), Mitsubishi Research Institute, University of Tokyo (Japan), 2010: pp. 109–114. http://nisaplm.jp/html/img/04_reseach/PDF/Concrete Durability-2.pdf.
[44] G. Li, Y. Yuan, J. Du, Y. Ji, Determination of the apparent activation energy of concrete carbonation, J. Wuhan Univ. Technol. Mater. Sci. 28 (2013) 944–949.
doi:10.1007/s11595-013-0798-y.
Coupling of Mass Transport and Equilibrium in Micro-Pore Structure of Concrete, J. Adv. Concr. Technol. 6 (2008) 303–316. doi:10.2208/jsceje.63.274.
[46] K. Kobayashi, Y. Uno, Influence of alkali on carbonation of concrete, part 1. Preliminary tests with mortar specimens, Cem. Concr. Res. 19 (1989) 821–826.
[47] K. Kobayashi, Y. Uno, Influence of alkali on carbonation of concrete, part 2 - Influence of alkali in cement on rate of carbonation of concrete, Cem. Concr. Res. 20 (1990) 619–622. doi:10.1016/0008-8846(90)90104-6.
[48] R.S. Barneyback, S. Diamond, Expression and analysis of pore fluids from hardened cement pastes and mortars, Cem. Concr. Res. 11 (1981) 279–285.
[49] M. Cyr, P. Rivard, F. Labrecque, A. Daidié, High-pressure device for fluid extraction from porous materials: Application to cement-based materials, J. Am. Ceram. Soc. 91 (2008) 2653–2658. doi:10.1111/j.1551-2916.2008.02525.x.
[50] F. Toutlemonde, F. Le Maou, Protection des éprouvettes de béton vis-à-vis de la
dessiccation - le point sur quelques techniques de laboratoire (in French), Bull. Des Lab. Des Ponts Chaussées. 203 (1996) 105–119.
[51] M. Castellote, L. Fernandez, C. Andrade, C. Alonso, Chemical changes and phase analysis of OPC pastes carbonated at different CO2 concentrations, Mater. Struct. 42 (2009) 515– 525. doi:10.1617/s11527-008-9399-1.
[52] M. Auroy, S. Poyet, P. Le Bescop, J.M. Torrenti, T. Charpentier, M. Moskura, et al., Impact of carbonation on unsaturated water transport properties of cement-based materials, Cem. Concr. Res. 74 (2015) 44–58. doi:10.1016/j.cemconres.2015.04.002.
[53] M. Auroy, S. Poyet, P. Le Bescop, J.-M. Torrenti, T. Charpentier, M. Moskura, et al., Comparison between natural and accelerated carbonation (3% CO2): impact on
mineralogy, microstructure, water retention and cracking, Cem. Concr. Res. 109 (2018) 64–80. https://doi.org/10.1016/j.cemconres.2018.04.012.
[54] G. Le Saoût, T. Füllmann, V. Kocaba, K.L. Scrivener, Quantitative study of cementitous materials by x-ray diffraction - Rietveld analysis using an external standard, in: J.J. Beaudoin, J.M. Makar, L. Raki (Eds.), Proc. 12th Int. Congr. Chem. Cem., Cement Association of Canada, Montréal (Canada), 2007: p. 12p.
[55] I.G. Richardson, Model structures for C-(A)-S-H(I), Acta Crystallogr. Sect. B Struct. Sci. Cryst. Eng. Mater. 70 (2014) 903–923. doi:10.1107/S2052520614021982.
[56] R. Snellings, X-ray powder diffraction applied to cement, in: A Pract. Guid. to Microstruct. Anal. Cem. Mater., 2016: pp. 107–176.
[57] F.H. Chung, Quantitative interpretation of X-ray diffraction patterns of mixtures. I. Matrix-flushing method for quantitative multicomponent analysis, J. Appl. Crystallogr. 7 (1974) 519–525. doi:10.1107/S0021889874010375.
[58] F.H. Chung, Quantitative interpretation of X-ray diffraction patterns of mixtures. II. Adiabatic principle of X-ray diffraction analysis of mixtures, J. Appl. Crystallogr. 7 (1974) 526–531. doi:10.1107/S0021889874010387.
[59] K. Mohan, H.F.W. Taylor, Analytical Electron Microscopy of Cement Pastes: IV, β-Dicalcium Silicate Pastes, J. Am. Ceram. Soc. 64 (1981) 717–719. doi:10.1111/j.1151-2916.1981.tb15893.x.
[60] A. Nonat, The structure and stoichiometry of C-S-H, Cem. Concr. Res. 34 (2004) 1521– 1528. doi:10.1016/j.cemconres.2004.04.035.
[61] K. Garbev, G. Beuchle, M. Bornefeld, L. Black, P. Stemmermann, Cell dimensions and composition of nanocrystalline calcium silicate hydrate solid solutions. Part 1:
synchrotron-based x-ray diffraction, J. Am. Ceram. Soc. 91 (2008) 3005–3014. doi:10.1111/j.1551-2916.2008.02484.x.
[62] S. Grangeon, F. Claret, Y. Linard, C. Chiaberge, X-ray diffraction: A powerful tool to probe and understand the structure of nanocrystalline calcium silicate hydrates, Acta
Crystallogr. Sect. B Struct. Sci. Cryst. Eng. Mater. 69 (2013) 465–473. doi:10.1107/S2052519213021155.
[63] S. Komarneni, E. Breval, Synthesis and Characterization of a 12.6A calcium silica hydrate, Cem. Concr. Res. 16 (1986) 580–586.
[64] K.S.W. Sing, D.H. Everett, R.A.W. Haul, L. Moscou, R.A. Pierotti, J. Rouquérol, et al., Reporting physisorption data for gas/solid systems with special reference to the
determination of surface area and porosity (Recommendations 1984), Pure Appl. Chem. 57 (1985) 603–619. doi:10.1351/pac198557040603.
[65] J.B. Condon, Surface area and porosity determinations by physisorption, measurements and theory, 1st ed., Elsevier, 2006. doi:10.1017/CBO9781107415324.004.
[66] E. Passaglia, R. Rinaldi, Katoite, a new member of the
Ca3Al2(SiO4)3-Ca3Al2(SiO4)3(OH)12 series and a new nomenclature for the hydrogrossular group of minerals, Bull. Minéralogie. 107 (1984) 605–618.
[67] M. Paul, F.P. Glasser, Impact of prolonged warm (85 °C) moist cure on Portland cement paste, Cem. Concr. Res. 30 (2000) 1869–1877. doi:10.1016/S0008-8846(00)00286-6. [68] Q. Zhou, F. Glasser, Kinetics and mechanism of the carbonation of ettringite, Adv. Cem.
Res. 12 (2000) 131–136.
[69] J.M. Rivas Mercury, X. Turrillas, A.H. de Aza, P. Pena, Calcium aluminates hydration in presence of amorphous SiO2 at temperatures below 90 °C, J. Solid State Chem. 179 (2006) 2988–2997. doi:10.1016/j.jssc.2006.05.017.
[70] W.F. Cole, B. Kroone, Carbonate minerals in hydrated Portland cement, Nature. 184 (1959) BA57.
[71] P.A. Sledgers, P.G. Rouxhet, Carbonation of the hydration products of tricalcium silicate, Cem. Concr. Res. 6 (1976) 381–388.
[72] A.M. Dunster, An investigation of the carbonation of cement paste using trimethylsilylation, Adv. Cem. Res. 2 (1989) 99–106.
[73] J.R. Johnstone, F.P. Glasser, Carbonation of portlandite single crystals and portlandite in cement paste, in: 1992.
[74] I. Galan, F.P. Glasser, D. Baza, C. Andrade, Assessment of the protective effect of carbonation on portlandite crystals, Cem. Concr. Res. 74 (2015) 68–77.
doi:10.1016/j.cemconres.2015.04.001.
[75] D. Huntzinger, J. Gierke, S. Kawatra, T.C. Eisele, L.L. Sutter, Carbon Dioxide Sequestration in Cement Kiln Dust through Mineral Carbonation, Environ. Sci. Technol. 43 (2009) 1986– 1992.
[76] C.F. Chang, J.W. Chen, The experimental investigation of concrete carbonation depth, Cem. Concr. Res. 36 (2006) 1760–1767. doi:10.1016/j.cemconres.2004.07.025.
[77] A. Morandeau, M. Thiéry, P. Dangla, Investigation of the carbonation mechanism of CH and C-S-H in terms of kinetics, microstructure changes and moisture properties, Cem. Concr. Res. 56 (2014) 153–170. doi:10.1016/j.cemconres.2013.11.015.
[78] P. Yu, R. Kirkpatrick, Thermal dehydration of tobermorite and jennite, Concr. Sci. Eng. 1 (1999) 185–191.
com/login.aspx?direct=true&db=aph&AN=70601905&site=eds-live&scope=site. [79] G. Villain, G. Platret, Two experimental methods to determine carbonation profiles in
concrete, ACI Mater. J. 103 (2006) 265–271.
[80] J. Peric, M. Vucak, R. Krstulovic, Ljerka Brečević;, D. Kralj, Phase transformation of calcium carbonate polymorphs.pdf, Thermochim. Acta. 277 (1996) 175–186.
[81] Z. Šauman, Carbonization of porous concrete and its main binding components, Cem. Concr. Res. 1 (1971) 645–662.
[82] S. Goñi, M.T. Gaztañaga, A. Guerrero, Role of Cement Type on Carbonation Attack, J. Mater. Res. 17 (2002) 1834–1842. doi:10.1557/JMR.2002.0271.
[83] D.J. Anstice, C.L. Page, M.M. Page, The pore solution phase of carbonated cement pastes, Cem. Concr. Res. 35 (2005) 377–383. doi:10.1016/j.cemconres.2004.06.041.
[84] T. Ogino, T. Suzuki, K. Sawada, The formation and transformation mechanism of calcium carbonate in water, Geochim. Cosmochim. Acta. 51 (1987) 2757–2767.
[85] J. Kawano, N. Shimobayashi, A. Miyake, M. Kitamura, Precipitation diagram of calcium carbonate polymorphs: its construction and significance, J. Physics. Condens. Matter. 21 (2009) 425102. doi:10.1088/0953-8984/21/42/425102.
[86] T. Nishikawa, K. Suzuki, S. Ito, K. Sato, T. Takebe, Decomposition of synthesized ettringite by carbonation, Cem. Concr. Res. 22 (1992) 6–14. doi:10.1016/0008-8846(92)90130-N. [87] L. Black, C. Breen, J. Yarwood, K. Garbev, P. Stemmermann, B. Gasharova, Structural
features of C-S-H(I) and its carbonation in air-A Raman spectroscopic study. Part II: Carbonated phases, J. Am. Ceram. Soc. 90 (2007) 908–917. doi:10.1111/j.1551-2916.2006.01429.x.
[88] S. Martínez-Ramírez, L. Fernández-Carrasco, Carbonation of ternary cement systems, Constr. Build. Mater. 27 (2012) 313–318. doi:10.1016/j.conbuildmat.2011.07.043.
[89] T. Ogino, T. Suzuki, K. Sawada, The rate and mechanism of polymorphic transformation of calcium carbonate in water, J. Cryst. Growth. 100 (1990) 159–167. doi:10.1016/0022-0248(90)90618-U.
[90] K. Sawada, The mechanisms of crystallization and transformation of calcium carbonates, Pure Appl. Chem. 69 (1997) 921–928. doi:10.1351/pac199769050921.
[91] X. Xu, J.T. Han, D.H. Kim, K. Cho, Two Modes of Transformation of Amorphous Calcium Carbonate Films in Air, J. Phys. Chem. B. 110 (2006) 2764–2770.
[92] M. Maage, Carbonation in concrete made of blended cements, Mater. Res. Soc. Symp. Proc. 65 (1986) 193–198.
[93] L. Jiang, B. Lin, Y. Cai, A model for predicting carbonation of high-volume fly ash concrete, Cem. Concr. Res. 30 (2000) 699–702. doi:10.1016/S0008-8846(00)00227-1.
[94] J. Khunthongkeaw, S. Tangtermsirikul, T. Leelawat, A study on carbonation depth prediction for fly ash concrete, Constr. Build. Mater. 20 (2006) 744–753.
doi:10.1016/j.conbuildmat.2005.01.052.
[95] V.G. Papadakis, Effect of supplementary cementing materials on concrete resistance against carbonation and chloride ingress, Cem. Concr. Res. 30 (2000) 291–299.
[96] A. Morandeau, M. Thiéry, P. Dangla, Impact of accelerated carbonation on OPC cement paste blended with fly ash, Cem. Concr. Res. 67 (2015) 226–236.
doi:10.1016/j.cemconres.2014.10.003.
[97] Y.F. Houst, F.H. Wittmann, Depth profiles of carbonates formed during natural carbonation, Cem. Concr. Res. 32 (2002) 1923–1930.
doi:10.1016/S0008-8846(02)00908-0.
[98] Y.S. Ji, M. Wu, B. Ding, F. Liu, F. Gao, The experimental investigation of width of semi-carbonation zone in carbonated concrete, Constr. Build. Mater. 65 (2014) 67–75. doi:10.1016/j.conbuildmat.2014.04.095.
[99] P.H.R. Borges, J.O. Costa, N.B. Milestone, C.J. Lynsdale, R.E. Streatfield, Carbonation of CH and C-S-H in composite cement pastes containing high amounts of BFS, Cem. Concr. Res. 40 (2010) 284–292. doi:10.1016/j.cemconres.2009.10.020.
[100] J. Han, W. Sun, G. Pan, W. Caihui, Monitoring the evolution of accelerated carbonation of hardened cement pastes by X-Ray Computed Tomography, J. Mater. Civ. Eng. 25 (2013) 347–354.
[101] K. Wan, Q. Xu, Y. Wang, G. Pan, 3D spatial distribution of the calcium carbonate caused by carbonation of cement paste, Cem. Concr. Compos. 45 (2014) 255–263.
doi:10.1016/j.cemconcomp.2013.10.011.
[102] K. Kamimura, P.J. Sereda, E.G. Swenson, Changes in weight and dimensions in the drying and carbonation of Portland cement mortars, Mag. Concr. Res. 17 (1965) 5–14.
[103] E.G. Swenson, P.J. Sereda, Mechanism of the carbonation shrinkage of lime and hydrated cement, J. Appl. Chem. 18 (1968) 111–117.
[104] Y.F. Houst, Carbonation Shrinkage of Hydrated Cement Paste, in: V.M. Malhotra (Ed.), 4th CANMET/ACI Int. Conf. Durab. Concr., ACI, Sydney (Australia), 1997: pp. 481–491.
[105] J.J. Chen, J.J. Thomas, H.M. Jennings, Decalcification shrinkage of cement paste, Cem. Concr. Res. 36 (2006) 801–809. doi:10.1016/j.cemconres.2005.11.003.
[106] S.A. Rodger, G.W. Groves, Electron-Microscopy Study of Ordinary Portland-Cement and Ordinary Portland Cement-Pulverized Fuel Ash Blended Pastes, J. Am. Ceram. Soc. 72 (1989) 1037–1039. doi:10.1111/j.1151-2916.1989.tb06265.x.
[107] M. Atkins, E.E. Lachowski, F.P. Glasser, Investigation of solid and aqueous chemistry of 10-year-old Portland cements pastes; with and without silica modifier, Adv. Cem. Res. 5 (1993) 97–102.
[108] R. Taylor, I.G. Richardson, R.M.D. Brydson, Composition and microstructure of 20-year-old ordinary Portland cement-ground granulated blast-furnace slag blends containing 0 to 100% slag, Cem. Concr. Res. 40 (2010) 971–983. doi:10.1016/j.cemconres.2010.02.012. [109] Q. Wang, J. Feng, P. Yan, The microstructure of 4-year-old hardened cement-fly ash paste,
Constr. Build. Mater. 29 (2012) 114–119. doi:10.1016/j.conbuildmat.2011.08.088. [110] L. Alexander, P.H. Klug, Basic aspects of x-ray diffraction in quantitative difraction
analysis of powder mixtures, Anal. Chem. 20 (1948) 886–889. doi:10.1021/ac60022a002. [111] C.R. Hubbard, E.H. Evans, D.K. Smith, The reference intensity ratio, I/Ic, for computer
simulated powder patterns, J. Appl. Crystallogr. 9 (1976) 169–174. doi:10.1107/S0021889876010807.
[112] D.S. Carr, B.L. Harris, Solutions for Maintaining Constant Relative Humidity, Ind. Eng. Chem. Res. 41 (1949) 2014–2015. doi:10.1021/ie50477a042.
[113] A. Wexler, S. Hasegawa, Relative humidity-temperature relationships of some staurated salt solutions in the temperature range 0° to 50°C, J. Res. Natl. Bur. Stand. (1934). 53 (1954) 19–26.
[114] A. Schneider, Neue Diagramme zur Bestimmung der relativen Luftfeuchtigkeit über gesättigten wässerigen Salzlösungen und wässerigen Schwefelsäurelösungen bei verschiedenen temperaturen (in German), Zeitschrift Holz Als Roh- Und Werkst. 18 (1960) 269–272. doi:10.1007/BF02627216.
[115] J.F. Young, Humidity control in the laboratory using salt solutions - a review, J. Appl. Chem. 17 (1967) 241–245.
[116] L. Greenspan, Humidity fixed points of binary saturated aqueous solutions, J. Res. Natl. Bur. Stand. Sect. A Phys. Chem. 81A (1977) 89–96. doi:10.6028/jres.081A.011.
Appendix 1: Extended RIR method
It was shown that when a sample is exposed to monochromatic X-rays, the intensity of the diffracted X-rays depends on the composition [110]:
(5) 𝐼𝑖= 𝐾𝑖
𝑥𝑖
𝜌𝑖𝜇𝑚
with:
𝐼𝑖 is the intensity of the diffracted X-rays by a selected plane (hkl) of the compound 𝑖 𝐾𝑖 constant that depends on compound and diffractometer𝑖
𝑥𝑖 weight fraction of compound in the exposed sample 𝑖 𝜌𝑖 density of compound 𝑖
𝜇𝑚 mass absorption coefficient of the exposed sample.
Considering the carbonated area as a homogeneous zone (the mass absorption coefficient 𝜇𝑚 is assumed to be uniform), the mean value of the weight fraction of compound in the 𝑥𝑖 𝑖
carbonated zone is then given by:
(6) 𝑥𝑖= 1 𝑉𝑐∫𝑥𝑖𝑑𝑣 = 1 𝑉𝑐∫𝜇𝑚 𝜌𝑖 𝐾𝑖𝐼𝑖𝑑𝑣 = 𝜇𝑚 𝜌𝑖 𝑉𝑐𝐾𝑖∫𝐼𝑖𝑑𝑣
where is the volume of the carbonated zone. 𝑉𝑐
Let us consider the case of the pure compound (𝑖 𝑥0𝑖= 1), the diffracted intensity is given by (𝐼0𝑖 is the mass absorption coefficient of the pure compound ):
𝜇𝑖 𝑖 (7) 𝐼0𝑖= 𝐾𝑖 𝑥0 𝑖 𝜌𝑖𝜇𝑖= 𝐾𝑖 𝜌𝑖𝜇𝑖
(8) 𝑥𝑖= 1 𝑉𝑐𝐼0𝑖
(
𝜇𝑚 𝜇𝑖)
∫𝐼𝑖𝑑𝑣Let us now assume the presence of an internal reference (of known concentration ) in the 𝑓 𝑥𝑓 carbonated zone that would be used to evaluate the fraction of the other compounds (flushing agent) [57]: (9) 𝑥𝑓= 1 𝑉𝑐𝐼0𝑓
(
𝜇𝑚 𝜇𝑓)
∫𝐼𝑓𝑑𝑣The weight fraction of the compound in the carbonated zone is then: 𝑖
(10) 𝑥𝑖= 𝑥𝑓 𝜇𝑓 𝜇𝑖
(
𝐼0 𝑓 𝐼0 𝑖)
∫𝐼𝑖𝑑𝑣 ∫𝐼𝑓𝑑𝑣When corundum is used as a flushing agent, it was shown [57] that:
(11) 𝜇𝑓 𝜇𝑖
(
𝐼0 𝑓 𝐼0 𝑖)
= 1 𝑘𝑖where is the reference intensity ratio (RIR) of the compound [111]. This value is available in 𝑘𝑖 𝑖 the powder diffraction file (PDF) of the International Centre for Diffraction Data1 (ICDD).
(12) 𝑥𝑖= 𝑥𝑓
(
1 𝑘𝑖)
∫𝐼𝑖𝑑𝑣 ∫𝐼𝑓𝑑𝑣In the absence of corundum in the sample, any other compound may be used as internal reference: calcite ( ) was chosen here since it is the main product of carbonation. Eq. (12) then 𝑐 becomes [58]: (13) 𝑥𝑖 𝑥𝑐=
(
𝑘𝑐 𝑘𝑖)
∫𝐼𝑖𝑑𝑣 ∫𝐼𝑐𝑑𝑣 1http://www.icdd.com/List of figures 0.0 0.5 1.0 1.5 2.0 2.5 3.0 3.5 0 10 20 30 40 50 60 70 R at io k (T ) / k( 20 °C ) Temperature (°C) 0.0 1.0 2.0 3.0 4.0 5.0 6.0 0 10 20 30 40 50 60 70 He (2010) Papadakis et al. (1991) Loo et al. (1994) Matsuzawa et al. (2010) Mori et al. (1972) Jae-Dong et al. (1990) Li et al. (2013)
Figure 1: Impact of temperature on carbonation: compilation of literature results
0% 4% 8% 12% 16% 20% 0 20 40 60 80 100 120 A bs or be d CO 2 (% m as s) Temperature (°C)
Input CO2 Dry air
Acquisition & Data control
Specimens T, RH T, RH CO2analyzer and CO 2 regulator Climatic chamber CO2(100%)
Gaz cooler system
Thermohygrometers Output gaz
Return analysed gaz Input CO2 Dry air
Acquisition & Data control
Specimens T, RH T, RH CO2analyzer and CO 2 regulator Climatic chamber CO2(100%)
Gaz cooler system
Thermohygrometers Output gaz
Return analysed gaz
19 20 21 22 23 24 25 26 20 30 40 50 60 70 80 90 0 1 2 3 4 5 6 T em pe ra tu re (° C) R H a nd C O2 co nt en t ( % ) Time (days) PCO2= 50.3% ± 0.7% RH = 70.0% ± 0.6% T = 20.0 ± 0.1°C
Figure 4: Temperature, RH and CO2 content during a preliminary test conducted at 20°C, 70%
RH and 50% CO2. The first reported number represents the average for each measurement,
whereas the second represents the standard deviation.
5 10 15 20 25 30 35 40 45 50 55 60 In te ns it y (a .u .) 2θ K-Cu (°) CEM V/A CEM I p p p e C4AF e e e e C-S-H C-S-H q p p p e AFm e m q C2S C2S p p p e e e m AFm p p p AFm e,m e e m q C-S-H C-S-H
Figure 5: Diffractograms of the non-carbonated pastes after curing at 20°C (AFm =
monosulfoaluminate; C2S = dicalcium silicate; C4AF = calcium aluminoferrite; C-S-H = calcium
PI (C EM I ) 0% 4% 8% 12% 16% 20% 24% 28% 0% 20% 40% 60% 80% 100% W at er c on te nt ( by m as s) RH 20°C 50°C 80°C PV ( CEM V /A ) 0% 4% 8% 12% 16% 20% 24% 28% 0% 20% 40% 60% 80% 100% W at er c on te nt ( by m as s) RH 20°C 50°C 80°C
Figure 6: Desorption isotherm of the hardened pastes as a function of temperature (the solid lines are provided as guidelines only) [31]
0 1 2 3 4 5 6 7 0% 25% 50% 75% 100% Po rt la nd it e co nt en t ( m ol /L o f p as te ) RH CEM I CEM V/A
PI (C EM I ) - 80 °C & 65% R H 0 5 10 15 20 25 30 XR D p ea k in te ns it y (a .u .)
Depth from exposed surface (mm)
Aragonite Calcite Vaterite Portlandite Carbonated zone Carbonated depth (9.0 mm) PV ( CEM V /A ) - 8 0° C & 51 % RH 0 5 10 15 20 25 30 XR D p ea k in te ns it y (a .u .)
Depth from exposed surface (mm)
Aragonite Calcite Vaterite Portlandite Carbonated zone Carbonated depth (14.9 mm)
0 2 4 6 8 10 12 0 10 20 30 Co nc en tr at io n (m ol /L o f p as te )
Depth from exposed surface (mm) Portlandite Calcium carbonate
Figure 9: Portlandite and calcium carbonate contents profile of the CEM I paste (80°C and 65% RH, obtained using TGA) to be compared to Figure 8
PI (C EM I ) - 80 °C & 65% R H -2.0 -1.8 -1.6 -1.4 -1.2 -1.0 -0.8 -0.6 -0.4 -0.2 0.0 0 200 400 600 800 1000 D T G ( m g/ m in ) Temperature (°C) Noncarbonated Carbo (10 mm) Carbo (6 mm) Carbo (3 mm) C-S-H AFt/AFm (…) PV ( CEM V /A ) - 8 0° C & 51 % RH -1.4 -1.2 -1.0 -0.8 -0.6 -0.4 -0.2 0.0 0 200 400 600 800 1000 D T G ( m g/ m in ) Temperature (°C) Noncarbonated Carbo (16 mm) Carbo (8 mm) Carbo (6 mm) Carbo (2 mm) C-S-H, AFt/AFm (…) katoite
CEM I CEM V/A 80 °C 0.0 0.5 1.0 1.5 2.0 2.5 3.0 3.5 4.0 0% 25% 50% 75% 100% RH Aragonite Vaterite 0.0 5.0 10.0 15.0 20.0 25.0 30.0 35.0 0% 25% 50% 75% 100% RH Aragonite Vaterite 50 °C 0.0 0.5 1.0 1.5 2.0 2.5 3.0 3.5 4.0 0% 25% 50% 75% 100% RH Aragonite Vaterite 0.0 0.5 1.0 1.5 2.0 2.5 3.0 3.5 4.0 0% 25% 50% 75% 100% RH Aragonite Vaterite 20 °C 0.0 0.5 1.0 1.5 2.0 2.5 3.0 3.5 4.0 0% 25% 50% 75% 100% RH Aragonite Vaterite 0.0 0.5 1.0 1.5 2.0 2.5 3.0 3.5 4.0 0% 25% 50% 75% 100% RH Aragonite Vaterite
Figure 11: Polymorphic abundance of calcium carbonate assessed using XRD and the RIR method: ratio
(
𝑥𝑖 𝑥𝑐)
as a function of temperature and RH0 5 10 15 20 25 0% 25% 50% 75% 100% Ca rb on at io n de pt h (m m ) RH CEM I - 80°C CEM I - 50°C CEM I - 20°C 0 5 10 15 20 25 0% 25% 50% 75% 100% Ca rb on at io n de pt h (m m ) RH CEM V - 80°C CEM V - 50°C CEM V - 20°C
CEM I paste CEM V/A paste
Figure 12: Carbonation depth versus RH
0 5 10 15 20 0 5 10 15 20 Ca rb on at io n de pt h (X R D ) [m m ]
Carbonation depth (phenolphtalein) [mm]
Line of equality Best fit
80°C – 26% RH 80°C – 51% RH 80°C – 65% RH 80°C – 76% RH
CEM I
Uncarbonated zone
Uncarbonated
zone Uncarbonatedzone Uncarbonatedzone
CEM V/A Uncarbonated zone Uncarbonated zone Uncarbonated zone Uncarbonated zone
Figure 14: Cracking in the carbonated zone at 80°C: the pink line indicates the frontier between the non-carbonated and carbonated zones whereas the yellow lines represent the cracks
0 4 8 12 16 20 0 20 40 60 80 100 M ax im al c ar bo na tio n de pt h (m m ) Temperature (°C) CEM I CEM V/A 0 1 2 3 4 5 0 20 40 60 80 100 R at io k (T ) / k( 20 °C ) Temperature (°C) CEM V/A CEM I
(a) Maximal carbonation depth (this study) (b) Comparison with literature results
List of tables
Table 1: Composition of the pastes
Compound CEM I CEM V/A Unit
OPC 1396 759 g/L Limestone filler - - g/L Slag - 298 g/L Fly ash - 298 g/L Silica fume - - g/L Water 558 542 g/L
Table 2: Composition (in mmol/L) and pH of the interstitial and curing solutions (at the beginning and of the cure)
CEM I CEM V/A
Na+ K+ Ca2+ pH Na+ K+ Ca2+ pH
Inner solution 47 452 2 13.7 87 533 2 13.7
Curing solution - beginning of cure 49 439 2 13.6 90 518 4 13.7 Curing solution - end of cure 54 455 3 13.6 85 474 2 13.7
Table 3: RH generated as a function of temperature [112–116] Temperature Desiccant/saturated salt solutions
20 °C 50 °C 80 °C
Lithium chloride LiCl - - 11%
Magnesium chloride MgCl2 33% 31% 26%
Magnesium nitrate Mg(NO3)2 54% -
-Sodium bromide NaBr - 51% 51%
Urea CO(NH2)2 - 62%
-Ammonium nitrate NH4NO3 63% -
-Potassium iodide KI 70% - 61%
Sodium nitrate NaNO3 - - 65%
Sodium chloride NaCl - 74% 76%
Ammonium sulphate (NH4)2SO4 - -
-Ammonium chloride NH4Cl 80% -
-Potassium chloride KCl - -
-Potassium nitrate KNO3 - 85%
-Sodium carbonate Na2CO3 - - 85%
Potassium sulfate K2SO4 - - 95%
Table 4: Inter-reticular distance and RIR ratio
Calcite Aragonite Vaterite
d(h,k,l) 3.04 Å 3.40 Å 3.57 Å
Table 5: Properties of the non-carbonated pastes [31]
Properties CEM I CEM V/A Unit
Saturated density dsat 2.04 1.93 g/cm3
Porosity (80°C) 37.2% 38.9%
-C-S-H content 5.1 7.0 mol/L of paste
Portlandite content 5.8 2.1 mol/L of paste
Specific surface area 190 297 m2/g
Permeability to water 2.0×10⁻²² 0.7×10⁻²² m2
Table 6: Mineralogy of the non-carbonated zone
Paste Temp Detected phases in the non-carbonated zone (XRD) 20°C C-S-H + portlandite + ettringite + C2S + C4AF
50°C C-S-H + portlandite + ettringite + C2S + C4AF
PI (CEM I)
80°C C-S-H + portlandite + C2S + C4AF
20°C C-S-H + portlandite + ettringite + monosulfoaluminate + mullite + quartz + C
2S + C4AF
50°C C-S-H + portlandite + ettringite + monosulfoaluminate + katoite + mullite + quartz + C
2S + C4AF
PV (CEM V/A)
80°C C-S-H + portlandite + katoite + mullite + quartz + C2S + C4AF
Table 7: Mineralogy of the carbonated zone
Paste Temp Detected phases in the carbonated zone (XRD)
20°C Calcite + aragonite + vaterite + portlandite + ettringite + C2S + C4AF
50°C Calcite + aragonite + vaterite + portlandite + C2S + C4AF
PI (CEM I)
80°C Calcite + aragonite + vaterite + portlandite + C2S + C4AF
20°C Calcite + aragonite + vaterite + portlandite + monocarboaluminate + ettringite + mullite + quartz + C
2S + C4AF
50°C Calcite + aragonite + vaterite + portlandite +katoite + mullite + quartz + C
2S + C4AF
PV (CEM V/A)
80°C Calcite + aragonite + vaterite + portlandite +katoite + mullite + quartz + C


![Figure 6: Desorption isotherm of the hardened pastes as a function of temperature (the solid lines are provided as guidelines only) [31]](https://thumb-eu.123doks.com/thumbv2/123doknet/12678698.354243/28.892.189.709.129.774/figure-desorption-isotherm-hardened-function-temperature-provided-guidelines.webp)