Conceptual Aircraft Design for Environmental Impact:
Modeling Operations for Emissions Assessment
by
Daniel J. King
B.S., University of Maryland, College Park (2002)
Submitted to the Department of Aeronautics and Astronautics
in partial fulfillment of the requirements for the degree of
Master of Science in Aeronautics and Astronautics
at the
MASSACHUSETTS INSTITUTE OF TECHNOLOGY
September 2005
@ Massachusetts Institute of Technology 2005. All rights reserved.
Author ...
pDepart nt of Aeronautics and Astronautics
June 16, 2005
Certified by...
Accepted by...
OF TECHNOLOGYDEC
L
1 2005
Karen Willcox
Assistant Professor of Aeronautics and Astronautics
Thesis Supervisor
4Y -Jaime
Peraire
Professor of Aeronautics and Astronautics
Chair, Department Committee on Graduate Students
Conceptual Aircraft Design for Environmental Impact: Modeling
Operations for Emissions Assessment
by
Daniel J. King
Submitted to the Department of Aeronautics and Astronautics on June 16, 2005, in partial fulfillment of the
requirements for the degree of
Master of Science in Aeronautics and Astronautics
Abstract
Decisions that guide technology investment and policy-making for the future of air trans-portation will be based in part on the tradeoffs between environmental performance and economics. The Environmental Design Space (EDS) project explores the tradeoffs between noise, emissions, and economics for conceptual design of future aircraft. A key component to EDS is modeling the emissions of aircraft in operation. Traditional design tools need more detailed mission analysis to calculate operational emissions in the landing and takeoff cycle (LTO), and in cruise. This thesis presents a methodology for modeling an aircraft flight profile and the corresponding aircraft and engine states required to calculate emissions over that mission.
The methodology was implemented as an operations model in EDS. The development of the methodology and demonstrations of the model are presented in this thesis. The model takes user-input flight procedures, including mission range, and uses aerodynamic models and engine models from EDS to calculate flight profiles. The operations model can be used for analyzing the relationships between flight procedures, and emissions and fuel burn for a fixed design. Alternatively, multidisciplinary design optimization (MDO) with EDS and the operations model can be used to optimize the aircraft design for minimized emissions in the flight profile. MDO with the new model enables exploration of a design space that includes operations along with design in evaluating tradeoffs between emissions, noise, and economics.
In addition to the development and demonstration of the operations model, a detailed study of the effects of derated-thrust takeoffs on emissions and fuel burn for Boeing 777 flights is presented in this thesis. The emissions of airline flights are calculated from flight data and compared to International Civil Aviation Organization (ICAO) assumptions for the engines used. The results show that NO emissions are significantly less than the ICAO assumed values for takeoff and climb-out. A second analysis compares the emissions of derated thrust takeoffs to the emissions that would have resulted if the same aircraft had flown with full-power on the same day. The results show a relationship between percent derate and a change in the emissions produced in takeoff, and a tradeoff of increased fuel burn for a decrease in NO: production.
Thesis Supervisor: Karen Willcox
Acknowledgments
I would not have been able to complete this thesis without the help and support of serveral
people. First of all, I am indebted to my adivisor, Professor Karen Willcox, who guided me through this research. Professor Ian Waitz worked with me and guided me in the derated takeoff thrust analysis that turned into a major contribution to the thesis.
I would also like to thank Garrett Barter, my lab-mate in the Aerospace Computational Design Lab and friend. From NEPP to Linux and Latex, Garrett was always happy to answer questions and help out when asked.
Finally, I owe the world and more to Caroline, my fiancee, who has put up with me traveling halfway around the world, then going away to Massachusetts for two years, and is going to marry me anyway.
This research was made possible through NASA Glenn Research Center, grant no. NAG3-2897.
Contents
1 Introduction 15
1.1 M otivation . . .. .. .. ... .. . . .. . . .. .. . . .. . . . . 15
1.2 Background ... ... 19
1.2.1 The Environmental Design Space . . . . 19
1.3 Thesis Objectives . . . . 20
1.4 Previous Work . . . . 21
1.5 Organization of Thesis . . . . 23
2 Description of EDS Framework 25 2.1 Introduction . . . . 25
2.2 Optimization Methods and Caffe . . . . 25
2.3 PASS and the Order of Operations in EDS . . . . 28
2.4 Engine Performance -NEPP . . . . 34
2.5 Noise - ANOPP . . . . 35
2.6 Computational Costs . . . . 35
3 Operations Model Development 39 3.1 Introduction . . . . 39
3.2 Mission Segment Definitions . . . . 40
3.2.1 User Inputs . . . . 40
3.3 Order of Profile Calculations . . . . 43
3.4 D escent . . . . 43
3.5 C ruise . . . . 46
3.5.1 Subsegment Range Calculations . . . . 47
3.6 C lim b . . . . 50
3.7 Takeoff and Taxi . . . . 51
3.8 Emissions Calculations . . . . 52
3.8.1 Boeing Method 2 . . . . 54
3.9 Engine Calculations . . . . 55
3.9.1 TSFC Assumptions in the Operations Module . . . . 56
3.10 D rag . . . . 60
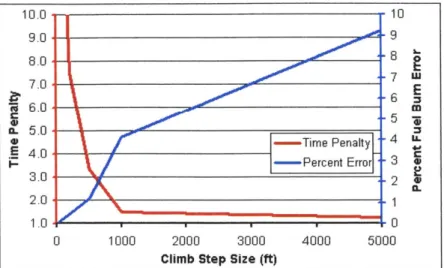
3.11 Choice of Subsegment Step Size . . . . 60
3.12 Constraints . . . . 62
4 Operations Model Demonstrations 65 4.1 Operational Model Emissions Calculations for a Baseline Aircraft and Mission 66 4.2 Demonstration of Operational Analysis of Current Aircraft . . . . 68
4.2.1 Comparison of Cruise Climb, Step Cruise, and Flat Cruise . . . . 68
4.2.2 Study of Effects of Cruise Altitude . . . . 69
4.2.3 Study of the Effects of Mission Range . . . . 72
4.2.4 CDA Compared to a Standard Approach . . . . 75
4.3 Design Optimization with Operations . . . . 78
4.3.1 Optimization Setup . . . .. . . 79
4.3.2 Optimization Results . . . . 82
5 Evaluation of Effect of Derated Thrust Takeoffs on LTO Emissions 91 5.1 Introduction . . . .. . 91
5.2 ICAO Emissions Calculations . . . . 92
5.2.1 Boeing Method 2 Emissions . . . . 93
5.2.2 BADA Models . . . . 93
5.3 Flight Data Analyzed . . . . 94
5.4 ICAO Comparison Analysis Approach . . . . 96
5.5 ICAO Comparison Results . . . . 96
5.6 Derate-Power Versus Full-Power Analysis . . . . 99
5.6.1 Profile Calculation . . . . 100
5.7 Results of Derate-Power Versus Full-Power Analysis . . . . 104
5.8 Effects of Modeling Errors . . . . 107
5.9 Derate Emissions With the Operations Model . . . . 110
5.10 Sum m ary . . . . 112
6 Conclusions and Future Work 115 6.1 Conclusions . . . . 115
List of Figures
1-1 Radiative forcing from aircraft with uncertainty bounds (taken from [30]). 17
1-2 Emissions is second only to noise in a survey of the most serious future issue
at the 50 largest U.S. airports (taken from [15]). . . . . 18
1-3 EPA estimates of 1990 and 2010 traffic and aircraft-source emissions (taken from [17]). . . . . 19
1-4 A possible architecture for aviation environmental policy analysis. . . . . . 20
2-1 Design modules and optimizer interface structure with Caffe in EDS. Modi-fied from [5]. . . . . 26
2-2 Visualization of a Simplex optimization path (Taken from [9]). . . . . 29
2-3 Times calculated for major components of EDS without the operations model or ANOPP... ... 36
3-1 Cruise and descent of an aircraft flying the default procedures defined in Table 3.1. . . . . 42
3-2 Takeoff Weight Calculation . . . . 43
3-3 Descent Free Body Diagram . . . . 44
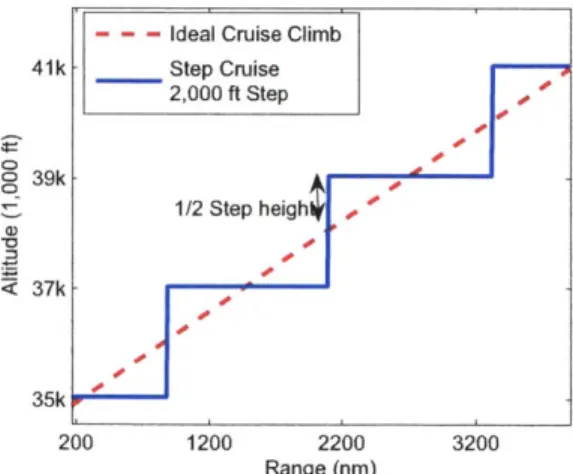
3-4 Step cruise with a 2,000 foot step plotted with a cruise climb for the same flight. Steps are taken when the optimal altitude is 1/2 of the step size from the current altitude. . . . . 49
3-5 Climbing flight. . . . . 50
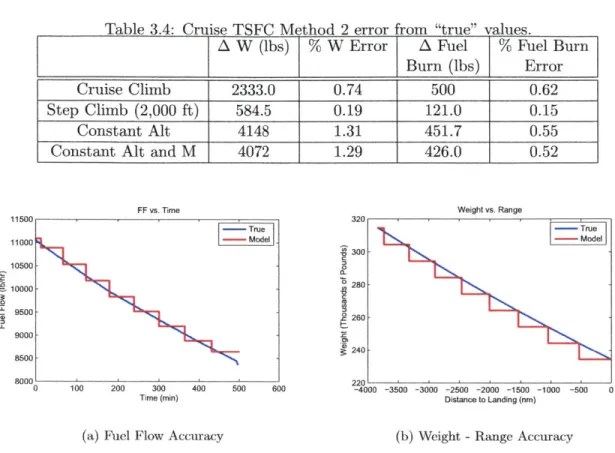
3-6 Accuracy of cruise TSFC assumptions in operations model using TSFC Method 2 in a cruise climb of the baseline aircraft. . . . . 58
3-7 Accuracy of descent TSFC assumptions in operations model using descent TSFC Method 3 on a baseline aircraft flying a standard approach profile. . 59 3-8 Accuracy and computational time tradeoff vs. step size for climb . . . . 61
3-9 Accuracy vs. Number of Segments for Cruise . . . . 61
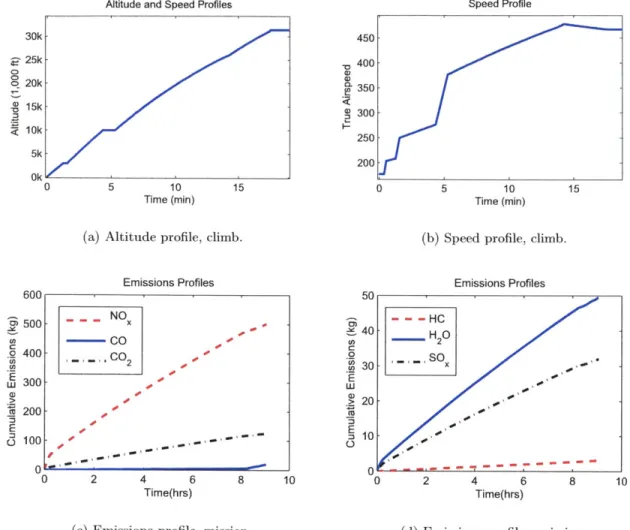
4-1 Emissions and flight profiles for the baseline airplane on a 4,000 nm range using default operational procedures. CO2 and H20 are shown in units of metric tons (1,000 kg). . . . . 67
4-2 Cruise Flight Profiles for Different Methods . . . . 70
4-3 Fuel Flow in Cruise for Different Methods . . . . 71
4-4 Fuel burn and emissions results for cruise altitude study. . . . . 72
4-5 Fuel burn and emissions for varying mission range relative to max range mission 74 4-6 Fuel burn and emissions per ASM versus mission range for the EDS aircraft, plotted with the fuel burn results for a 747-400 reported in [30]. . . . . 74
4-8 NO. cumulative emissions in descent for a CDA and a standard approach . 77
4-9 Design space exploration around the minimum design fuel point with varying
thrust and MTOW. . . . . 88
4-10 LTO climb and descent flight profiles and fuel flow for the Case 5 design, optimized for descent LTO CO2, and the Case 6 design, optimized for climb LTO CO2 . . . . . . .. . . .. . . 89
5-1 Comparison of derate distribution for sample flights and 777 flights from the airports. . . . . 95
5-2 ICAO LTO cycle and ICAO takeoff and climb-out NOx versus actual takeoff and climb-out emissions for 33 derated thrust takeoffs . . . . 97
5-3 ICAO LTO cycle and ICAO takeoff and climb-out CO versus actual takeoff and climb-out emissions for derated thrust takeoffs. . . . . 98
5-4 ICAO LTO cycle and ICAO takeoff and climb-out HC versus actual takeoff and climb-out emissions for derated thrust takeoffs. . . . . 99
5-5 Climbing Flight . . . . 102
5-6 Fuel Burn Prediction Error Compared to Flight Data . . . . 104
5-7 Fuel Burn Prediction Compared to Flight Data . . . . 105
5-8 NOx Reduction vs. Percent Derate . . . . 106
5-9 Fuel Burn Increase vs. Percent Derate . . . . 107
5-10 Derated and full-power CO and HC emissions, which are negligible for takeoff and climb-out relative to approach and taxi. . . . . 108
5-11 True airspeed and altitude profiles for the full-power and derated thrust ver-sions of each flight . . . . 108
5-12 Change in NOx Curve with Drag Model Error . . . . 109
List of Tables
2.1 Sample of design variables, parameters, constraints and objectives that are
available in EDS. . . . . 27
2.2 Time comparison of engine runs for 10 constant throttle points at once, ten varying throttle points at once, and ten points in 10 separate NEPP calls . 37 3.1 Mission Segment Definitions . . . . 41
3.2 Required inputs for emissions models. . . . . 53
3.3 Cruise TSFC Method 1 error from "true" values. . . . . 57
3.4 Cruise TSFC Method 2 error from "true" values. . . . . 58
3.5 Error for descent TSFC methods. . . . . 59
4.1 Cumulative emissions and fuel burn results for the entire mission, cruise only, and LTO only for the baseline airplane on a 4,000 nm range mission. ... 68
4.2 Results of Cruise Methods Relative to Cruise Climb . . . . 69
4.3 Emissions and fuel burn for varying cruise altitude, M=0.8, range = 4,000 nm. 71 4.4 LTO Emissions and Fuel Burn . . . . 76
4.5 Optimization variables and upper and lower bounds . . . . 80
4.6 Optimization variables and upper and lower bounds . . . . 82
4.7 Optimization results for design fuel and mission fuel objectives. . . . . 84
4.8 Optimization results for operational CO2 objectives. . . . . 86
5.1 ICAO LTO cycle. . . . . 92
5.2 Trent 892 ICAO certification data. . . . . 93
5.3 Flights Analyzed . . . . 95
5.4 Summary of Results, Averages for All Derate-Thrust Flights . . . . 105
Nomenclature
AGL Above ground level
ANOPP Aircraft Noide Prediction Program
AP Approach
AR Aspect ratio
ASM Available seat-miles
ATC Air traffic control
BADA Base of Aircraft Data
BM2 Boeing Method 2
CD Drag coefficient
CL Lift coefficient
C/O Climb-out
CAEP Committee on Aviation Environmental Protection
Caffe Collaborative Application Framework for Engineering
CAS Calibrated airspeed
CDA Continuous Descent Approach
CFDR Computer flight data recorder
CG Center of gravity
CO Carbon monoxide
CO2 Carbon dioxide
CPR Compressor pressure ratio
EAS Equivalent airspeed
EDS Environmental Design Space
El Emissions index
FAR Federal Aviation Regulations
FPR Fan pressure ratio
GA Genetic algorithm
GAO Government Accountability Office
GE General Electric
GTOW Gross takeoff weight
H20 Gaseous water
HC Unburned hydrocarbons
ICAO International Civil Aviation Organization
ILS Instrument landing system
INM Integrated Noise Model
IPCC Intergovernmental Panel on Climate Change
L/D lift-to-drag ratio
LGW London Gatwick Airport
LHR London Heathrow Airport
LTO Landing takeoff cycle
MDO Multidisciplinary Design Optimization
MTOW Maximum takeoff weight
NEPP NASA Engine Performance Program
NOx 03 OEI OPR PASS ROC ROD RVSM SAGE
SLS
SOx t/c TAS TOFL TOW TSFC TX UEET VC Altitude x/L XML"Y
Nitrous oxides OzoneOne engine inoperative Overall pressure ratio
Program for Aircraft Synthesis Studies Rate of climb
Rate of descent
Reduced vertical separation minimums
System for Assessing Aviation's Global Emissions Static Sea-Level
Sulfur oxides
Thickness-to-chord ratio True airspeed
Takeoff field length
Takeoff Weight
Thrust specific fuel consumption Taxi
Ultra Efficient Engine Technology Program Structural design altitude
Distance from nose a fraction of fuselage length Extensible Markup Language
Chapter 1
Introduction
1.1
Motivation
Continual growth in air travel increases the importance of the environmental effects of aviation. Long term growth in air travel is projected to be 3.6% per year by one estimate
[15], while other estimates project even higher growth. Aircraft have historically made
continuous and marked improvements in noise, fuel burn, and emissions, but the trend of increasing air travel threatens to worsen the total effects of aviation on the environment. With improvements in pollution from automobiles and industrial sources causing a net reduction in environmental impacts from those sources, the relative effects of aviation will increase causing aviation and the environment to become a more important issue to the public and to law-makers.
As aircraft are optimized for environmental and economic objectives it is important to understand the tradeoffs and what is sacrificed to meet those objectives. Today's aircraft are 70% more fuel efficient than 50 years ago [30]. Noise has decreased by 20 decibels since the beginning of the jet age [16]. "Aircraft and engine designs have reached the point where reduction of environmental impact and improvements in operating economy are in conflict, which raises questions about the direction that designs should go [16]." The design advances that have driven the steady and impressive decreases in noise and fuel burn since the beginnings of commercial aviation have side affects of increasing NO-production. Landing takeoff cycle (LTO) NO. is estimated to have increased by almost
50% for next generation 737s compared to the previous generation [15]. While improved
combustor designs have helped to mitigate that effect, it demonstrates the importance of
the tradeoffs that must be understood for directing the future of aircraft technology and regulation.
Design improvements regarding emissions are aimed at meeting a certification standard. Certification standards are set with a metric based on emissions measurements at four representative LTO engine throttle settings. The impacts of emissions on people and the environment at local and global level depend on the emissions released by aircraft in prac-tice, which the metrics do not reflect. Variations in operations, which can include how the airplane is flown as well as such factors as atmospheric conditions, airport runway lengths, and takeoff weights can change the quantities of emissions produced significantly. Mod-els of the emissions produced by aircraft in operation are needed to understand the total emissions at a local and global level, and the variations in emissions due to variations in operations. Current certification standards provide consistent metrics for engine improve-ments but do not account for operational variations or airframe design and do not calculate global emissions. It is important for making future emissions regulation to understand the impact of emissions on the environment, today and in the future air transportation system. Operational emissions modeling is necessary to develop this understanding.
Increased fuel prices put additional pressures on aviation to save costs with operational measures. This may or may not have a positive affect on the environment. More fuel efficient flight will reduce emissions proportionally in cruise, but may increase NOx in takeoff (see Chapter 5 for a fuel flow - NOx tradeoff in takeoff). The fuel crisis has driven one airline to fly its return fuel from Texas to Mexico because the cheaper fuel in Texas saves money despite increased fuel needed for that flight [4]. The airline saves $112 per trip, but the environmental cost is increased. Airline operations are primarily driven by economics. The environmental impact of operational choices is usually not considered.
Aircraft impact the environment at a local and global level. Emissions contribute to global warming and depletion of the ozone layer. The FAA reports that aviation comprises
2.7% of the national inventory of greenhouse gases [2]. In 1992, aircraft contributed 3.5% of
the radiative forcing due to anthropogenic sources, a measure that represents contribution to warming. By 2050, the absolute radiative forcing of aircraft is expected to grow 2.6 to 11 times, depending on the market demand scenario, and will represent 3.4% to 15% of anthropogenic forcing [30]. Primary causes of global warming by aircraft include C0 2,
contrail formation and cirrus cloud formation, are very large and the total impact is difficult to ascertain.
Radiative Forcing from Aircraft in 2050 Radiative Forcing from Aircraft in 1992 05 b)
010 a) 0.4 0.08
I:
0.3 50.06 0I. us 0.04 02~0.02
0.2i rec Diret0.CH4 S-Ma.e CHct D9
CO2 O H20 Cmira CITrU I Direct Total 4fa
-0.02 Clouds Soot (without 0
-
0 C s92clouds) Clouds Soot (witbotm
-0.04 jds) c01
-0.06 from NO 02 fm NO
good fair poor poor fair very fair fair Poor
good poor poor por fair e fair fair
(a) 1992 radiative forcing. (b) Projected 2050 radiative forcing.
Figure 1-1: Radiative forcing from aircraft with uncertainty bounds (taken from [30]).
Emissions impact human health and the ecosystem on a local level, especially near airports. While noise has historically been the most significant environmental issue that airplane operators and airports have faced, emissions are becoming more and more impor-tant. A 2000 GAO study surveyed the 50 largest U.S. airports and reported that 6 airports currently (in 2000) consider air quality to be their most important issue and 16 airports expect it to be the most important issue in the future (Figure 1-2).
Local emissions, or LTO cycle emissions, are emissions released below the mixing height. Mixing height is the altitude below which emissions will remain near the ground and affect local pollution. Emissions above the mixing height do not affect local air quality. Mixing heights vary throughout the year, and throughout the day. Summer afternoon mixing height can range 3,000 to 7,200 ft [17]. Mean annual mixing height is 1,000 to 2600 feet for major
U.S. metropolitan regions listed in [17]. 3,000 feet is used as an assumption in many studies,
including this one.
Aviation makes up 0.4 % of the national inventory of NO. emissions, with considerable variability in local contributions to areas around airports [2]. NO, is the aircraft emission of primary concern for local environmental impacts. NO, creates ozone and smog which have
Figure 1-2: Emissions is second only to noise in a survey of the most serious future issue at the 50 largest U.S. airports (taken from [15]).
adverse affects on health. NO. and the ozone it produces can cause impaired lung function, lung damage, increased hospitalizations, and premature mortality [17]. Smog and ozone are responsible for air quality warning days that are common on the East Coast in summer. Other effects of aircraft emissions include contribution to acid rain and interference with plant growth [17]. The 1990 and 2010 recorded and projected aircraft departures at major
U.S. airports are shown in Figure 1-3a. NO, emissions from aircraft as a percentage of each
region's transportation based NO, is shown in Figure 1-3b.
Concern over emissions has led airports in Switzerland, Sweden, and the U.K. to cre-ate emissions charges similar to the more common noise charge. London's Heathrow and Gatwick airports began charging for emissions in 2004 and 2005 respectively, with a third airport (Stansted) scheduled to begin charging in 2006. Swiss and Swedish airports have been charging for emissions for several years. This growing trend in emissions charges mo-tivates the study of the operational effects of emissions in takeoff and landing (LTO). A study of derated thrust takeoffs at Heathrow and Gatwick is presented in Chapter 5 of this thesis.
The Swiss and British airports with emissions charges use International Civil Aviation Organization (ICAO) emissions certification data to set the charges to encourage airlines
Noise Water 12 Quality H Air Quality 16 Land use None Applicable 00 Wetlands 2
[ Most serIous problem currently
] Most serious problem In the future
*. Uta
--Los~ - -
-C 0% 22 40%
Fi_2 -i
I 11I
Pore nto Total
Figure 24. 1996 and 2010 LT14
LTOs
(a) Aircraft contribution to regional NO. from
all mobile sources in 1990 and projected for 2010.
Figure 1-3: EPA estimates of 1990 and 2010
from [17]).
(b) Number of LTO cycles by aircraft in
metropolitan regions in 1990 and projected for
2010.
traffic and aircraft-source emissions (taken
to fly lower emissions aircraft into those airports. Heathrow and Gatwick baseline landing charges include noise and emissions charges and are based on 24 kilograms of NO, for the LTO cycle. Landing charges are increased or reduced if the ICAO calculated LTO NO is above or below 24 kg [3]. ICAO data is based on static engine tests and assumptions of aircraft LTO cycle times and throttle settings. ICAO assumptions do not take into account operational considerations that may significantly reduce emissions such as airport conditions, runway lengths, aircraft weights, and actual throttle settings and flight segment times.
1.2
Background
1.2.1 The Environmental Design Space
This research is part of the Environmental Design Space (EDS) project. The purpose of
EDS is to explore the tradeoffs in noise, emissions, technology, and economics in future
aircraft designs. EDS generates future designs using multidisciplinary design optimization (MDO) and estimates of future technology and industry capability. MDO allows EDS to evaluate what will be possible in aircraft designs of the future. Rather than creating individual designs, the primary goal of EDS is to evaluate the tradeoffs of environmental impacts and economics between many future possible aircraft designs. A key to evaluating
Fiau*4-1. II"*jnd2 0AircrdCmpoanlo
environmental impacts is calculating the emissions produced in flight, globally and locally. This research develops a methodology that enables calculation of the flight emissions, or operational emissions, necessary for EDS.
EDS fits into a larger policy-making framework and will become part of a tool set to
evaluate the macroscopic effects of aviation policy and technology choices. Figure 1-4 shows how EDS fits into the framework. EDS optimizes for aircraft designs according to different objectives. A future market, policy, and technology scenario can be translated into EDS objectives, and a range of possible outputs is produced. EDS outputs in terms of noise, emissions, and costs are then evaluated for local and global effects to show policymakers a range of possible outputs for their given future scenario.
Pi Marke Range of possible
Forecast/
Tecinology
scenarios
leet
Objectives and er-ssions
ti and noise constraints aEDS
Optimization Loop do I
emissions evaluation, identify the challenges and benefits of doing so, and implement the methodology in EDS. A secondary objective was to study the impact of using reduced or derated thrust in takeoff on emissions and fuel burn using airline data. A detailed list of objectives for this thesis is as follows:
Research Objectives
" Calculating on and off-design aircraft performance and emissions of an airplane
defined in a conceptual design tool.
" Distinguishing the change in emissions due to a change in operating procedures.
" Producing results that can be used as an objective in an airplane design opti-mization.
2. Implementing the methodology in an operations model in EDS and demonstrating operational emissions analysis of varying flight procedures and detailed emissions cal-culations of an aircraft representative of a current aircraft.
3. Demonstration of optimization of an EDS airplane on an objective calculated by the
operations model.
4. Calculation of the takeoff and climb-out emissions of aircraft using airline flight data and analysis of the emissions and fuel burn trend with derated thrust usage.
1.4
Previous Work
Multidisciplinary design optimization is well suited for aircraft design in which there are many competing objectives and discipline-specific analyses. Aerodynamic objectives often conflict with structural requirements and requirements for stability and control. A change in the design covered by one discipline will often have repercussions in other disciplines. Early work in multidisciplinary design optimization of aircraft packaged complex aircraft synthesis tools as black boxes and combined them with optimization tools. The next gen-eration of MDO tools introduced greater modularity, parallel processing, and have been designed to reduce problem set-up time for engineers. The third generation of MDO in-volves distributed design where the design optimization is split into disciplines that perform optimizations concurrently [221. The two major challenges of MDO for the future are reduc-ing organizational complexity and increasreduc-ing computational power [34]. Distributed design using collaborative optimization is one approach to the complexity problem and has been developed over the years by Kroo, among others [24]. Response surfaces and other approxi-mation methods reduce computational expense by simplifying the model, and may be used with collaborative optimization as shown in [33]. Recent state-of-the-art MDO applications have included optimization of advanced concepts such as the Blended-Wing-Body [36] with
well-developed disciplinary analyses, but have focused on traditional design performance objectives without attention to environmental factors. Work in EDS is focused on bringing environmental analysis to the aircraft MDO problem.
Previous studies using EDS have explored the relationship between aircraft design and tradeoffs in emissions, noise, and fuel burn. Barter [9] used MDO to find the Pareto front between a minimum noise and minimum NOx designed aircraft. The results showed a tradeoff between noise and emissions of with an increase in NOx for noise reduction. A Pareto front is the set of the best designs for two or more objectives. For each design on the Pareto front, there is no better feasible design for an objective that does not decrease at least one of the other objective [37]. A Pareto front shows the optimal relationship
between objectives in an optimization, and is useful for evaluating tradeoffs in aircraft design. Antoine [7][5] showed several Pareto fronts between cost, noise, emissions, and fuel burn, and shows a side-by-side comparison of the best aircraft for each objective. The minimum LTO NOx aircraft is characterized by a lower turbine inlet temperature (Tt4), a
lower pressure ratio, and less thrust. Lower thrust drives a large wing area to meet climb gradient constraints, and the large wing produces a fuel penalty in cruise where the excess wing area is unnecessary.
EDS has previously assumed fixed times-in-mode to consider regulatory emissions rather
than operational emissions. Emissions were calculated for engine test-stand conditions, rather than actual flight conditions, to determine the values of ICAO emissions metrics. The operations module calculates operational emissions and captures the coupling between design and operations. Variations in time-in-mode may affect the optimal design.
The NASA Ultra Efficient Engine Technology (UEET) program also evaluated future designs for emissions performance [11]. UEET showed a 13% reduction in mission fuel burn for a large airplane by optimizing the airframe only based on 2010 technology; the engines were based on current technology. The addition of an ultra-efficient engine increased that savings to 31%. Fuel efficiency was achieved in the engines using high overall pressure ratio (OPR) which results in higher NO production for a given engine. The UEET aircraft had lower NO. production compared to today's aircraft using advanced technology in the combustor. The study noted the need to evaluate fuel efficiency, NO2, OPR tradeoffs and also suggested that lower OPRs may be desired to reduce emissions.
and asked design oriented questions about future designs regarding the environment [16]. Key questions include: What is the effect of aircraft design range on the environmental impact of aviation? How does the design cruise altitude affect the net impacts of aircraft on the environment? What should engine overall pressure ratios be to minimize climate change effects of aircraft? EDS can be used to investigate these questions. The overall pressure ratio question relates to the tradeoff between low fuel burn and low NO. in engine design. The altitude question addresses the tradeoff between reduced environmental effects of emissions at lower cruise altitudes and higher quantities of fuel and emissions. The design range question relates to the debate over the future of the air transportation system between a hub-and-spoke system with shorter flight segments and more connections for passengers, and a point-to-point systems with non-stop flights for passengers and longer flight segments. The design range question addresses the environmental efficiency of aircraft designed for each system and the overall environmental effects of each system.
Typical commercial airplane cruise altitudes are between 30,000 and 40,000 feet, which maximizes fuel efficiency. Lowering cruise altitude could reduce contrail formation and the impact of other aircraft emissions on the environment, even while the net quantity of emissions released may increase. Previous studies have explored the impact of lowering cruise altitude on fuel burn, emissions, and cost, for current aircraft and re-designed aircraft redesigned for lower altitudes. Antoine [7] used EDS tools to evaluate the changes in cost, fuel, and emissions when commercial airplanes are re-designed for a 28,000 and 24,000 foot cruise altitude. The re-designed aircraft resulted in a 4% and 7% increase in operating costs for the two cases respectively. A study by Boeing on the effects of lowering the cruising altitudes of currently flying aircraft showed fuel burn and CO2 penalties of up to 20% for 777, 747, and 737 airplanes [14].
1.5
Organization of Thesis
This thesis presents the development and demonstration of a methodology for calculating in-flight emissions of commercial aircraft in a conceptual design framework. The methodology was implemented in an operations model in EDS.
Chapter 2 presents a detailed description of the design framework, EDS, which includes an aircraft design tool, an engine simulator, a noise model, optimization methods and a
program integration tool. An evaluation of computational time of the program is presented. In Chapter 3 the development of the operations model is discussed and the model is described in detail. Thrust specific fuel consumption (TSFC) assumptions and integration step sizes are evaluated for accuracy. The operations model defines a mission in 22 segments over the flight with varying calculation methods and operating variables. A key aspect of the operations model is that it requires new operational constraints in the aircraft design problem that are unlike traditional design constraints.
In Chapter 4, the capabilities of the operations model are presented. The operations model allows detailed calculation of emissions and fuel burn over the course of the flight. Changes in fuel burn and emissions due to varying flight procedures can be evaluated for a current or future aircraft defined in EDS. Analyses of mission range, cruise altitude, and the continuous descent approach are presented. The model is able to capture the variation in results to show the relationship between procedures and emissions and fuel. Mission range and off-design performance are critical for EDS applications. Optimizations presented in Chapter 4 demonstrate the use of operations model results as objectives in an EDS MDO problem. Optimizations of the airplane design for mission fuel and CO2 are presented. Optimizations for CO2 demonstrate the tradeoffs that can be evaluated by optimizing for separate parts of the mission including cruise, climb, and descent.
In Chapter 5, a study is presented of the emissions and fuel impact of using derated takeoff thrust rather than full-power. The study was conducted using flight data of derated thrust flights and simulations of full-power flights based on the data. Emissions estimates of the flights in the data are computed and compared to estimates derived using methods embodied in regulatory standards. The study shows the benefit in NOx for actual operations at two London airports where emissions-based fees have recently been implemented. The derated thrust comparison to full-power thrust is also analyzed with the operations model to show the model's utility for such analyses.
Finally, in Chapter 6, the thesis is summarized, and conclusions are presented. Future work in EDS and with the operations model is discussed.
Chapter 2
Description of EDS Framework
2.1
Introduction
This chapter is a review of the components of the aircraft design framework, EDS. The major components of EDS will be discussed including the Program for Aircraft Synthe-sis Studies (PASS), the NASA Engine Performance Program (NEPP), the Aircraft Noise Prediction Program (ANOPP), optimization algorithms, and the Collaborative Application Framework for Engineering (Caffe) database and optimization management wrapper. Be-cause computational time is important for evaluating the costs and benefits of any additions or modifications to EDS, computational costs of EDS components are also presented in this chapter.
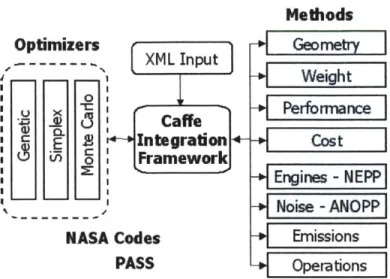
Figure 2-1 shows the structure of EDS as implemented in this thesis. Caffe is the central framework that manages optimization, performs data handling, and allows individual design tools to be linked. User input is entered through an XML file that is used to define the aircraft design, variables, objective, and constraints, and select the optimizer if optimization is to be used. The program can also be run without optimization to evaluate a specific design, or a design flying on a specified mission.
2.2
Optimization Methods and Caffe
The foundation of the framework is Caffe. Caffe is a software integration package specif-ically designed to be used for design applications. Caffe uses Java and XML for platform independence, which also allows convenient integration into web-based applications. Caffe
Methods
Optimizers
Geomt
--- XML Input .2 +|=Perfomace
Caffe
Integration
Cost
z
0
Framework
+Engines-NEPPNASA Codes
PASSOperons
Figure 2-1: Design modules and optimizer interface structure with Caffe in EDS. Modified from [5].
manages program modules and optimization, and provides data management
[6].
A keyfea-ture of Caffe is that it allows convenient integration of new programs or analysis modules without redesigning the existing package and does not require source code.
Data management in Caffe is handled with in-memory storage and storage in XML files. An XML file is used as the input and output file for EDS. Caffe reads the inputs and writes the outputs to and from in-memory storage that is used to communicate between program modules. As an example, the descent method need to calculate drag in various conditions. To calculate drag, the descent method puts the lift coefficient, Mach number, and flap setting, calls the drag model, then gets the resulting drag coefficient.
Optimization methods minimize or maximize objective functions given a set of variables and subject to some set of constraints. The standard optimization problem definition is as
follows [371:
Minimize J(x, p)
Subject to gj (x, p) 0
j=1,...,mi
hx, P) =0 k 1, M2
where there is an objective function J, mi inequality constraints 9j, m2 equality constraints
hk, and a vector of variables x with upper and lower bounds (xy and x1) for each variable.
Parameters, p, are fixed values required in addition to the variables to define the conceptual design. For n design variables, there is an n-dimensional design space, bounded by n sets of variable bounds, that defines all possible combinations of variables. Regions of the design space where designs violate constraints are said to be infeasible regions of the design space. Each point in the feasible design space defines a unique design. It very quickly becomes impossible to analyze each design in the design space as the number of variables increase. Optimization algorithms efficiently search the design space to find the best design while satisfying all the constraints. In EDS, the group of methods that evaluate a design are treated as a black box for optimization. Inputs are design variable and outputs are constraints, objectives, and other calculated results not involved in the optimization. An example list of variables, constraints, objectives, and parameters for an EDS problem is shown in Table 2.1
Table 2.1: Sample of design variables, parameters, constraints and objectives that are available in EDS.
Design Variables Constraints
Max Takeoff Weight Cruise Range
Wing Area Climb 2 Gradient
Wing Aspect Ratio Static Margin
Wing Sweep CL Wing, Cruise
Thickness:chord CL Tail, Cruise
Wing X-Position CL Tail, Takeoff
Horizontal Tail Area CL Tail, Landing
Initial Cruise Altitude Fuel Capacity Final Cruise Altitude Takeoff Field Length Sea Level Static Thrust Landing Field Length
Bypass Ratio Cruise Drag/Thrust
Overall Pressure Ratio Wing Span
Turbine Inlet Temp Approach Mach No.
Initial Cruise Mach Cumulative EPNL
Final Cruise Mach LTO NO2
Parameters Objectives
No. Passengers Direct Operating Cost
Number of Engines Max Range Fuel Burn
Max Takeoff Weight
Several optimization methods are available in Caffe including gradient-based methods and heuristic algorithms. Genetic algorithms (GA) and Nelder-Meade Simplex have been used in previous EDS studies [9] [7] [6] [5]. Monte Carlo analysis is also available
allow-ing uncertainty analysis within EDS. Simplex is used for the optimization demonstrations presented in this thesis.
Simplex begins from a starting point design, rather than a random sample, and follows a path to find a better design. In each iteration, simplex compares n+1 designs for an n-dimensional design space and moves away from the direction of the worst design for the next iteration. The algorithm controls the spacing of the points evaluated, expanding or contracting the search area. The version of Simplex implemented in EDS determines the goodness of a design first by cumulative percentage of constraint violations and second by the value of the objective [9]. In this manner, unconstrained space is sought before the objective will be considered. Simplex does not rely on gradients which makes it well suited to highly nonlinear or disjointed functions and useful in EDS.
Figure 2-2 shows a visualization of the simplex algorithm in operation for a design with two variables and is borrowed from [9]. The objective is represented by the contour lines, showing a minimum in the center of the contours, and the axes show the value of the design variables. The labeled vertices of each triangle represent design point evaluations of the objective. Beginning from the initial design, point 1, simplex moves the design variables to find two more designs forming a triangle. With an n-dimensional design space, simplex would find an n + 1 dimensional polyhedron. With the initial triangle made of points 1, 2, and 3, simplex evaluates the three designs. Point 1 is the worst design, so point 1 is flipped to the opposite side, point 4, with the other two points fixed. Point 4 is found to be better than point 2 and worse than point 3, so point 2 is flipped for the second iteration to point 5. The algorithm progresses by moving to the point opposite the worst point in each triangle until it reaches point 16, the minimum. At the minimum, simplex moves away from each worst point until it finds that is has circled one point. The algorithm will resize the triangles around point 16 to search a smaller area and zero in on the local minimum
[91.
2.3
PASS and the Order of Operations in EDS
This section will discuss the methods from the Program for Aircraft Synthesis Studies
(PASS) used in EDS in the order they are employed. Airframe design and analysis in EDS
is handled by PASS [21]. PASS is an aircraft conceptual design tool that was created at Stanford and is based McDonnell-Douglas methods, Air Force DATCOM correlations, and
XI
18
1 "
4
X 2
Figure 2-2: Visualization of a Simplex optimization path (Taken from [9]).
additional methods created at Stanford [6]. PASS takes as input a conceptual level aircraft design and calculates design performance, weights, geometry, costs, and constraints using individual modules or methods for various computations. The collection of individual anal-ysis modules that form PASS contribute to making PASS and the rest of EDS extensible, allowing convenient integration of additional functions such as the operations module devel-oped for this research. PASS is also useful as an educational tool and is used in a graduate aircraft design course taught at Stanford. An online version of PASS can be used on the course web site for AA241 Aircraft Design: Synthesis and Analysis [23]. This section will attempt to summarize the modules in PASS while only going into enough detail to convey the scope and level of detail modeled, without a full explanation of each module. Where methods require a large number of inputs and outputs, a representative list of inputs and outputs will be mentioned to give an idea of the scope and detail of the method. The course web site for AA241 includes much greater detail on many of the methods used in PASS,
and Antoine discusses the particular version of EDS used here in great detail [23] [7].
Geometry
Airframe geometry is the first module in PASS. Fuselage geometry is calculated from the number of passengers, seat pitch, number of seats abreast, nose fineness ratio, and a number
of other similar inputs. Fuselage geometry outputs include the length, width, and height of the fuselage along with more detailed results. Wing and tail geometries are calculated next
including chord lengths, span, wing heights, the positions of leading and trailing edges. The engine geometry is calculated next and requires a short call to the engine program, NEPP
(described below), to get flow conditions at the fan. Flow conditions are used to calculate fan diameter, engine length, and a number of other results.
Weight
Weight is calculated next. The weight calculation is critical because it determines the design range. The weight calculation is a detailed component weight buildup based on corre-lations to aircraft data. Inputs include the calculated geometries, maximum takeoff weight (MTOW) specified in the input file, structural loads, and a number of other inputs. Detailed component weights that are calculated include weights for the electronics, passengers, flight attendants, fuselage, wing, and many other detailed weights. Aircraft weights calculated include the maximum zero-fuel weight, payload weight, operational empty weight, and the weights at climb, cruise, and landing. Component weights are a function of the calculated zero-fuel weight, and so iteration is required to converge on the correct weight. Fuel weight is calculated as the remaining weight between MTOW and the zero fuel weight plus reserve fuel. Initial cruise weight is calculated by subtracting a climb penalty from MTOW. The penalty is a constant times the cruise altitude times MTOW (1% to 2% of MTOW for 30,000 to 40,000 feet). Final cruise weight is the zero fuel weight plus reserve and maneuver fuel. Maneuver fuel is estimated as 0.35% of MTOW. Initial and final cruise weights determine the fuel available for cruise, and thus determine the design maximum cruise range.
Cruise weights are critical because they determine the range of the design.
Center of Gravity and Approach for ANOPP
After weights are calculated, center of gravity (C.G.) is found and the gear position is set. The drag method is called (for one of many calls) to get the lift to drag (L/D) ratio for approach. The approach calculation uses the input value of approach gradient and L/D to estimate the approach throttle setting for NEPP and ANOPP. The result is only an es-timate for noise calculations and is not an accurate method of calculating the flight profile or engine state suitable for emissions calculations.
Engine Calculations
NEPP is used for engine calculations in EDS. The main NEPP call is the next step and
includes engine calculations for PASS, ANOPP, and PASS emissions. For PASS calculations the engine is set to cruise throttle, defined in the input file, and run at Mach numbers and altitudes for initial cruise, final cruise, takeoff, and climb. For emissions, the engine is run at sea level and zero Mach for four throttle settings: 100%, 85%, 30%, and 7%. No other flight conditions are run so a detailed flight and emissions profile is not possible.
Range
Range is calculated next based on the initial and final cruise weights calculated in the weight module, and thrust specific fuel consumption (TSFC) for initial and final cruise points. Cruise Mach number is set in the input file, as are the initial and final cruise altitudes. Cruise is calculated in a single segment using a trapezoidal approximation to the integration of the Breguet Range Equation (Equation 2.1), where R is range, V is true airspeed, 1 is the lift-to-drag ratio, and W is weight. Range is calculated by integrating from the initial to the final cruise weight of the aircraft. Cruise range is an output of the analysis rather than an input as might be expected for an aircraft design. An aircraft is designed for an design range by setting cruise range as an objective or a constraint and optimizing the aircraft. Cruise range is a result of the weight analysis, which determine the initial and final cruise weights, and of the MTOW specified in the inputs.
R =L dW (2.1)
(TSFC) D I W
NEPP cruise calculations do not produce accurate engine state data required for
emis-sions calculations. The NEPP run for cruise was calculated at the cruise throttle setting specified in the input file and is only used to get TSFC for the range equation. TSFC will be accurate for the range calculation as long as the estimated cruise throttle setting is realistic. Because cruise throttle is not based on cruise drag, the engine state computed
by NEPP, specifically the internal station temperatures and pressures, do not represent the
actual state flown in cruise and are not accurate for emissions.
Takeoff field length (TOFL) and second segment climb gradient (climb 2) are calculated next. TOFL is calculated according to Federal Aviation Regulations (FAR) part 25, and is a constraint check rather that an accurate calculation of takeoff roll suitable for operational performance. The climb 2 gradient requirement is a minimum climb angle with one engine inoperative (OEI). Tail CL is also checked at this point for the tail stall margin on takeoff constraint, to ensure that the tail is able to rotate the airplane for liftoff.
Landing field length and stability are the next modules in PASS. Landing field length is based on a simple correlation: Field Length (ft) = 750 + 0.4 x V'ti, where V,azl is the
stall speed. Landing field length is also a constraint check of FAR 25 requirements and the calculation does not otherwise contribute to the performance of the aircraft. Static margin is checked at this point to ensure stability. Geometry and center of gravity are used for the calculation, which is based on U.S. Air Force DATCOM methods for stability coefficient estimation [1].
PASS Regulatory Emissions
PASS emissions are calculated next using assumptions based on International Civil
Aviation Organization (ICAO) assumptions for regulatory landing-takeoff (LTO) emissions.
ICAO assumptions, also discussed in Section 5.2, calculate LTO emissions by assuming that
the engines are run at four throttle settings for four times-in-mode in the LTO cycle for taxi (TX), takeoff (TO), climb-out (C/O), and approach (AP). The four throttle settings
- 100%, 85%, 30%, and 7% - were run in NEPP previously. Time-in-mode is fixed for all aircraft and does not vary with aircraft-engine design changes or operating procedures.
PASS only calculates NO. and CO2. The equations for LTO emissions is:
LTONOX = EINOx,m X fffm X tm (2.2)
m=TO,C/O,AP,TX
where EI is the emissions index calculated for each throttle setting, t is the time-in-mode for each segment, and
f f is the fuel flow calculated by NEPP for each segment. The emissions
index for CO2 is assumed constant for any engine and is set to 3.15 kg of CO2 per kg of fuel. PASS uses a T3-P3 model to to calculate EI for NOx in grams of NOx per kg of fuel in the form of [7]:3 0.37 -1471
EINO = 0.004194 T4 e 345 (2.3)
k439)
where T4 is the temperature at the combustor exit, T3 is the temperature at the combustor entrance, and P3 is the pressure at the combustor entrance. The T3-P3 model captures regulatory sea level static emissions changes with design changes for a fixed combustor. This model was created in EDS by Antoine [71 as taken from Lukachko and Waitz [26]. The model represents a next generation subsonic engine for a medium-range, 275 passen-ger commercial transport with a start date in 2005 [26], which is inline with the 767-sized aircraft used throughout this thesis. This suggests that the model is reasonable for a next-generation 767 - i.e. a Boeing 787. However, the model is limited as design changes to the combustor will not be captured which points to the need for a better emissions model that takes into account combustor design. Because emissions in PASS consider time-in-mode to be fixed, LTO emissions changes and absolute quantities are not captured. Design changes will vary the time required to climb to or descend from 3,000 feet. As the derated thrust takeoff study shows in Chapter 5, variation in thrust can have a significant impact on the time to climb. The operations model will address this limitation.
Drag
Methods for drag, maximum lift coefficient (CLmax), and stall speed are used several times throughout the PASS run. Drag is extensively used in the operations model; stall speed and CLmax are also used. The PASS drag method is a very detailed drag buildup that is composed of parasite drag, lift-induced drag, and compressibility drag. Drag coefficient for a given design (CD) is a function of Mach number, total CL, true airspeed, altitude, and flap setting.
Parasite drag includes skin friction drag, pressure drag, and interference drag. Inputs for the calculation include airframe and engine geometry details for the fuselage, wing, empenage, and engines. The calculation for skin friction drag is based on the fully-turbulent Karman formula with Mach = 0.5. Mach number effects on skin friction and a form factor
that accounts for increased surface velocities due to curvature are included in the calculation. Drag is calculated separately for the wings, tail, nacelles, control surface gaps, and engine pylons. A friction drag mark-up factor accounts for surface roughness due to rivets, small
gaps such as in landing gear doors, and also includes interference and trim drag effects. The mark-up is based on flight tests [7].
Induced drag calculates the drag due to lift on the wing and tail including drag due to wing-tail interference and added drag due to the change in lift distribution on the wing from the fuselage. Wing and tail geometry including vertical positions of each are inputs as well as total and wing and tail CLs. A trim calculation must be performed by a PASS trim method prior to the induced drag calculation to get wing and tail CLs. The trim calculation requires flap deflection to account for the moment due to flaps. The induced drag calculation assumes that wings axe geometrically similar to today's airplanes [7].
Compressibility drag can be calculated for supersonic or subsonic Mach numbers. The subsonic calculation is a function of geometry, CL, and Mach number. Crest critical Mach number (Mcc) is estimated and CDc is calculated based on correlations to data for the ratio of flight mach number to Mc. Sweep is accounted for. Supercritical airfoils are modeled with in increase in Mc. Data correlations limit the accuracy of the CDC calculation to flight where the effective CL, perpendicular to the swept wing, is less than 1.2 when Mach is greater than 0.4. A run failure constraint is flagged in the design program if this occurs. In the operations model, violations are allowed, but a warning is output.
2.4
Engine Performance
-
NEPP
An engine model is necessary for accurate flight and emissions performance calculations. Detailed engine state data is required for calculating emissions. NEPP, the NASA Engine Performance Program, is used for engine analysis in EDS. Future versions of EDS will improve by replacing NEPP with NPSS, another NASA engine tool. NEPP is a one-dimensional steady thermodynamic engine cycle analysis tool that can analyze most aircraft engine types include commercial airplane turbofans [9]. NEPP can perform design and
off-design analysis and has an integral optimizer for engine off-design. NEPP inputs include SLS thrust, BPR, pressure ratios, T4, and component efficiencies. Off-design analysis, which is heavily used in the operations model, uses component performance tables and minimizes work, flow, and energy errors [20]. NEPP controls in EDS are designed for throttle, thrust or EPR targets controlled by varying T4 to achieve the target value. Off-design performance can be calculated throughout the flight profile by varying Mach number and altitude.
Barter [91 used Monte Carlo analysis to evaluate NEPP accuracy in EDS. Barter evalu-ated NEPP TSFC output distributions for several engines with normal distributions applied
to 19 variables. Engines analyzed were the GE90-90B, the CFM56-5A1, and the PW4056.
Variables include fan, compressor, and turbine operating points, pressure ratio, and effi-ciencies. Other variables were throttle setting and air bleed. The distributions of input variables were set based on a standard deviation for a 95% confidence interval. Assuming the input distributions and means were correct, the general result is a 95% confidence that the result will be within
+/-
15% for off-design TSFC in cruise and takeoff for the engines analyzed. Error is greater when the distributions are varied, and results may not apply outside the engines or technology levels analyzed.2.5
Noise
-
ANOPP
ANOPP is a NASA legacy tool for noise prediction that is available for use in EDS. ANOPP
was not used in this thesis because integration of ANOPP with a detailed flight profile was outside the scope of this research. The design of the operations model allows it to be integrated with ANOPP in the future. This will allow detail operational tradeoffs between noise and emissions to be evaluated for varying operational flight profiles.
2.6
Computational Costs
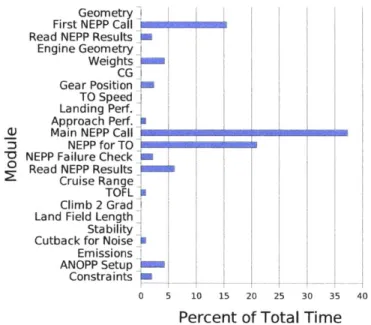
Minimizing computational time is critical to optimization problems. Any additions or mod-ifications to the code that adds what looks like an insignificant amount of computational time to a single function call, may cripple the program when run in an optimization. It is important, therefore, to understand how much time major components take in each func-tion call and be able to evaluate the cost-benefit of an operafunc-tions model. Timing runs also made it clear that NEPP is the most expensive component of EDS (without ANOPP) which formed some guidance for the development of the operations model.
EDS without ANOPP was used for the test. A single run, or function call of EDS
(with eveything but ANOPP) takes approximately 2,000 nanoseconds on a 2.8 GHz Intel& Pentium@ 4 CPU with 512 MB of RAM. The same computer was used for all evaluations in this section. By comparing all other times and changes in time to this baseline value, the results can be normalized for varying computing resources. Figure 2-3 below shows the
![Figure 1-1: Radiative forcing from aircraft with uncertainty bounds (taken from [30]).](https://thumb-eu.123doks.com/thumbv2/123doknet/14448564.518202/17.918.136.768.182.504/figure-radiative-forcing-aircraft-uncertainty-bounds-taken.webp)