HAL Id: hal-03198929
https://hal.archives-ouvertes.fr/hal-03198929
Submitted on 15 Apr 2021
HAL is a multi-disciplinary open access
archive for the deposit and dissemination of
sci-entific research documents, whether they are
pub-lished or not. The documents may come from
teaching and research institutions in France or
abroad, or from public or private research centers.
L’archive ouverte pluridisciplinaire HAL, est
destinée au dépôt et à la diffusion de documents
scientifiques de niveau recherche, publiés ou non,
émanant des établissements d’enseignement et de
recherche français ou étrangers, des laboratoires
publics ou privés.
Study of the densification and grain growth mechanisms
occurring during spark plasma sintering of different
submicronic yttria-stabilized zirconia powders
Andréas Flaureau, Alicia Weibel, Geoffroy Chevallier, Claude Estournès
To cite this version:
Andréas Flaureau, Alicia Weibel, Geoffroy Chevallier, Claude Estournès. Study of the densification
and grain growth mechanisms occurring during spark plasma sintering of different submicronic
yttria-stabilized zirconia powders. Journal of the European Ceramic Society, Elsevier, 2021, 41 (6),
pp.3581-3594. �10.1016/j.jeurceramsoc.2021.01.032�. �hal-03198929�
OATAO is an open access repository that collects the work of Toulouse
researchers and makes it freely available over the web where possible
Any correspondence concerning this service should be sent
to the repository administrator:
tech-oatao@listes-diff.inp-toulouse.fr
This is an author’s version published in:
https://oatao.univ-toulouse.fr/27699
To cite this version:
Flaureau, Andréas and Weibel, Alicia and Chevallier, Geoffroy and
Estournès, Claude Study of the densification and grain growth
mechanisms occurring during spark plasma sintering of different
submicronic yttria-stabilized zirconia powders. (In Press: 2021)
Journal of the European Ceramic Society, 41 (6). 3581-3594. ISSN
0955-2219
Open Archive Toulouse Archive Ouverte
Official URL :
Study of the densification and grain growth mechanisms occurring during
spark plasma sintering of different submicronic yttria-stabilized
zirconia powders
Andr´eas Flaureau
a, Alicia Weibel
a, Geoffroy Chevallier
a,b, Claude Estourn`es
a,*
aCIRIMAT, CNRS-INP-UPS, Universit´e Toulouse 3 – Paul Sabatier, 118 route de Narbonne, F-31062, Toulouse cedex 9, France
bPlateforme Nationale CNRS de Frittage Flash, PNF2, MHT, Universit´e Toulouse 3 - Paul Sabatier, 118 route de Narbonne, F-31062, Toulouse cedex 9, France
A R T I C L E I N F O Keywords:
Spark plasma sintering Yttria-stabilized zirconia
Relative density/grain size trajectory Densification and grain growth mechanisms
A B S T R A C T
Densification and grain growth mechanisms of Yttria-Stabilized Zirconia sintered by Spark Plasma Sintering are investigated. Sintering trajectories of four commercial submicronic powders with different average particle sizes and yttria amounts have been established and sintering regimes determined. Densification mechanisms are determined in the regime where densification is occurring without grain growth using a model derived from hot- pressing. Grain growth mechanisms are determined using the conventional power law in the regime where ce-ramics are fully densified. Densification occurs by grain boundary sliding accommodated by an in-series inter-face-reaction/lattice diffusion of cations or by an overlapping of surface diffusion and grain boundary sliding mechanisms for tetragonal stabilized zirconia and by dislocation climbing for fully stabilized zirconia. A normal grain growth occurs for each ceramic, all composed of a single phase, contrary to the two-phased ceramics obtained in literature where grain growth occurs by segregation at grain boundaries.
1. Introduction
Yttria-Stabilized-Zirconia (YSZ), one of the most industrially used ceramics, has many applications in the field of biomaterials (dental implant) [1], energy (fuel cells electrolyte) [2], aeronautics (thermal barrier) [3] and luxury industry (jewelry) [4]. Spark Plasma Sintering (SPS) is an advanced technique with a high potential for the processing of materials with tailored properties [5]. Recently, SPS has experienced a technological leap with the development of a methodology for developing materials with 3D complex shapes [6]. This considerable advance has been made possible by the development of reliable digital tool, in which densification and grain growth mechanisms have been implemented, to simulate the densification of a complex shape by SPS [7]. SPS of YSZ complex shapes would certainly lead to new applications as well as significant technological advances in the aforementioned fields of application. To be able to develop complex shapes, it is neces-sary to model the SPS sintering and therefore to determine the sintering mechanisms (densification and grain growth). Even if SPS is known for decades now, literature on densification and grain growth sintering mechanisms is scarce [8]. To the best of our knowledge, only three studies are conducted on SPS mechanisms of YSZ: two on densification
mechanisms by Bernard-Granger et al. [9] and Langer et al. [10] and one on grain growth mechanisms by P. Dahl et al. [11].
The objective of the present work is to determine YSZ densification and grain growth mechanisms during SPS using different powders of various yttria amounts, crystallographic structures and particle sizes. The possible effects of the previous parameters on the SPS mechanisms is discussed.
2. Material and methods
2.1. Raw materials
In this paper, four commercial powders are studied, two zirconia powders stabilized with 3 mol. %. of yttria and two stabilized with 8 mol. % of yttria. The two powders from Tosoh company (Japan) stabi-lized with 3 mol. % and 8 mol. % yttria are denoted here after TZ-3Y and TZ-8Y, respectively. The two from the US-Nano company (USA) are denoted here after US-3Y and US-8Y.
* Corresponding author.
E-mail address: estournes@chimie.ups-tlse.fr (C. Estourn`es).
2.2. Sintering
Ceramics have been consolidated by SPS (SPS 632LX, Fuji Electronic Industrial CO., Japan) located at the Plateforme Nationale CNRS de Frittage Flash (Universit´e Toulouse III – Paul Sabatier). About 0.6 g of powder are loaded into an 8 mm inner-diameter graphite die. A graphitic foil (PERMA-FOIL®Toyo Tanso) is placed between punches and die and between die and powder to allow an easy removal after sintering. Before the thermal cycle, a pre-compaction step at 25 MPa during 2 min is systemically applied at room temperature in the SPS in order to guarantee the powder beds the same initial relative density (D) = of 35 %. Then, the samples are sintered in vacuum (residual cell pressure < 5 Pa). A direct current pulse pattern of 40 ms : 7 ms (pulse on : pulse off) is used and temperature is controlled by an optical pyrometer (with a 570 ◦C threshold temperature detection) focused on a hole at the
external surface of the die. A heating rate of 200 ◦C/min from room
temperature until 600 ◦C is used. During heating, a 100 MPa pressure is
gradually applied and maintained until the end of the full cycle. After a 7 min dwell at 600 ◦C in order to have a homogenous temperature in the
entire sample, a 100 ◦C/min heating rate is used until the chosen
tem-perature of sintering (from 700 ◦C to 1400 ◦C). The final temperature is
maintained from 3 to 30 min, depending of the study (sintering trajec-tory, densification mechanism or grain growth mechanism, specific parameters will be detailed before each part). The sintered specimens are in the form of pellets 8 mm in diameter and in the range of 2− 3 mm thick. Residual graphitic paper is removed either by polishing (for samples sintered under 900 ◦C) or by a thermal treatment in air at 800 ◦C
during 4 h (4 h heating and cooling). Some of the samples are reduced during sintering, as evidenced by the grey color of the corresponding pellets, so the thermal treatment has also the objective to reoxidize these samples.
2.3. Characterizations
Powders and the pellets are characterized by Raman Spectroscopy (633 nm laser, LabRAM 800 Jobin-Yvon, presented spectra averaged on three spectra). Selected samples are observed by field-emission-gun scanning electron microscopy (FESEM, JEOL JEM 7800 F) and/or by transmission electron microscopy (TEM, JEOL JEM 2100 F). A platinum coat (few nanometers thick) is applied in order to prevent charge accumulation on the surfaces during FESEM observations. For each powder, particle size distribution and average particle size are estimated from the measurement of several hundred particles. For sintered spec-imen, average grain size is determined from images of the fracture surfaces using the linear intercept method [12]. Two selected sintered sample are observed by TEM and one is further analyzed by X-ray energy dispersive spectroscopy (EDS). A thin foil of the corresponding samples is prepared by grinding with SiC paper followed by dimpling (GATAN 656) with a 1 μm diamond suspension and finally by cold ion milling at 4
kV (GATAN PIPS 691). Density is first estimated from the weight and dimensions of the pellets and also measured by the Archimedes’ method using a hydrostatic balance (Sartorius MSE22S-YDK03) only for samples presenting low porosity rate (relative density > 90 %). The relative density is calculated using theoretical densities of 5.817 g.cm−3 [13],
6.134 g.cm−3 [14] and 6.045 g.cm−3 [15] for pure monoclinic, 3YSZ (3
mol. % YSZ) tetragonal and 8YSZ (8 mol. % YSZ) cubic zirconia, respectively and corresponding volumetric phases proportions in each sample.
2.4. Sintering mechanisms determination 2.4.1. Densification mechanisms
Several models can be used for the determination of SPS densifica-tion mechanisms [16–18]. For the sake of comparison, we chose the one used by Bernard-Granger et al. [18] who also studied 3YSZ SPS densi-fication mechanisms. In this model, matter transport during sintering
with or without an external load can be considered as analogous to that occurring in high-temperature creep [19,20], and the Hot Pressing (HP) kinetic equation can be written in a simplified version [21] of the gen-eral relationship for steady-state creep strain [22]. Therefore, the equation (1) is considered: 1 D dD dt =BΦ μeffb kT ( b G )m( σeff μeff )n (1) With D is the instantaneous relative density, t is time, B is a constant, ϕ is the diffusion coefficient, μeff is the instantaneous shear modulus of the
powder bed, k is the Boltzmann’s constant, T is temperature, b is the Burgers vector, G is the grain size, σeff is the instantaneous effective
stress applied on the powder bed, and m & n the grain size and stress exponents, respectively. σeff can be described by (2) according to Helle
et al. [23] : σeff= 1 − D0 D2(D − D 0) σmac (2)
Where D0 is the starting green density (relative density at 600 ◦C: 45 %,
46 %, 47 % and 48 % for TZ-3Y, TZ-8Y, US-3Y and US-8Y respectively) and σmac is the macroscopic compaction pressure (100 MPa). Moreover,
μeff can be calculated with (3) defined by Lam et al. [24]:
μeff=
Eth
2(1 +νeff
)D − D0
1 − D0 (3)
Where Eth is the Young modulus and νeff the Poisson coefficient: 210 GPa
[25,26] and 0.31 [27] for zirconia. With this model, grains size and stress exponents cannot be determined simultaneously. Densification mechanism can be deducted from the stress exponent n that is deter-mined for a constant grain size, in the so-called densification regime where (1) transforms into (4):
1 μeff 1 D dD dt =K0 e−RTQd T ( σeff μeff )n (4) Where K0 is a constant, R is the gas constant and Qd is the activation
energy of the densification mechanism.
To determine n, (4) is transformed into its logarithmic form (Eq. (5)):
ln ( 1 μeff 1 D dD dt ) =n ln ( σeff μeff ) +K1 (5)
Where K1 is a constant and n is the slope when plotting ln
( 1 μeff 1DdDdt ) = f [ ln ( σeff μeff ) ]
Finally, the activation energy Qd of the densification mechanism can
be calculated by plotting (6): ln ( T μeff ( μeff σeff )n 1 D dD dt ) =f [ 1 T ] (6) The slope corresponding to − Qd
R.
Thus, for each powder, the couple n, Qd will be determined to
identify the densification mechanisms.
2.4.2. Grain growth mechanisms
During the final stage of sintering (closed porosity elimination), grain growth appears to be the main or even the only sintering mecha-nism whereas during the intermediate stage (open porosity elimination), it is coupled with densification. In order to determine the grain growth mechanism, it will be necessary to analyze the microstructural evolution of the samples during the final stage of sintering. On isothermal condi-tions, grain growth obeys to the normal law describe in Eq. (7) [28]:
Gm− Gm
0=kjt (7)
Where G is the instantaneous average grain size during the temperature dwell, G0 is the initial average grain size at the temperature dwell
beginning, m the grain size exponent depending on the grain growth mechanism, t is time and kj is a constant.
With the average grain size determined for each ceramic at different temperatures and dwell times, it is possible to use the normal law (Eq.
(7)) considering G0 the average grain size at the end of the heating step
and G the average grain size at the end of dwell time. Then, like Chaim
et al. [31,32] have shown for Y2O3, by plotting Gm− Gm0 with m = 2, 3, 4 (depending of the grain growth mechanism [28]) as a function of time, the grain growth mechanism occurring during final sintering stage is determined by the linear regression with the correlation coefficient closer to 1.
Here again, for each powder, the m exponent will be determined to identify the grain growth mechanisms.
3. Results and discussion
3.1. Characterization of commercial powders
Fig. 1 shows the Raman spectra obtained for the four powders. It appears that the powders TZ-3Y and US-3Y are both two-phased monoclinic and tetragonal even if they are presented as Tetragonal Zirconia Polycrystal (TZP). The powder TZ-8Y, presented as Fully Sta-bilized Zirconia (FSZ), is mono-phased cubic although the US-8Y powder is two-phased monoclinic and cubic.
The phase proportions for the two-phased powders is determined from Raman spectroscopy using the methodology developed by Kim
et al. [29]. It consists in measuring the intensity of three bands, two bands corresponding to the monoclinic phase at 192 cm−1 and 180 cm-1
and the third one at 148 cm−1 corresponding to the tetragonal or the
cubic phase. Then, using Eq. (8) and Eq. (9), xm and fm (respectively the
intensity ratio and the volume fraction) of monoclinic phase are deter-mined. The phase proportions in each commercial powder are summa-rized in Table 1. xm= Im(180 cm−1)+Im(192 cm−1) Im(180 cm−1)+Im(192 cm−1)+Iq/c(148 cm−1) (8) fm= ̅̅̅̅̅̅̅̅̅̅̅̅̅̅̅̅̅̅̅̅̅̅̅̅̅̅̅̅̅̅̅̅̅̅̅̅̅̅ 0, 19 − 0, 13 xm− 1, 01 √ − 0, 56 (9)
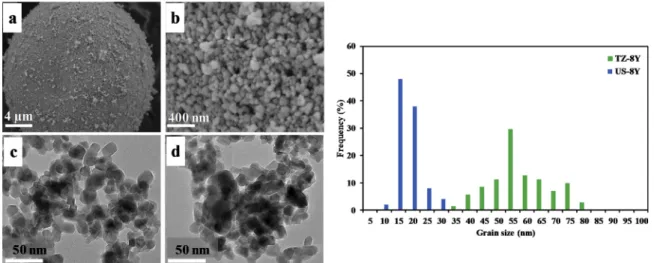
FESEM images, TEM images and particle size distribution of TZ-3Y and US-3Y powders are presented in Fig. 2 and of TZ-8Y and US-8Y powders are presented in Fig. 3. The powders TZ-3Y (Fig. 2 a) and b)) and TZ-8Y (Fig. 3 a) and b)) are constituted of granules themselves constituted of spherical submicronic particles. The powders US-3Y (Fig. 2 c, d) and US-8Y (Fig. 3 c, d) are constituted of micrometric ag-gregates themselves constituted of submicronic spherical particles. The powders have an average particle size around 20 nm and 50 nm for US- Nano and Tosoh powders, respectively. It is to be noticed that the dif-ference between d10 and d90 is larger for Tosoh powders than for the US-
Nano ones (Table 2), indicating that the particle size distribution is then larger in the case of Tosoh powders. The d10 and d90 are close to d50 for
all the powders, indicating a monomodal particle size distribution. The average particle sizes are very close to d50 values (Table 2), in agreement
with the tight particle size distribution. With phase proportions reported above and Eq. (10), it is then possible to calculate the densities of each powders, summarized in Table 2.
ρ=( 1 fm ρm+ ( 1 − fm ρt or c ) ) (10)
With ρm the monoclinic phase density and ρt or c the tetragonal or cubic
(in the case of monoclinic-cubic two phased zirconia) phase density.
3.2. Determination of the sintering trajectory
Determination of the sintering regimes requires the establishment of the sintering trajectory of each powder. To determine the ceramic relative density for each sintering temperature, the amount of each phase and their own density has to be considered.
The following experimental conditions are chosen: - Dwell temperature: 700− 1400 ◦C for each powders
- Dwell time: 3 min - Heating rate: 100 ◦C.min−1
- Macroscopic applied pressure: 100 MPa
Fig. 4 presents the Raman spectra of TZ-3Y after sintering at different temperatures, monoclinic phase can be clearly identified with the two bands around 180 cm−1 and 192 cm-1, those two bands disappear totally
at 1100 ◦C, temperature at which the monoclinic phase transforms into
tetragonal phase. Regarding the phase diagram [30], monoclinic phase should transforms into tetragonal phase at 1170 ◦C. This temperature
difference can be attributed to a lowering of the monoclinic to quadratic phase transformation temperature by the application of the 100 MPa Fig. 1. Raman spectra of the commercial powders TZ-3Y, US-3Y, TZ-8Y and
US-8Y with phase identification (m, t and c are used for monoclinic, tetragonal and cubic phase, respectively).
Table 1
Phase proportions (vol. %) in commercial powders.
Powders Phase proportions
TZ-3Y 23 % monoclinic / 77 % tetragonal
US-3Y 9% monoclinic / 91 % tetragonal
TZ-8Y 100 % cubic
pressure and/or the difference of temperature between the read one by the optical pyrometer and the real one in the sample which is higher (the optical pyrometer reading temperature at 3 mm of the tool surface and not the temperature at sample center). This latter can moreover be exacerbated by the increase of the ionic conductivity of yttria-stabilized zirconia with temperature [31].
It is possible that tetragonal and cubic phases coexist but due to the close lattice parameters of tetragonal (a0 =0.5094 nm and c0 =0.5177 nm) and cubic structure (a0 =0.5124), it is very difficult to discriminate one phase from the other by XRD. This difficulty has already been re-ported in literature by Mondal et al. [32] or Nitsche et al. [33] and needs, for example, an identification using a synchrotron x-radiation source that allows high resolution studies at small or high-angle regions because of its high beam intensity (Srinivasan et al. [34]). Fig. 4 shows that Raman spectra of TZ-3Y sintered during 3 min at 1100 ◦C and 1400
◦C respectively are similar. Moreover, TZ-3Y sintered at 1400 ◦C
spec-trum exhibits same bands than the tetragonal specspec-trum shown by Wulfman et al. [35]. We can also note (cf. Fig. 1) by comparing the Raman spectra of TZ-8Y, for which it is generally accepted that the cubic phase is the most stable [36], with those of TZ-3Y for which it is generally accepted that the tetragonal phase is the most stable in this temperature range that the bands observed are very close. Thus, it can be suggested that the cubic band present at 628 cm−1 could provoke a
shoulder on the tetragonal band profile at 637 cm−1 but as it seems not
be present in our spectrum, we suggest that there is no cubic phase formation after monoclinic phase transitioned into tetragonal phase until 1100 ◦C.
Fig. 5 shows the FESEM images of TZ-3Y powder (Fig. 5 a)) and TZ- 3Y samples sintered at different temperatures. It can be observed that up to 1000 ◦C, no grain growth occurs (Fig. 5 b–d), while at 1100 ◦C grain
growth starts (Fig. 5 e)) and at 1300 ◦C, the sample seems to reach full
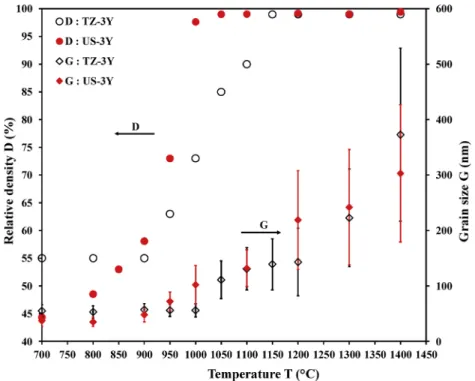
density combined with high grain growth phenomenon (Fig. 5 f)). Previous calculations and observations conducted on TZ-3Y are then made for each powder in order to plot the sintering trajectories. Those sintering trajectories are presented in Fig. 6 and Fig. 7. Fig. 6 evidences different sintering behaviors for TZ-3Y and US-3Y. For TZ-3Y, densifi-cation starts at 900 ◦C and finishes at 1150 ◦C when grain growth
beginning is initiated around 950 ◦C. For US-3Y, densification starts at a
lower temperature (between 700 ◦C and 800 ◦C) and finishes at 1050 ◦C
(100 ◦C earlier than TZ-3Y) when grain growth starts at 950 ◦C too. This
is a direct consequence of the initial powder particle size on the sintering Fig. 3. FESEM and TEM images and particle size distribution of a) and b) TZ-8Y); c) and d) US-8Y commercial powders.
Fig. 2. FESEM and TEM images and particle size distribution of a) and b) TZ-3Y; c) and d) US-3Y commercial powders.
Table 2
Commercial powders characteristics: Average particle size G and ρ, theoretical
density. Powders G (nm) d10 (nm) d50 (nm) d90 (nm) ρ (g. cm−3) TZ-3Y 47 ± 10 35 46 60 6.06 US-3Y 21 ± 6 16 20 28 6.05 TZ-8Y 51 ± 10 42 54 72 6.10 US-8Y 16 ± 4 11 15 21 6.02
ability which is higher for lower particle sizes [37].
The sintering behavior of TZ-8Y and US-8Y (Fig. 7) reveals that US- 8Y is fully densified 150 ◦C before TZ-8Y (1200 ◦C and 1050 ◦C for TZ-8Y
and US-8Y, respectively) while they both start to densify between 700 and 800 ◦C. Here again, this lower sintering temperature is a
conse-quence of the lower particle size of US-8Y powder (16 ± 4 nm) than TZ- 8Y powder (51 ± 10 nm). Grain growth starts at the same temperature for the two powders (1000 ◦C).
It can be noticed that grain growth in TZ-8Y and US-8Y samples is more important than in TZ-3Y and US-3Y samples (Fig. 6, Fig. 7). It is attributed by several groups [38–41] to a grain-boundary mobility in Y-TZP markedly lower due to Y3+segregation at the grain boundaries and a higher activation energy than in Y2O3-stabilized cubic stabilized
zirconia.
At this stage, it can be appropriate to specify that the US-Nano powders used (3Y and 8Y) present a very low amount of impurities, the highest being Cl with a content less than 0.03 wt. %, other impurities are present with a content lower than 50 ppm (suppliers data). For TZ- 3Y powder, Al2O3 is the main impurity and is present at 0.253 wt. %
(supplier value), other impurities are present with content less than 0.03 wt. %. Finally, for TZ-8Y powder, amounts of impurities are lower than 0.09 wt.%. With those amounts, it can be suggested that impurities do not have an impact on the sintering behavior of TZ-8Y, US-3Y and US-8Y powders.
Concerning TZ-3Y and its Al2O3 wt. % content which can be
considered high, we can refer to the study of Matsui et al. [42]. They studied, in four powders, the impact of TZ-3Y specific surface area (that can be related to the evolution of TZ-3Y average grain size) and Al2O3
content. They showed that for powders with a given particle size, the one with the higher amount of Al2O3 shows the higher densification rate
whereas for the same amount of Al2O3, the powder with the lower
specific surface area presents the lower densification rate.
In our study, as indicated previously, TZ-3Y powder presents a higher Al2O3 content than US-3Y powder but also higher particle size so no
conclusion on which parameter has more effect on densification rate can
be made.
For each powder, the sintering trajectory has been established and clear zones of pure densification without any grain growth (regime 1) and of grain growth without any densification (regime 2) have been defined. For all powders, sintering mechanisms can now be determined for each stage.
It has to be noticed that at regime 1), the samples obtained are totally white and they turn into grey color when sintered at higher temperature. This coloration has also been observed by Bernard-Granger et al. in their study and as they suggest, in accordance with the study of Munir et al. [43], zirconia turned into grey color due to its partial reduction with oxygen loss and not because of carbon pollution. The influence of the electric field on oxygen vacancies during grain growth (regime 2) had not been deeply investigate and could be an interesting topic for further study.
3.3. Densification mechanism
The value of stress exponent n is determined during regime 1) for each powders. The following experimental conditions are chosen:
- Dwell temperature: depending on the powder (from 825 ◦C to 1000 ◦C)
- Dwell time: 10 min - Heating rate: 100 ◦C.min−1
- Macroscopic applied pressure: 100 MPa
With the sample density at 600 ◦C and the electrode displacement
measured every 0.5 s, it is possible to calculate the sample instantaneous relative density (Dint) using Eq. (11). A part of the displacement
measured during the sintering is a consequence of the SPS column (spacers and tool) thermal expansion, it is then necessary to do a correction to know the real displacement of the sample and so to calculate its true thickness li during the sintering.
Dint= ( lf li ) Df (11)
With lf the sample thickness (in mm) after sintering, li the
instanta-neous sample thickness (in mm) and Df the sample relative density after
sintering.
It is to be noted that most of the increase of D (i.e. highest densifi-cation rate) is occurring during the first 120 s of the dwell. As it is sys-tematic for each material, n values are determined as the slope of the plot of Eq. (5) for the first 120 s of the dwell. Results obtained at 950 ◦C
for TZ-3Y and at 900 ◦C for the other materials are represented in Fig. 8.
For TZ-3Y, the stress exponent n exhibits value of 2.10 at 950 ◦C,
close to n = 2. For US-3Y, n = 1.58 at 900 ◦C. This n value is in between 1
and 2 but the average value determined at different temperatures is closest to n = 2. For TZ-8Y and US-8Y, the stress exponents n exhibit values of 2.85 and 3.05 respectively, close to n = 3.
The plotting of 1
DdDdt as a function D permits to calculate σeff and μeff
that are used for the plot of ln [ T μeff ( μeff σeff )n 1 DdDdt ] as a function of 1 T (Fig. 9),
the slope is therefore equals to − Qd
R and permits to determine the
acti-vation energy Qd.
The results summarized in Table 3 can be compared with those found in the literature (Table 3). However, all the informations are not always available in the publications cited, in particular the nature of diffusing species.
With TZ-3Y, a stress exponent of 2 is determined. A same value is obtained by Bernard-Granger et al. [9] and corresponds to a densifica-tion by grain boundary sliding accommodated by an in-series inter-face-reaction/lattice diffusion of Zr4+ and/or Y3+ cations. A
densification is “interface-reaction controlled” when diffusion rate is imposed by local processes occurring at the interface (i e. at grain Fig. 4. Raman spectra of TZ-3Y sintered at different temperatures.
boundaries) rather than at long range diffusion [57]. In our study, the stress exponent is determined when no grain growth had already occurred, the grain size is still in the low part of the submicronic range. With such a small grain size, the diffusing path (grain boundaries) are short and so the diffusing rate are fast which induces a dominant interface-reaction mechanism [58]. In theory the diffusional process of ions requires that grain boundaries act as perfect sources and sinks of vacancies so that all the energy is expended to lead the diffusional flux along the grain boundaries. But in reality some part of this energy will help to the inclusion or the removal of a vacancy from a grain boundary [59].
In this study, an activation energy of 673 ± 9 kJ.mol−1
corre-sponding to a volume diffusion of cation Zr4+or Y3+is obtained. It is
higher than the 450 kJ.mol−1 found by Bernard-Granger et.al. [9] but in
the range of values found in the literature (Table 3).
For US-3Y, a same stress value of 2 corresponding to a grain boundary sliding accommodated by interface-reaction densification
mechanism is obtained. However, the activation energy (250 ± 3 kJ. mol−1) is far lower the one obtained for TZ-3Y (673 ± 9 kJ.mol−1).
Theunissen et al. [48] studied densification and grain growth mecha-nisms of nanometric (i.e. ≈ 15 nm) TZP powder. They obtained an activation energy of 100 kJ.mol−1 with a n value of 2 when sintering
occurs in the temperature range of 650 ◦C–900 ◦C, corresponding to a
mechanism of Zr4+surface diffusion. In this study the initial particle size
of US-3Y is more than half the TZ-3Y one and slightly higher than the one in the Theunissen et al. paper [48]. Then, we suggest that same densification mechanism is occurring for US-3Y as for TZP powder studied by Theunissen et al. [48]. Moreover, in our study densification mechanism is identified when there is no grain growth, at initial relative densities between 61 % and 70 % which corresponds to the end of the initial stage of sintering and the beginning of intermediate stage. We conclude then that concerning US-3Y, it could exist an overlapping of densification mechanisms by surface diffusion and grain boundary sliding accommodated by interface-reaction.
Concerning TZ-8Y and US-8Y, a higher n value of 3 (when n = 2 for
TZ-3Y) is obtained. It corresponds to a densification by dislocation
climbing. TEM observation (Fig. 10) of sample US-8Y (sintered at 900
◦C, 10 min and 100 MPa) confirmed this stress exponent value by
revealing the presence of dislocation networks (insert Fig. 10). Langer
et al. [10] found n = 1 for a polycrystalline cubic zirconia powder (8% mol. YSZ with 150 nm average particle size) densified by SPS, corre-sponding to a densification by grain boundary diffusion. A stress expo-nent n = 1 is also reported in two other studies for polycrystalline cubic zirconia (Table 3). The difference of sintering mechanism can be explained by the application of a higher macroscopic stress (100 MPa) in
the present study. In literature, all stress exponent determinations are performed at a low sintering pressure (<100 MPa) [10,52,53]. Studies at higher pressures (>100 MPa) are conducted on cubic zirconia single crystals for high temperature creep purpose and evidenced creep by dislocation climb (n > 3) or plastic deformation (n > 4.5) [54–56]. For dislocation climb, activations energy for Zr4+or Y3+volume diffusion of
577 and 528 kJ. mol−1 are reported [55,56], much lower than the one
determined in the present study for TZ-8Y (1142 ± 11 kJ.mol−1) but in
agreement with the one obtained for US-8Y (575 ± 3 kJ.mol−1).
Such a high activation energy of 1142 ± 11 kJ.mol−1 is a possible
consequence of a low amount of defects. In their study, Bernard-Granger Fig. 6. Evolution of the relative density and grain size as a function of temperature during TZ-3Y and US-3Y SPS sintering.
et al. [60] have also obtained a high value of 935 kJ.mol−1 for a TZP
powder during intermediate step of sintering (relative density equals to 73 %), they suggest that due to the low relative density (high porosity and low amount of grain boundaries), the creation of point defect is too hard and so controls the densification.
In our present study, the stress exponent is determined between 900
◦C and 950 ◦C, when relative density is between 54 % and 64 % (lower
than the range of Bernard-Grander et al. study), so the hard point defects formation can explain the higher activation energy.
For US-8Y, stress exponent is determined also during intermediate step of sintering (between 825 ◦C and 900 ◦C) when relative densities
are slightly higher in the range between 58 % and 68 % so it should also impact the activation energy by increasing it, but this increase may be partially compensated by the fact that grain size is lower. As found for US-3Y, so the densification of US-8Y may also occur by the formation of point defects.
3.4. Grain growth mechanism
In order to determine the grain growth mechanism, the following experimental conditions are chosen:
- Dwell temperature: 1100− 1300 ◦C for TZ-3Y; 1000− 1300 ◦C for
TZ-8Y; 1200− 1400 ◦C for US-3Y; 1100− 1400 ◦C for US-8Y
- Dwell time: 0, 10, 20, 30 min - Heating rate: 100 ◦C.min−1
- Macroscopic applied pressure: 100 MPa
FESEM observations of the fracture surfaces of 3Y samples are pre-sented in Fig. 11. The fracture mode is intergranular for TZ-3Y sintered at 1100 ◦C with no dwell time (Fig. 11 a)), some transgranular areas start
to appear when sintering is performed at 1300 ◦C with no dwell time
(Fig. 11 b)) and become majority when a dwell time of 30 min is applied at this temperature (Fig. 11 c)). The analysis of transgranular fractures requires a thermal etching (100 ◦C under the sintering temperature,
during 1 min) in order to reveal the grain boundaries to be able to measure the average grain size. Fig. 11 d) is the FESEM image obtained after the thermal etching of TZ-3Y sintered at 1300 ◦C during 30 min
(Fig. 11 c), the grain boundaries are clearly evidenced. When consoli-dating the US-3Y powder, the fracture profile mainly remains inter-granular for the all temperature range explored (Fig. 11 e). However, on
Fig. 11f some areas of transgranular rupture can be observed larger in size than those of the rest of the grains. This may reflect the initial particles size distribution of the powder. In addition, it has been clearly shown for the rupture mode on dense samples is first intergranular and becomes progressively transgranular increasing sintering set-point temperature (i.e. grain size). As observed for TZ-3Y, same phenome-non may be evidenced here on US-3Y but at higher temperature due to the smaller initial particle size, compared to TZ-3Y.
Similar observations can be done with the 8Y powders. For TZ-8Y, the fracture profile is intergranular (Fig. 12 a)) when sintering is per-formed up to 1100 ◦C for 10 min (Fig. 12 b)) while transgranular areas
appear when a dwell time of 20 min is applied at this temperature and these become the majority beyond these conditions (T and t) (Fig. 12 c)). It is to be noted, this transgranular fracture mode starts to appear at lower temperature than for TZ-8Y compare to TZ-3Y (1100 ◦C for TZ-8Y
against 1300 ◦C for TZ-3Y). Same kind of thermal etching is then
necessary in order to measure the average grain size (Fig. 12 d)). For US- 8Y (Fig. 12 e) and f)), like for US-3Y material, the fracture profile is mainly intergranular in the temperature range explored and some transgranular fractures start to appear when US-8Y is sintered at 1100 ◦C
for 30 min (Fig. 12 e)).
It can be noticed on Fig. 6 and Fig. 7 that at 1300 ◦C for TZ-3Y and
1100 ◦C for TZ-8Y, both samples reached approximatively the same
average grain size around 200 nm. At 1300 ◦C for US-3Y and 1100 ◦C for
US-8Y, the grain size is around 400 nm for both samples. It seems then that fracture mode is directly related to the grain size.
Fig. 8. Stress exponent determination at different temperatures for a) TZ-3Y, b) US-3Y, c) TZ-8Y and d) US-8Y.
For sample sintered with different powders of the same yttria content (TZ-3Y / US-3Y or TZ-8Y / US-8Y), it has been observed that inter-granular was the main fracture profile at low grain size and then transgranular fracture started to appear when the grain size reaches 200 nm for TZ powders and 400 nm for US powders. This may suggest that the sample with transgranular fractures show higher quality grain boundaries than the sample with intergranular fractures. These obser-vations made at different temperatures need more investigations and characterizations to make a definitive conclusion and could be the topic of a second study.
The evolution of Gm− Gm0 as a function of time is reported in Fig. 13. Using the methodology presented in §2.4.2, the grain growth exponent
m is determined. For TZ-3Y, linear regression coefficients are equals to
0.97, 0.93 and 0.88 for m values of 2, 3 and 4 respectively. It is when m =
2 that the coefficient is the closest to 1. This value corresponds, to a grain growth controlled by grain boundaries motion in a pure material [28]. This methodology is applied for each ceramic and the grain growth exponent m is equal to 2 for all the samples whatever the temperature. In the literature, an m value of 3 is generally obtained (Table 4). This m value of 3 is attributed to a grain growth mechanism in impure fully densified materials controlled by the presence of a second phase or impurities at grain boundaries [28].
According to several groups [40,65,66], yttrium segregation at grain boundaries is governing 3YSZ grain growth during sintering in a two-phased tetragonal-cubic zirconia ceramic. In these studies, ceramics are pressureless sintered (under air) at high temperature (T ≥ 1300 ◦C)
with long dwell times (from tens of minutes to tens of hours) which causes the formation of a two-phased tetragonal-cubic zirconia (by segregation of yttrium cations at grains boundaries). EDS analyses are performed on a TZ-3Y ceramic sintered at 1400 ◦C during 30 min
(Fig. 14). It appears that cations Zr4+and Y3+are homogeneously spread
in each grain, so there is no segregation of Y3+ at grain boundaries
during SPS of monophased tetragonal zirconia. A grain growth mecha-nism governed by Y3+grain boundary segregation can thus be ruled out
for monophased tetragonal zirconia, suggesting that this latter can be considered like a pure material, contrary to two-phased tetragonal-cubic zirconia.
As suggested by Quach et al. [67] and Ghosh et al. [44], the appli-cation of an electrical field could create a space charge near the grain boundaries. This “barrier” would limit the diffusion of cations and then the mobility of the boundaries which slows the grain growth. This hy-pothesis, probably coupled with high grain growth rate imposed by SPS, could explain why no yttrium segregation can be observed at grain boundaries on our samples and why a different grain growth exponent (i. e. a different grain growth mechanism) is obtained compared to literature.
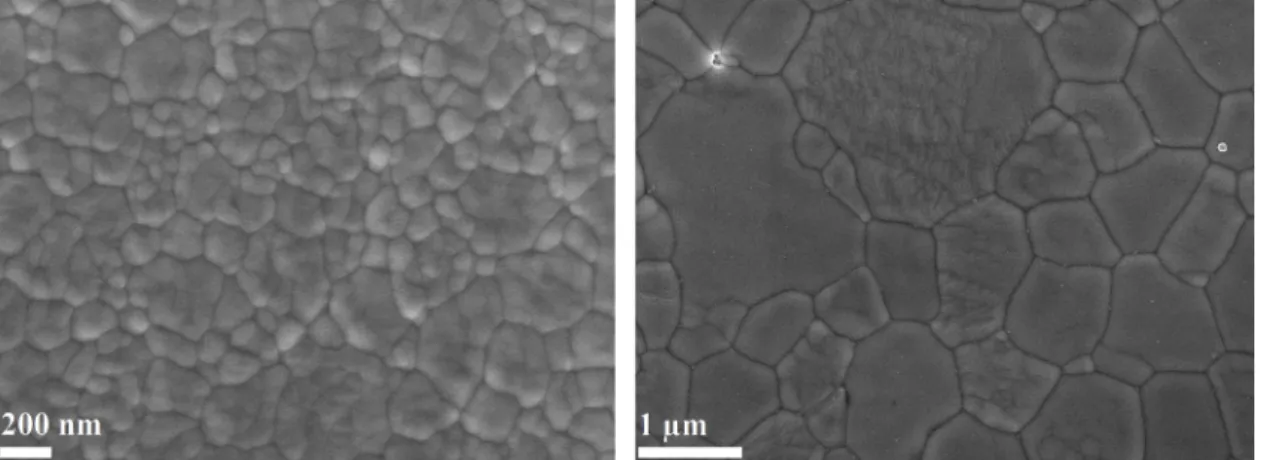
Finally, Fig. 15 reveals that grain boundaries are curved in both cases for fully tetragonal zirconia (Fig. 15 a)) as well as for fully cubic zirconia (Fig. 15 b)). It is well-known that difference in grain size will create curved boundaries that causes a variation of pressure from one side of the grain boundary to the other (compression forms under the surface of the little grain side and tension under the surface of the big grain side), Table 3
Zirconia densification mechanisms in literature: References (Ref), Zirconia studied (Mat), Sintering method used (Sint: SF for Sinter forging, PlS for Pressureless Sintering and ECAS for Electrical current-activated/assisted sintering), Temperature (T), Relative density at soak end (Df), stress exponent (n), activation energy (Qd),
V for volume diffusion, GB for grain boundary diffusion and S for surface diffusion.
Ref Mat Sint T (◦C) D
f (%) n Qd (kJ/mol) Diffusion type (Diffusion species)
This study TZ-3Y SPS 950− 975-1000 2 673 ± 9 V (Zr4+- Y3+) US-3Y SPS 850− 875-900 2 240 ± 3 S (Zr4+) TZ-8Y SPS 900− 925-950 3 1142 ± 11 V (Zr4+- Y3+) US-8Y SPS 825− 875-900 3 575 ± 3 V (Zr4+- Y3+) [9] 3Y SPS 950− 1050 66− 83 2 450 V (Zr4+) [44] 3Y SF 1300− 1600 – – 610 506 V GB [45] 3Y – – – – 390− 425 V (Zr4+- Y3+) [46] 3Y PlS 1400− 1600 – – 515− 500 V (Zr4+- Y3+) [47] 3Y – 1250− 1450 – 2 460 GB (Zr4+) [48] 3Y PlS 650− 900 48− 53 – 100 S [49] 3Y PlS 1276− 1476 – – 506 GB [50] 3Y PlS 930− 1370 – – 670 GB [42] 3Y PlS 1000− 1100 – – 683 GB [10] 8Y SPS 1200− 1300 65 1 630 GB [49] 8Y PlS 1276− 1476 – – 309 GB (Zr4+) [50] 8Y PlS 930− 1370 – – 757 GB [51] 8Y PlS 1300− 1600 50− 60 1 668 V [52] 8Y ECAS 1026− 1126 – 1 350 GB (Zr4+) [53] 8Y PlS 1600 – 1 460 GB (Zr4+)
[54] 8Y* High temperature Creep 1300− 1400 1450− 1550 – – 7.3 4.5 711 586 V (ZrV (Zr4+4+- Y- Y3+3+) )
[55] 8Y* High temperature Creep >1500 – 3 577 V (Zr4+- Y3+)
[56] 8Y* High temperature Creep >1500 – 3 528 V (Zr4+- Y3+)
*Studies performed on single crystals.
Fig. 10. TEM observation of dislocation network on US-8Y sample sintered at
which engenders the motion of the grain boundary from big grains to the direction of the center of the little one leading to the disappearance of the latter [64,65]. As a consequence, we can conclude that grain growth of monophased TZP and FSZ ceramics by SPS occurs by normal grain growth in a homogenous material. This result is in agreement with those reported by Lee et al. [41] who mention a normal grain growth by grain boundaries migration for TZP and FSZ during pressureless sintering.
Moreover, it can be noticed that for 3YSZ ceramics, higher the temperature is, closer are the R2 during the determination of the grain size exponents when taking a value of 2 and 3. Therefore, it seems that the sintering of YSZ with SPS, delays the formation of cubic phase and a normal grain growth occurs (corresponding to a grain size exponent equal to 2). We suggest that when the temperature will be higher and/or for longer sintering times, a segregation of Y3+will probably start at the
grain boundaries leading to the formation of cubic phase. With this change, the linear coefficient closest to 1 will slowly passes from 2 to 3,
the last one associated to the mechanism mostly found in the literature. The normal law has been used at lower temperature in order to observe if densification had an impact on the grain growth and the same grain size exponent has been found so we can conclude that with those experimental conditions, densification has no impact on the grain growth mechanism.
4. Conclusions
The spark plasma sintering of commercial YSZ powders with different yttria amounts (3 mol. % and 8 mol. %) and different particle sizes (between 16 nm and 51 nm) was investigated and sintering mechanisms were determined. To the best author knowledge, this is the first time that such a comparative study on YSZ spark plasma sintering is reported. As expected, sintering trajectories reveal that powders with lowest particle sizes (US-3Y, 21 nm and US-8Y, 16 nm) start to Fig. 11. FESEM images of ceramics after sintering by SPS: a) TZ-3Y 1100 ◦C, 0 min dwell, b) TZ-3Y 1300 ◦C, 0 min dwell time, c) TZ-3Y 1300 ◦C, 30 min dwell, d),
consolidate at a lower temperature than the two other powders with larger particle sizes (TZ-3Y, 47 nm and TZ-8Y, 51 nm). Sintering tra-jectories also evidence that FSZ (US-8Y and TZ-8Y) present a larger grain growth than TZP (US-3Y and TZ-3Y). In the densification regime, stress exponents and activation energies have been determined using the formalism used by Bernard-Granger et al. [9]. For TZ-3Y (n = 2 and Qd = 673 ± 9 kJ.mol−1), densification occurs by grain boundary sliding
accommodated by an in-series interface-reaction/lattice diffusion of the Zr4+and/or Y3+cations. For US-3Y (n = 2 and Qd =240 ± 4 kJ.mol−1), of lower particle size than TZ-3Y, there is an overlapping of surface diffusion and grain boundary sliding densification mechanism. Con-cerning TZ-8Y (n = 3 and Qd =1142 ± 11 kJ.mol−1) and US-8Y (n = 3 and Qd =575 ± 3 kJ.mol−1), densification may occur via dislocation climbing, as confirmed by HRTEM observations. It appears that densi-fication mechanisms are impacted by the yttria amount (n = 2 for 3Y powders being TZP and n = 3 for 8Y powders being FSZ) while sinter-ability and activation energies are impacted by the initial powder
particle sizes.
Grain growth mechanisms were determined in the final sintering stage by using a conventional power law. A grain size exponent equal to 2 is determined for all the samples. This value corresponds to a grain growth occurring by grain boundaries motion in a mono-phased mate-rial. In literature, an exponent of 3 is usually found, corresponding to an yttrium segregation at grain boundaries for two-phased materials. However, our results are completely justified by the mono-phased ce-ramics obtained (tetragonal for TZP and cubic for FSZ both confirmed by Raman spectroscopy), the absence of yttrium segregation at grain boundaries (influenced by a space charge created by the SPS electrical field slowing the diffusivity of species and the grain growth rate), the absence of a second/glassy phase at grain boundaries and the distribu-tion of grain sizes in ceramics inducing grain boundaries curvatures and thus their motion and grain growth. Neither the particle size, nor the yttria amount impact the grain growth mechanism, it can then be sug-gested that the densification rate obtained by SPS and the presence of an Fig. 12. FESEM images of ceramics after sintering by SPS: a) TZ-8Y 1100 ◦C, 0 min dwell, b) TZ-8Y 1100 ◦C, 10 min dwell, c) TZ-8Y 1100 ◦C, 20 min dwell, d), TZ-8Y
electrical field creating a space charge limiting the cation segregation and so the boundary mobility is the cause of the grain growth mechanism.
Declaration of Competing Interest
None.
References
[1] J. Chevalier, What future for zirconia as a biomaterial? Biomaterials 27 (2006) 535–543, https://doi.org/10.1016/j.biomaterials.2005.07.034.
[2] A. Weber, E. Ivers-Tiff´ee, Materials and concepts for solid oxide fuel cells (SOFCs) in stationary and mobile applications, J. Power Sources 127 (2004) 273–283,
https://doi.org/10.1016/j.jpowsour.2003.09.024.
[3] D. Monceau, D. Oquab, C. Estourn`es, M. Boidot, S. Selezneff, N. Ratel-Ramond, Thermal barrier systems and multi-layered coatings fabricated by spark plasma sintering for the protection of Ni-Base superalloys, Mater. Sci. Forum. 654–656 (2010) 1826–1831, https://doi.org/10.4028/www.scientific.net/msf.654-
656.1826.
[4] Koji Tsukuma, Kanagawa, United States Patent, 2 (2016), US 9.249,057 B2. [5] G. Cao, C. Estournes, J. Garay, O. Roberto, Spark plasma sintering. Current Status,
New Developments and Challenges, 1st edition, 2019, https://doi.org/10.1016/
C2018-0-02428-7.
[6] C. Mani`ere, U. Kus, G. Chevallier, A. Weibel, L. Durand, J. Huez, D. Delagnes, C. Estourn`es, How to overcome the main challenges of SPS technology: reproductibility, multi-samples and elaboration of complex shapes, Chapter 3. Spark Plasma Sintering, 1st edition, Current Status, New developments and challenges, Elsevier, 2019, https://doi.org/10.1016/B978-0-12-817744-0.00003-
9.
[7] C. Mani`ere, L. Durand, A. Weibel, C. Estourn`es, Spark-plasma-sintering and finite element method: from the identification of the sintering parameters of a submicronic α-alumina powder to the development of complex shapes, Acta Mater.
102 (2016) 169–175, https://doi.org/10.1016/j.actamat.2015.09.003. [8] R. Chaim, A. Weibel, G. Chevallier, C. Estournes, Grain growth during spark plasma
and flash sintering of ceramic nanoparticles : a review, J. Mater. Sci. 53 (2018) 3087–3105, https://doi.org/10.1007/s10853-017-1761-7.
[9] G. Bernard-Granger, C. Guizard, Spark plasma sintering of a commercially available granulated zirconia powder: I. Sintering path and hypotheses about the mechanism(s) controlling densification, Acta Mater. 55 (2007) 3493–3504,
https://doi.org/10.1016/j.actamat.2007.01.048.
[10] J. Langer, M.J. Hoffmann, O. Guillon, Electric field-assisted sintering in comparison with the hot pressing of yttria-stabilized zirconia, J. Am. Ceram. Soc. 94 (2011) 24–31, https://doi.org/10.1111/j.1551-2916.2010.04016.x. [11] P. Dahl, I. Kaus, Z. Zhao, M. Johnsson, M. Nygren, K. Wiik, T. Grande, M.
A. Einarsrud, Densification and properties of zirconia prepared by three different sintering techniques, Ceram. Int. 33 (2007) 1603–1610, https://doi.org/10.1016/j.
ceramint.2006.07.005.
[12] M.I. Mendelson, Average grain size in polycrystalline ceramics, J. Am. Ceram. Soc. 52 (1969) 443–446, https://doi.org/10.1111/j.1151-2916.1969.tb11975.x.
[13] C.H. Morris, M. Evans, E. Paretzkin, B. Wong-Ng, W. Hubbard, Powder Diffraction,
1986.
[14] T. Malek, J. Benes, L. Mitsuhashi, Powder diffraction data and Rietveld refinement of metastable t-ZrO2 at low temperature, Powder Diffr. 12 (2) (1997) 96–98,
https://doi.org/10.1017/S0885715600009519.
[15] D. Wang, Y. Guo, K. Liang, K. Tao, Crystal structure of zirconia by Rietveld refinement, Sci. China Ser. A Math. 42 (1) (1999) 80–86, https://doi.org/10.1007/
bf02872053.
[16] J. Besson, M. Abouaf, Microstructural changes in Alumina during {HIP}, Mater. Sci. Engng A. 109A (1989) 37–43, https://doi.org/10.1016/0921-5093(89)90562-
5.
Fig. 13. Formalism used to determine grain size exponent. Slopes are calculating when plotting Gm – G0m with different values of m as a function of dwell time. The
highest slope is related to the grain growth mechanism occurring.
Table 4
Zirconia grain growth mechanism in literature: Ref for reference; Mat for material; Atm for atmosphere; T for temperature; t for time and G for grain size.
Ref Mat Sint Atm T (◦C) t D
r (%) Gmax Mechanism
[41] 2Y PlS Air 1300− 1700 – – – m = 2 (for both)
8Y
[61] 3Y PlS Air 1350− 1650 48 min 223 min – 2 μm m = 3
[62] 3Y PlS Air 1100− 1400 2 h 95 70 nm Y3+segregationn 15 h [63] 6Y PlS Air 1400 5 min 98 3 μm m = 3 8 h Y3+segregationn 24 h 72 h [64] 3Y PlS Air 1400− 1800 2 h 98 2.5 μm m = 3 [11] 8Y PlS HP Air 1300− 1500 1− 12 h 97 12 μm m = 3 SPS N2 1150− 1300 0− 6 h 99 370 nm Void 1100− 1300 0− 10 min 99 330 nm [65] 3Y PlS Air 1300− 1500 0− 50 h 95 200 nm 1 μm m = 3
[17] O. Guillon, J. Langer, Master sintering curve applied to the Field-Assisted Sintering Technique, J. Mater. Sci. 45 (2010) 5191–5195, https://doi.org/10.1007/s10853-
010-4556-7.
[18] A. Addad, D. Vernat, C. Guizard, G. Bernard-Granger, G. Bonnefont, G. Fantozzi, Spark plasma sintering of a commercially available granulated zirconia powder: Comparison with hot-pressing, Acta Mater. 58 (2010) 3390–3399, https://doi.org/
10.1016/j.actamat.2010.02.013.
[19] P.S. Brook, R.J. Gilbert, E. Hind, J.M. D Vieira, in: D. Kolar, R. MM (Eds.), Theory
and Practice, 1982.
[20] R.L. Coble, Diffusion models for hot pressing with surface energy and pressure effects as driving forces, J. Appl. Phys. 41 (1970) 4798–4807, https://doi.org/
10.1063/1.1658543.
[21] R.K. Bordia, R. Raj, Sintering of TiO2–Al2O3 composites: a model experimental investigation, J. Am. Ceram. Soc. 71 (1988) 302–310, https://doi.org/10.1111/
j.1151-2916.1988.tb05863.x.
[22] A.K. Mukherjee, J.E. Bird, J.E. Dorn, Experimmental correlations for high
temperature creep, Trans ASM. 62 (1968) 155–179.
[23] A.S. Helle, K.E. Easterling, M.F. Ashby, Hot-isostatic pressing diagrams: new developments, Acta Metall. 33 (1985) 2163–2174, https://doi.org/10.1016/0001-
6160(85)90177-4.
[24] D.C.C. Lam, F.F. Lange, A.G. Evans, Mechanical properties of partially dense alumina produced from powder compacts, J. Am. Ceram. Soc. 77 (1994) 2113–2117, https://doi.org/10.1111/j.1151-2916.1994.tb07105.x.
[25] J. Luo, R. Stevens, Porosity-dependence of elastic moduli and hardness of 3Y-TZP ceramics, Ceram. Int. 25 (1999) 281–286, https://doi.org/10.1016/S0272-8842
(98)00037-6.
[26] J.W. Adams, R. Ruh, K.S. Mazdiyasni, Young’s modulus, flexual strength, and fracture of yttria-stabilized zirconia versus temperature, J. Am. Ceram. Soc. 80 (1997) 903–908, https://doi.org/10.1111/j.1151-2916.1997.tb02920.x. [27] G.P. Cousland, X.Y. Cui, A.E. Smith, A.P.J. Stampfl, C.M. Stampfl, Mechanical
properties of zirconia, doped and undoped yttria-stabilized cubic zirconia from first-principles, J. Phys. Chem. Solids 122 (2018) 51–71, https://doi.org/10.1016/
j.jpcs.2018.06.003.
[28] D. Bernache-Assollant, M. Soustelle, C. Monty, H. Pastor, J.M. Chaix, Chimie-
Physique Du Frittage, FORCERAM formation C´eramique, 1993.
[29] B.K. Kim, J.W. Hahn, K.R. Han, Quantitative phase analysis in tetragonal-rich tetragonal/monoclinic two phase zirconia by Raman spectroscopy, J. Mater. Sci. Lett. 16 (1997) 669–671, https://doi.org/10.1023/A:1018587821260. [30] Olga Fabrichnaya, F. Aldinger, Assessment of thermodynamic parameters in the
system ZrO2-Y2O3-Al2O3, Int. J. Mater. Res. Adv. Tech. 95 (2004) 27–39, https://
doi.org/10.7868/s0002337x13030160.
[31] G. Bernard-Granger, C. Guizard, S. Surbl´e, G. Baldinozzi, A. Addad, Spark plasma sintering of a commercially available granulated zirconia powder-II.
Microstructure after sintering and ionic conductivity, Acta Mater. 56 (2008) 4658–4672, https://doi.org/10.1016/j.actamat.2008.05.031.
[32] P. Mondal, A. Klein, W. Jaegermann, H. Hahn, Enhanced specific grain boundary conductivity in nanocrystalline Y2O3-stabilized zirconia, Solid State Ion. 118 (1999) 331–339, https://doi.org/10.1016/s0167-2738(98)00452-4.
[33] M. Winterer, R. Nitsche, S.A.T. Redfern, W.W. Schmahl, H. Hahn, Phase stability in nanostructured and coarse grained zirconia at high pressures, Nanostructured Mater. 5 (1995) 679–688, https://doi.org/10.1016/0965-9773(95)00277-L. [34] R. Srinivasan, R.J. De Angelis, G. Ice, B.H. Davis, Identification of tetragonal and
cubic structures of zirconia using synchrotron x-radiation source, J. Mater. Res. 6 (1991) 1287–1292, https://doi.org/10.1557/JMR.1991.1287.
[35] C. Wulfman, M. Sadoun, M. Lamy De La Chapelle, Interest of Raman spectroscopy for the study of dental material: the zirconia material example, Irbm. 31 (2010) 257–262, https://doi.org/10.1016/j.irbm.2010.10.004.
[36] J. Chevalier, L. Gremillard, A.V. Virkar, D.R. Clarke, The tetragonal-monoclinic transformation in zirconia: lessons learned and future trends, J. Am. Ceram. Soc. 92 (2009) 1901–1920, https://doi.org/10.1111/j.1551-2916.2009.03278.x. [37] C. Herring, Effect of change of scale on sintering phenomena, J. Appl. Phys. 21
(1950) 301, https://doi.org/10.1063/1.1699658.
[38] T. Stoto, M. Nauer, C. Carry, Influence of residual impurities on phase partitiioning and grain growth processes of Y-TZP materials, J. Am. Ceram. Soc. 74 (1991) 2615–2621, https://doi.org/10.1111/j.1151-2916.1991.tb06809.x.
[39] Y. Yoshizawa, T. Sakuma, Evolution of microstructure and grain growth in Zr02- Y203 alloys, ISIJ Int. 29 (1989) 746–752, https://doi.org/10.2355/
isijinternational.29.746.
[40] K. Matsui, H. Horikoshi, N. Ohmichi, M. Ohgai, H. Yoshida, Y. Ikuhara, Cubic- formation and grain-growth mechanisms in tetragonal zirconia polycrystal, J. Am. Ceram. Soc. 86 (2003) 1401–1408, https://doi.org/10.1111/j.1151-2916.2003.
tb03483.x.
[41] I.G. Lee, I. Chen, Sintering and grain growth in tetragonal and cubic zirconia, in:
Tokyo, November 4–7, 1987 Elsevier Applied Science, London, in: S. Somiya, M. Shimada, M. Yoshimura, R. Watanabe (Eds.), Sintering 87, Proc. 4th Int. Symp.
on Science and Technology of Sintering, Vol. 1, 1988, pp. 340–345.
[42] K. Matsui, A. Matsumoto, M. Uehara, N. Enomoto, J. Hojo, Sintering kinetics at isothermal shrinkage: effect of specific surface area on the initial sintering stage of fine zirconia powder, J. Am. Ceram. Soc. 90 (2007) 44–49, https://doi.org/
10.1111/j.1551-2916.2006.01341.x.
[43] U. Anselmi-Tamburini, J.E. Garay, Z.A. Munir, A. Tacca, F. Maglia, G. Chiodelli, G. Spinolo, Spark plasma sintering and characterization of bulk nanostructured fully stabilized zirconia: part II. Characterization studies, J. Mater. Res. 19 (2004) 3263–3269, https://doi.org/10.1557/jmr.2004.0424.
[44] S. Ghosh, A.H. Chokshi, P. Lee, R. Raj, A huge effect of weak dc electrical fields on grain growth in zirconia, J. Am. Ceram. Soc. 92 (2009) 1856–1859, https://doi.
org/10.1111/j.1551-2916.2009.03102.x.
[45] Y. Oishi, K. Ando, Y. Sakka, M.F. Yan, Advances in ceramics, in: A.H. Heuer (Ed.),
Additives and Interfaces in Electronic Ceramics, vol. 7, ACerS, Columbus, OH,
1983, pp. 208–219.
[46] S. Swaroop, M. Kilo, C. Argirusis, G. Borchardt, A.H. Chokshi, Lattice and grain boundary diffusion of cations in 3YTZ analyzed using SIMS, Acta Mater. 53 (2005) 4975–4985, https://doi.org/10.1016/j.actamat.2005.05.031.
[47] M. Jim´enez-Melendo, A. Domínguez-Rodríguez, A. Bravo-Leon, Superplastic flow of fine-grained Y-TZP: constituive equation and deformation mechanisms, J. Am. Ceram. Soc. 81 (1998) 2761–2776, https://doi.org/10.1111/j.1151-2916.1998.
tb02695.x.
[48] G.S.A.M. Theunissen, A.J.A. Winnubst, A.J. Burggraaf, Sintering kinetics and microstructure development of nanoscale Y-TZP ceramics, J. Eur. Ceram. Soc. 11 (1993) 315–324, https://doi.org/10.1016/0955-2219(93)90031-L.
Fig. 14. EDS analysis of Zirconium (red) and Yttrium (green) repartition in TZ-
3Y sintered at 1400 ◦C with a 30 min dwell time. Dash lines represent grain
boundaries (For interpretation of the references to colour in this figure legend, the reader is referred to the web version of this article).
[49] A.H. Chokshi, Diffusion, diffusion creep and grain growth characteristics of nanocrystalline and fine-grained monoclinic, tetragonal and cubic zirconia, Scr. Mater. 48 (2003) 791–796, https://doi.org/10.1016/S1359-6462(02)00519-5. [50] K. Matsui, K. Tanaka, T. Yamakawa, M. Uehara, N. Enomoto, J. Hojo, Sintering
kinetics at isothermal shrinkage: II, effect of Y2O3 concentration on the initial sintering stage of fine zirconia powder, J. Am. Ceram. Soc. 90 (2007) 443–447,
https://doi.org/10.1111/j.1551-2916.2006.01440.x.
[51] T.S. Zhang, S.H. Chan, W. Wang, K. Hbaieb, L.B. Kong, J. Ma, Effect of Mn addition on the densification, grain growth and ionic conductivity of pure and SiO2- containing 8YSZ electrolytes, Solid State Ion. 180 (2009) 82–89, https://doi.org/
10.1016/j.ssi.2008.10.010.
[52] T. Kumagai, Estimation of stress exponent and activation energy for rapid densification of 8 mol% yttria-stabilized zirconia powder, J. Am. Ceram. Soc. 96 (2013) 852–858, https://doi.org/10.1111/jace.12117.
[53] A. Lakki, R. Herzog, M. Weller, H. Schubert, C. Reetz, O. G¨orke, M. Kilo, G. Borchardt, Mechanical loss, creep, diffusion and ionic conductivity of ZrO2-8 mol%Y2O3 polycrystals, J. Eur. Ceram. Soc. 20 (2000) 285–296, https://doi.org/
10.1016/S0955-2219(99)00162-4.
[54] J. Martinez-Fernandez, M. Jimenez-Melendo, A. Dominguez-Rodriguez, A. H. Heuer, High-temperature creep of yttria-stabilized zirconia single crystals, J. Am. Ceram. Soc. 73 (1990) 2452–2456, https://doi.org/10.1111/j.1151-
2916.1990.tb07612.x.
[55] A. Domínguez-Rodríguez, M. Jim´enez-Melendo, J. Castaing, Plasticity of zirconia, in: R.C. Bradt, C.A. Brookes, J.L. Routbort (Eds.), Plastic Deformation of Ceramics, Springer, Boston, MA, 1995, https://doi.org/10.1007/978-1-4899-1441-5_3. [56] D. G´omez-García, J. Martínez-Fern´andez, A. Domínguez-Rodríguez, J. Castaing,
Mechanisms of high-temperature creep of fully stabilized zirconia single crystals as a function of the yttria content, J. Am. Ceram. Soc. 80 (2005) 1668–1672, https://
doi.org/10.1111/j.1151-2916.1997.tb03036.x.
[57] E. Arzt, M.F. Ashby, R.A. Verrall, Interface controlled diffusional creep, Acta Metall. 31 (1983) 1977–1989, https://doi.org/10.1016/0001-6160(83)90015-9.
[58] Z. He, J. Ma, Densification and grain growth during interface reaction controlled sintering of alumina ceramics, Ceram. Int. 27 (2001) 261–264, https://doi.org/
10.1016/S0272-8842(00)00073-0.
[59] M.F. Ashby, On interface-reaction control of Nabarro-Herring creep and sintering, Scr. Metall. Mater. 3 (1969) 837–842, https://doi.org/10.1016/0036-9748(69)
90191-4.
[60] G. Bernard-Granger, C. Guizard, Apparent activation energy for the densification of a commercially available granulated zirconia powder, J. Am. Ceram. Soc. 90 (2007) 1246–1250, https://doi.org/10.1111/j.1551-2916.2006.01415.x. [61] T. -G Nieh, J. Wadsworth, Dynamic grain growth during superplastic deformation
of yttria-stabilized tetragonal zirconia polycrystals, J. Am. Ceram. Soc. 72 (1989) 1469–1472, https://doi.org/10.1111/j.1151-2916.1989.tb07678.x.
[62] M.M.R. Boutz, A.J.A. Winnubst, A.J. Burggraaf, Yttria-ceria stabilized tetragonal zirconia polycrystals: sintering, grain growth and grain boundary segregation, J. Eur. Ceram. Soc. 13 (1994) 89–102, https://doi.org/10.1016/0955-2219(94)
90106-6.
[63] J.A. Allemann, B. Michel, H.B. M¨arki, L.J. Gauckler, E.M. Moser, Grain growth of differently doped zirconia, J. Eur. Ceram. Soc. 15 (1995) 951–958, https://doi.org/
10.1016/0955-2219(95)00073-4.
[64] J. Zhao, Y. Ikuhara, T. Sakuma, Grain Growth of Silica-Added Zirconia Annealed in the Cubic/Tetragonal Two-Phase Region, J. Am. Ceram. Soc. 81 (2005) 2087–2092, https://doi.org/10.1111/j.1151-2916.1998.tb02591.x. [65] K. Matsui, N. Ohmichi, M. Ohgai, H. Yoshida, Y. Ikuhara, Grain boundary
segragation-induced phase transformation in yttria-stabilized tetragonal zirconia polycrystal, J. Ceram. Soc. Japan. 114 (2006) 230–237, https://doi.org/10.2109/
jcersj.114.230.
[66] K. Matsui, H. Yoshida, Y. Ikuhara, Grain-boundary structure and microstructure development mechanism in 2-8 mol% yttria-stabilized zirconia polycrystals, Acta Mater. 56 (2008) 1315–1325, https://doi.org/10.1016/j.actamat.2007.11.026. [67] D.V. Quach, H. Avila-Paredes, S. Kim, M. Martin, Z.A. Munir, Pressure effects and
grain growth kinetics in the consolidation of nanostructured fully stabilized zirconia by pulsed electric current sintering, Acta Mater. 58 (2010) 5022–5030,
https://doi.org/10.1016/j.actamat.2010.05.038.
Fig. 15. FESEM images of TZ-3Y (left) and TZ-8Y (right) microstructures after sintering at 1400 ◦C for 30 min and polishing and a thermal etching at 1300 ◦C for 1