Congenital and Prolonged Adult-Onset Deafness
Cause Distinct Degradations in Neural ITD
Coding with Bilateral Cochlear Implants
The MIT Faculty has made this article openly available. Please share how this access benefits you. Your story matters.Citation Hancock, Kenneth E., Yoojin Chung, and Bertrand Delgutte. “Congenital and Prolonged Adult-Onset Deafness Cause Distinct Degradations in Neural ITD Coding with Bilateral Cochlear Implants.” JARO 14, no. 3 (June 2013): 393–411.
As Published http://dx.doi.org/10.1007/s10162-013-0380-5 Publisher Springer Science+Business Media
Version Author's final manuscript
Citable link http://hdl.handle.net/1721.1/85846
Terms of Use Article is made available in accordance with the publisher's policy and may be subject to US copyright law. Please refer to the publisher's site for terms of use.
Congenital and prolonged adult-onset deafness cause distinct degradations in neural ITD coding with bilateral cochlear implants
Kenneth E. Hancock1,2, Yoojin Chung1,2, and Bertrand Delgutte1,2,3
1
Eaton-Peabody Laboratories, Massachusetts Eye & Ear Infirmary, Boston MA 02114, USA
2
Department of Otology and Laryngology, Harvard Medical School, Boston MA 02115, USA
3
Research Laboratory of Electronics, Massachusetts Institute of Technology, Cambridge MA 02139, USA
Running title: Effects of prolonged adult-onset deafness on ITD coding
Abstract: 250 words Introduction: 553 words Discussion: 2414 words Pages: 36 Tables: 3 Figures: 10 Correspondence to: Kenneth E. Hancock, Ph.D. Eaton-Peabody Laboratories
Massachusetts Eye & Ear Infirmary Boston, MA 02114 USA Phone: (617) 573-5579 FAX: (617) 720-4408 email: [email protected] [email protected] [email protected]
Abstract
Bilateral cochlear implant (CI) users perform poorly on tasks involving interaural time differences (ITD), which are critical for sound localization and speech reception in noise by normal- hearing listeners. ITD perception with bilateral CI is influenced by age at onset of deafness and duration of deafness. We previously showed that ITD coding in the auditory midbrain is degraded in congenitally deaf white cats (DWC) compared to acutely deafened cats (ADC) with normal auditory development (Hancock et al., J. Neurosci, 30:14068). To determine the relative importance of early onset of deafness and prolonged duration of deafness for abnormal ITD coding in DWC, we recorded from single units in the inferior colliculus of cats deafened as adults six months prior to experimentation (long-term deafened cats, LTDC), and compared neural ITD coding between the three deafness models. The incidence of ITD-sensitive neurons was similar in both groups with normal auditory development (LTDC and ADC), but significantly diminished in DWC. In contrast, both groups that experienced prolonged deafness (LTDC and DWC) had broad distributions of best ITDs around the midline, unlike the more focused distributions biased towards contralateral- leading ITDs present in both ADC and normal- hearing animals. The lack of contralateral bias in LTDC and DWC results in reduced sensitivity to changes in ITD within the natural range. The finding that early onset of deafness more severely degrades neural ITD coding than prolonged duration of deafness argues for the importance of fitting deaf children with sound processors that provide reliable ITD cues at an early age.
Keywords: binaural hearing; congenital deafness; inferior colliculus; cochlear implants; ITD
Introduction
Bilateral cochlear implantation (CI) aims at providing profoundly deaf listeners with the benefits of binaural hearing, including improved sound localization and speech reception in noise. As yet, this promise has been only incompletely realized. Current benefits in sound localization are based primarily on interaural level difference (ILD) cues (van Hoesel, 2004; Seeber and Fastl, 2008; Aronoff et al., 2010) and improvements in speech understanding in noise largely result from attending to the ear with the best signal to noise ratio (van Hoesel and Tyler, 2003; Schleich et al., 2004; Litovsky et al., 2006). Importantly, bilateral CI users receive minimal benefit from interaural time difference (ITD) cues (van Hoesel, 2012), which provide the greatest benefit to normal hearing listeners in everyday situations (Bronkhorst and Plomp, 1992; Zurek, 1992; Macpherson and Middlebrooks, 2002).
The ability to utilize ITD information with bilateral CI seems to be dependent on both the age at onset of deafness and the duration of deafness prior to implantation. Bilateral CI users who were implanted as adults can lateralize electric pulse trains based on ITD if they lost hearing in late childhood or later, but not if they lost hearing earlier in life (Litovsky et al., 2010). Most congenitally deaf children who use their implants daily do not learn to lateralize based on ITD, even though they do lateralize based on ILD (Salloum et al., 2010). Animal models of bilateral CI show parallel deficits in ITD coding by inferior colliculus (IC) and auditory cortex neurons (Tillein et al., 2009; Hancock et al., 2010). Bilaterally- implanted cats acutely deafened as adults show a high incidence of IC neurons sensitive to ITDs of electric pulse trains, and the ITD tuning of these neurons is as precise as in normal-hearing, acoustically-stimulated cats (Smith and Delgutte, 2007). In contrast, neural ITD coding with bilateral CI is severely degraded in congenitally deaf white cats, where fewer neurons are ITD sensitive (Hancock et al. 2010). Furthermore, in both IC and auditory cortex of congenitally deaf cats, best ITDs of sensitive neurons are broadly distributed around the midline, lacking the bias for contralateral- leading ITDs observed in normal- hearing and acutely-deafened cats (Tillein et al., 2009; Hancock et al., 2010).
The degradation in neural ITD coding with bilateral CI observed in congenitally deaf cats compared to cats with normal auditory development could occur either because the early-onset deafness blocks experience-dependent maturational processes during a sensitive period for the
development of binaural circuits, or because the subsequent prolonged period of auditory deprivation causes degenerative changes in binaural circuits, or both. A better understanding of the relative importance of the early onset of deafness and the prolonged duration of deafness on ITD sensitivity would be valuable for guiding the treatment and rehabilitation of profoundly deaf subjects using bilateral CI, especially those who lose hearing in infancy.
We addressed these questions by comparing neural ITD coding in IC between three deafness models: adult cats deafened shortly before neural recordings, adult cats deaf for 6 months prior to neural recordings, and congenitally deaf cats. The results suggest that congenital deafness causes more severe degradations in neural ITD coding than prolonged, adult-onset deafness: while both forms of deafness decrease the sharpness of ITD tuning and spread the distribution of best ITDs across the neural population, congenital deafness additionally decreases the incidence of ITD sensitivity among IC neurons.
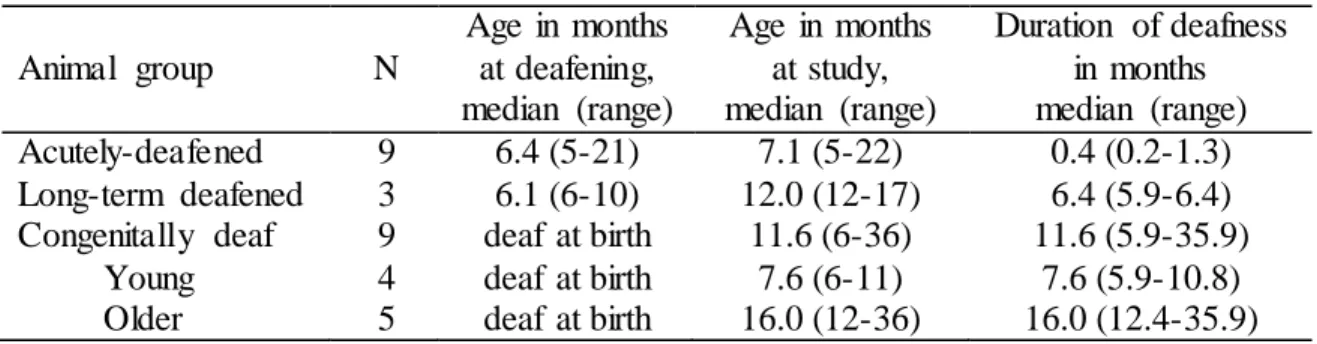
Methods
Experiments were performed on 21 anesthetized adult cats of either sex, who received cochlear implants bilaterally at the time of experimentation. The cats comprised three groups differing in onset-age and duration of deafness: acutely-deafened cats (ADC, deaf 1-2 weeks, N=9), long-term, adult-deafened cats (LTDC, deaf ~6 months, N=3), and congenitally deaf white cats (DWC, deaf from birth, N=9). The DWC were provided by Dr. David Ryugo of Johns Hopkins University. These groups model some of the variability in normal hearing experience across human CI users. Table 1 summarizes the age at deafening, age at time of experimentation, and duration of deafness for each group. Seven of the 9 DWC and 4 of the 9 ADC were included in a previous report (Hancock and Delgutte, 2010). This paper presents additional data and analyses from these 11 animals, as well as data from 10 new animals, including the 3 LTDC. All procedures were approved by the animal care and use committees of the Massachusetts Eye & Ear Infirmary and the Massachusetts Institute of Technology.
Deafening procedures
Cats in the ADC and LTDC groups were deafened by co-administration of kanamycin (300 mg/kg, s.c.) and ethacrynic acid (25 mg/kg, i.v.) while under ketamine anesthesia (33 mg/kg, i.m.) (Xu et al., 1993). Deafness in LTDC was verified one week after deafening by the absence of auditory brainstem responses (ABRs) to 100-μs clicks for intensities up to 100 dB peak SPL (see Hancock et al. 2010 for ABR methods). Deafness in ADC was verified using ABRs at the time of the neurophysiology experiment, about one week after deafening.
There is significant variation among white cats with respect to cochlear pathology and degree of deafness (Heid et al., 1998; Ryugo et al., 1998; Ryugo et al., 2003). Therefore, deafness in this group was verified in the laboratory of Dr. David Ryugo at 4 and 8 postnatal weeks using tone- and click-evoked ABR measurements (Ryugo et al., 2003).
Surgery and cochlear implantation
For electrophysiological recordings, all surgical and experimental procedures were performed under anesthesia, either single injections of Dial- in-urethane (75 mg/kg diallylbarbituric acid + 300 mg/kg urethane, i.p.) or separate injections of Nembutal (37 mg/kg,
i.p.) and urethane (300 mg/kg, i.p.). Supplemental doses (~10% of initial dose) were given as needed to maintain areflexia to strong toe pinches. Dexamethasone (0.2 ml, i.m.) was given every 4 hours to minimize brain swelling, and the trachea was cannulated to maintain airway patency. Body temperature was maintained at 37ºC using a feedback-controlled heating blanket. Heart rate, respiration rate, and expired CO2 were monitored continuously throughout the experiment.
The lateral and dorsal aspects of the skull were exposed by reflecting the overlying tissue, and the pinnae were transected to facilitate placement of closed acoustic systems for measuring acoustic ABRs. O n each side, the tympanic bulla was opened and a cochlear implant with 8 ring-type contacts (Cochlear Ltd., 0.75 mm spacing between contacts) was inserted through a small cochleostomy near the round window. Successful implantation was verified by measuring the threshold of electrically-evoked ABR (EABR) to 50-μs biphasic pulses presented to each ear individually (Hancock et al., 2010). Finally, an opening was made in the skull, then the dorsal surface of the IC was exposed by aspirating the overlying occipital cortex and removing a portion of the bony tentorium.
Stimuli
Stimuli were usually 300- ms periodic trains of biphasic pulses (50-µs/phase, cathodic leading) presented every 600 ms, and with pulse rates ranging from 20 to 1280 pulses-per-second (pps). In a few neurons with strongly adapting responses, we used 10-pps pulse trains lasting 1 s and presented every 1.5 s. The stimuli were digitally synthesized at a sampling rate of 100 kHz, generated using 16-bit D/A converters (National Instruments PXI-6221) and delivered to each cochlear implant through a pair of custom built, wide bandwidth, isolated current sources. Stimulation was between the most apical and most basal intracochlear electrodes in the array (separation = 5.25 mm). This wide bipolar electrode configuration allows stimulation of auditory- nerve fibers innervating the entire length of the cochlea while minimizing stimulus artifacts relative to monopolar stimulation (Litvak et al., 2001).
Single-unit recording from IC
Recordings were made from well- isolated single units using 16-site silicon electrode arrays (Neuronexus, 177-µm2 sites, 150-µm separation). The electrode was advanced dorsoventrally
into the IC to a maximum depth of 4.5 mm. Particular attention was paid to sampling the same central region of the IC in all animals, where ITD-sensitive units are most likely to be found. In most experiments, signals from the recording electrode were acquired with a unity gain headstage (TDT), preamplified (TDT RA16), then filtered (300-3000 Hz) and amplified using a digital signal processor (TDT Medusa). In the last seven experiments (2 DWC & 5 ADC), electrode signals were acquired with a unity gain headstage (Plexon HST/16o50), then filtered (100-8000 Hz) and amplified using an analog amplifier (Plexon PBX2) that provided an improved signal-to- noise ratio over the earlier system. The recording was typically made differentially between adjacent electrodes in the array in order to minimize the amplitudes of stimulus artifacts and local field potentials. The conditioned signals were sampled at 100 kHz using a high-speed A/D converter (National Instruments PXI-6123). Artifact cancellation and spike detection were performed online using custom software. In most experiments, stimulus artifact was cancelled by zeroing the electrode signal for a short interval (300-500 µs) following each stimulus pulse. Spikes were detected when the gated signal crossed a user-set threshold. In later experiments (1 DWC & 3 ADC), we used a gate-and- interpolate technique for artifact cancellation (Heffer and Fallon, 2008); this technique improves the accuracy of estimated threshold-crossing times when the artifact gate occurs during the rising phase of a spike, but does not alter spike counts over simple gating.
Upon isolating a single unit, we first measured responses to a sequence of 3 pulses separated by 100- ms intervals as a function of stimulus level (varied in 1 or 2 dB steps) in order to determine the threshold to each pulse. The first pulse in the sequence was presented diotically (ITD=0), the second one monaurally to the contralateral ear, and the third one to the ipsilateral ear. A sigmoid (cumulative Gaussian) was fit to the resulting spike rate vs. level curves to measure threshold (10% of maximum driven rate) and dynamic range (level range corresponding to 10%-90% maximum driven rate) (Shepherd et al., 1999).
Spontaneous activity was usually characterized by counting spikes during a 30-s period without stimulation. When that measurement was omitted, spontaneous rate was computed by counting the spikes that occurred at subthreshold levels during measurements of single-pulse thresholds.
Neural ITD sensitivity was characterized with low-rate (10-80 pps) pulse trains at 1-4 dB above the single-pulse diotic threshold. If necessary, the pulse rate and the stimulus level were
adjusted in an effort to maximize ITD sensitivity. ITD sensitivity was characterized by varying ITD from –2000 µs to +2000 µs in 200-µs steps, where contralateral-leading ITDs are positive. ITD was selected randomly on each stimulus presentation, and each ITD was presented 8-12 times. This measurement was repeated at multiple stimulus levels, as time permitted. In the vast majority of cases, the interaural level difference (ILD) was set at 0 dB. In cases when EABR thresholds differed by >4 dB between the ears (presumably due to differences in the quality of electrode insertion), an ILD of 2-4 dB was applied to compensate for these threshold differences. This was done in no more than 10% of the neurons tested.
In most neurons, responses to periodic pulse trains presented binaurally (ITD=0, same level and ILD as for measurements of ITD sensitivity) were also measured as a function of pulse rate (from 20 to 1280 pps in approximately half-octave steps) to characterize the temporal coding of pulse rate and test whether temporal coding correlates with ITD coding. Pulse rate was selected randomly on each stimulus trial, and each rate was presented 8-12 times.
Data analysis ITD sensitivity
ITD tuning curves were obtained by computing steady-state firing rates for each ITD, excluding spikes occurring within the first 15 ms after the stimulus onset. We used an analysis-of- variance metric to characterize ITD sensitivity independently of the shapes of the ITD tuning curves (Hancock et al. 2010). This metric is derived from the raw spike counts (firing rates) for each ITD and each stimulus trial. Specifically, the “ITD signal to total variance ratio (STVR)” is defined as the ratio of the variance in firing rates attributable to changes in ITD to the total variance in firing rates. The latter can be expressed as the sum of the variance attributable to variations in ITD plus the variance across stimulus trials for each ITD (the “neural noise”). This metric captures the degree to which the variation in rate caused by changes in ITD dominates the variability in rate that occurs over multiple repetitions of a stimulus. It ranges between 0 for a flat rate-ITD curve, to 1, indicating perfectly reliable ITD coding across trials. Neural responses were said to be ITD sensitive when the ITD STVR was significantly greater than zero (F test, p < 0.025).
For neurons with significant ITD STVRs, the shapes of ITD tuning curves were categorized using four templates (Smith and Delgutte, 2007): peak (positive- going Gaussian), trough
(negative-going Gaussian), biphasic (difference of two Gaussians), or sigmoidal (cumulative Gaussian). The data were fit to each of the four templates using the MATLAB function
lsqcurvefit (The Mathworks, Natick MA). Each rate-ITD curve was assigned the category whose
template yielded the smallest sum-of-squared errors. Although in rare instances good fits could be obtained with more than one template (e.g. peak and sigmoidal shapes for neurons with a large best ITD), these templates capture well the variety of observed tuning curve shapes and are thus useful for comparing across deafness groups, as well as to previous studies (Smith and Delgutte, 2007; Tillein et al., 2009; Hancock et al., 2010). The fitted curves were used to compute metrics that characterize ITD tuning (see Results).
Temporal discharge patterns
Temporal response patterns to low-rate (10 or 20 pps) pulse trains were characterized using period histograms computed from the same data used to obtain ITD tuning curves. For each ITD, spike times relative to the onset of the preceding stimulus pulse were binned with 0.5- ms resolution. The first pulse cycle in each 300- ms train was excluded from the analysis. Period histograms for a range of ITDs were pooled (i.e. added together) to obtain enough spikes for quantification of the temporal discharge pattern. Period histograms were only pooled across ITDs for which the mean first spike latency was within a small tolerance (2.5%) of the median latency across all ITDs. This selection procedure ensured that pooling did not smear the temporal discharge pattern.
Period histograms exhibited either a precisely- timed early response (<25 ms latency), or a poorly-timed late response (>25 ms), or both. These components were quantified by fitting each period histogram with a sum of two Gaussian functions with different latencies. The mean latencies were constrained to nonoverlapping intervals (<25 ms and >25ms) to capture the early and late responses, respectively. A response component (i.e. early or late) was judged to be present if the area under the corresponding Gaussian contained at least 20 spikes. The latencies of the early and late components always differed sufficiently that the distinction was not blurred by the pooling of responses across ITDs.
Pulse-locking limits
To characterize temporal coding of pulse trains as a function of pulse rate, synchrony between neural spikes and was quantified using correlation (Fig. 9). [We used
correlation rather than the more traditional period histogram so that the analysis would also apply to pulse trains with random jitter in the timing of stimulus pulses. Responses to jittered pulse trains were measured in some of our neurons, but these results are reported elsewhere (Hancock et al. 2012).] A cross-correlation histogram was constructed by tallying the intervals between each stimulus pulse and every subsequent neural spike using a 0.2 ms bin width up to a maximum delay of 25 ms. Properly scaled, a cross-correlogram represents the average firing rate as a function of time, given a stimulus pulse occurs at the time origin. Perfectly pulse- locked responses would yield a single nonzero bin at the spike latency, while completely unsynchronized responses would produce a flat cross-correlogram. Intermediate degrees of synchrony produce cross-correlogram peaks of variable height and width.
Confidence bounds were computed by Monte Carlo simulation for each cross-correlogram to assess whether its shape deviated significantly from that expected for a random spike train. The histogram computation was repeated for 1000 random spike trains where the spike counts matched the number of spikes in the actual neural response. Synthetic spike times were drawn randomly from a uniform distribution, but excluding the 0.3-0.5 ms stimulus-artifact gating window following each stimulus pulse during which spikes cannot be detected. The confidence bound, r95[k], on each bin k was the 95th percentile of these synthetic cross-correlograms (gray shading, Fig. 9). To quantify the degree of synchrony, we computed the normalized height of the cross-correlogram in each bin relative to the corresponding 95% confidence bound:
[ ] [ ]
[ ]
95[ ]
95 norm r k r k r k r k − = Eq. 1A neuron’s response was regarded as significantly pulse-locked when the cross-correlogram contained a peak exceeding the confidence bound (rnorm > 0) for two consecutive bins. In practice, only short latency responses (see Temporal discharge patterns) were sufficiently well-timed to yield cross-correlation peaks that met this criterion. To define the upper limit of pulse locking, linear interpolation was used to find the pulse rate where rnorm crossed zero in the negative- going direction.
Results
To identify the relative contributions of early-onset deafness and prolonged duration of deafness to degraded neural ITD coding with bilateral CI, we recorded from 119 IC neurons in 3 long-term, adult-deafened cats and compared these responses to both new and previously reported (Hancock et al, 2010) data from acutely-deafened cats and congenitally deaf white cats. Specifically, we recorded from an additional 78 neurons in 4 acutely-deafened cats (bringing the total to 177 neurons in 9 ADC) and an additional 25 neurons in 2 congenitally deaf cats (139 total in 9 DWC). In general, neural ITD sensitivity in all three deafness groups varied widely across neurons. The groups differed in the proportion of neurons that were ITD sensitive, and in the distribution of ITD tuning properties across the population. We also present new analyses testing whether ITD sensitivity correlates with other response properties such as spontaneous activity and temporal coding in order to gain insight into the mechanisms underlying the differences in ITD sensitivity between the three deafness groups.
Incidence of ITD sensitivity
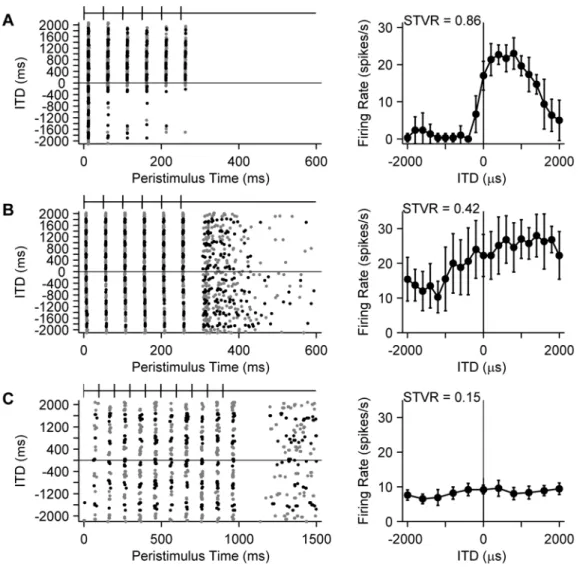
Figure 1 shows responses of three neurons from long-term deafened cats to low-rate pulse trains (10 or 20 pps), illustrating ITD sensitivity that ranges from good to poor (A-C, respectively). The neuron in Fig. 1A fires tightly pulse- locked spikes to the 20-pps pulse train, and its firing rate is strongly modulated by ITD. The rate-ITD curve (which excludes the onset response) is peak-shaped with a best ITD around +500 µs (contralateral-leading). The large ITD STVR reflects both the deep modulation of firing rate with ITD and the high consistency of the response from trial to trial. The neuron in Fig. 1B also exhibits pulse- locked spikes, but in contrast has a conspicuous offset response following the pulse train which persists for more than 100 ms. The rate-ITD curve has a shallow sigmoidal shape which generally favors contralateral-leading ITDs, and the variability in firing rate across stimulus trials is substantial (compare error bars with Fig. 1A), resulting in a moderate ITD STVR. Finally, the example unit in Fig. 1C showed strongly adapting responses to a 20-pps pulse train and so was studied with a 10 pps pulse train (note the different time scale compared to Fig. 1A and 1B). This unit exhibits long latency responses (the first spike generally occurs almost 100 ms after the first stimulus pulse) with considerable jitter in the timing of the response to each pulse. In addition, the neuron shows spontaneous activity that is suppressed for more than 200 ms following the end of the pulse train.
The rate-ITD curve is nearly flat and the variations in rate with ITD are smaller than the trial-to-trial variations in spike count, resulting in an ITD STVR that does not differ significantly from zero.
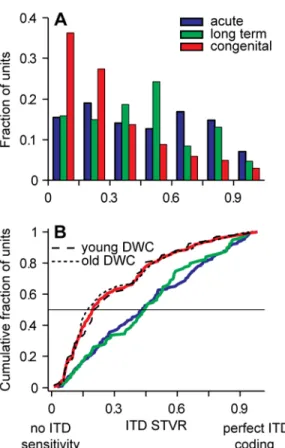
Figure 2 compares the distribution of ITD STVR across neurons for each of the three deafness groups. Table 2 lists the corresponding median ITD STVRs and the percentage of neurons for which the STVR was significantly greater than zero. When ITD tuning curves were measured from the same neuron for different pulse rates and/or stimulus levels, we chose the stimulus condition yielding the highest ITD STVR for inclusion in Fig. 2 and Table 2. O verall, there was a highly significant effect of deafness group on neural ITD sensitivity (Kruskal-Wallis test, p<0.001). Importantly, however, ITD sensitivity was quite similar between long-term and acutely-deafened cats. In both groups, ITD STVR was approximately uniformly distributed from 0 (meaning no sensitivity) to 1 (meaning highly-reliable ITD coding) (Fig. 2A). This similarity between the two adult-deafened groups is especially clear in the cumulative distributions in Fig. 2B. The median ITD STVR was essentially the same in the two groups (0.44 for ADC vs. 0.43 for LTDC), and the percentage of ITD-sensitive units was only slightly larger in ADC than in LTDC (80% vs. 71%). In contrast, ITD STVR was strongly biased toward low values in congenitally deaf cats (median = 0.20) with only 53% of neurons being ITD-sensitive. Post-hoc tests using Bonferroni corrections confirm that the ITD STVR was significantly lower in the congenitally deaf group compared to each of the other two groups, whereas there was no difference between ADC and LTDC.
Interpretation of the effect of congenital deafness on the prevalence of ITD sensitivity is complicated by variability within the congenitally deaf group with respect to age and therefore duration of deafness. Not only were the DWC deaf from birth, but they were on average deaf ~5 months longer than the LTDC (Table 1). Thus, is it the earlier onset or the longer duration of deafness that underlies diminished ITD sensitivity in DWC compared to LTDC? We addressed this question by taking advantage of the large age range within the DWC group. Specifically, we split the DWC into a young group and an older group (Table 1). The median age of the young DWC group (7.6 months) was similar to the median duration of deafness in the LTDC group (6.4 months), largely eliminating duration of deafness as a confound. The cumulative ITD STVR distributions were remarkably similar in the two subgroups of DWC and clearly distinct from the LTDC distribution (Fig. 2B, black curves). The incidence of ITD-sensitive neurons was
comparable between young and old DWC (57% vs. 49%) and the median ITD STVRs were not significantly different (0.21 vs. 0.18; Wilcoxon rank sum test, p=0.83). Most importantly, the median ITD STVR was significantly lower in young DWCs than in LTDC (0.21 vs. 0.44, Wilcoxon rank sum test, p<0.001). Thus, neural ITD sensitivity was significantly impaired even in the younger DWC, for which the duration of deafness was comparable to that in LTDC. This analysis strengthens the conclusion that the decreased prevalence of ITD-sensitivity among IC neurons is a specific consequence of congenital deafness, and is minimally affected by prolonged deafness beginning later in life.
Shapes of ITD tuning curves
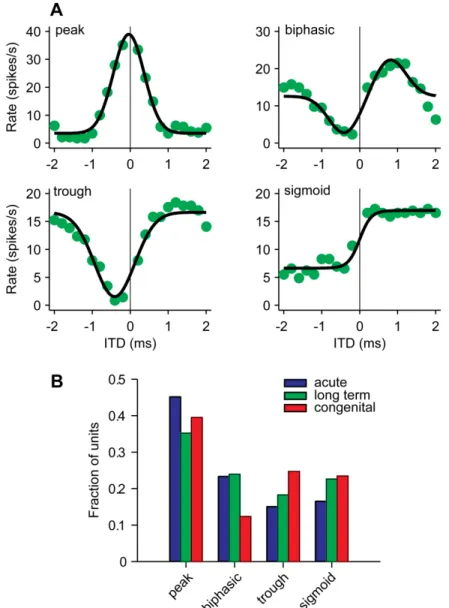
In normal hearing animals, the shapes of ITD tuning curves provide information about the neural mechanisms giving rise to ITD sensitivity: Peak-shaped curves are associated with an excitatory coincidence mechanism in the medial superior olive (MSO), and trough-shaped curves with an excitatory- inhibitory (EI) mechanism in the lateral superior olive (LSO) (Yin and Chan, 1990; Batra et al., 1997; Joris and Yin, 1998). ITD tuning curves with bilateral CI stimulation also vary in shape across IC neurons (Smith et al., 2007) and this variation was observed for all three deafness groups. We categorized rate-ITD curves with significant ITD STVR using the four shapes (peak, trough, biphasic and sigmoid) previously applied to data from bilaterally-implanted cats (Smith and Delgutte, 2007; Hancock et al., 2010). Fig. 3A shows examples of each shape, all drawn from long-term deafened cats. Fig. 3B compares the incidence of each shape across the three deafness groups. Peak-shaped curves are the most common in all three groups. Nevertheless, the three distributions are statistically different (χ2
-test, p<0.01), reflecting a small tendency for LTDC and DWC to have more trough and sigmoid shapes and fewer peak shapes compared to ADC, and for the incidence of biphasic shapes to be lower in DWC than in the other two groups.
Distribution of ITD tuning metrics
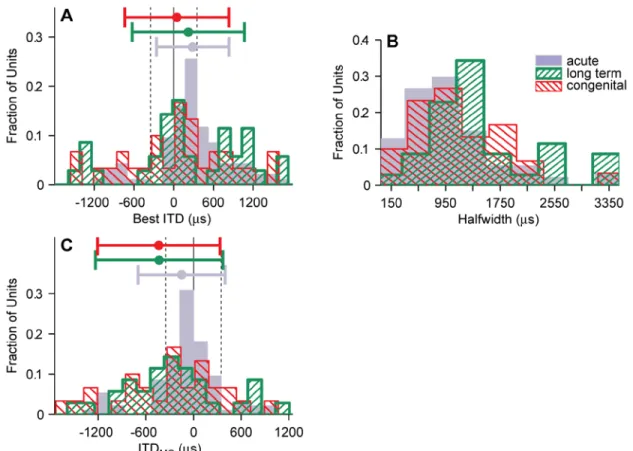
While long-term, adult-onset deafness has minimal impact on the incidence of ITD sensitivity (Fig. 2), ITD tuning is significantly altered in these animals compared to acutely-deafened cats (Fig. 4). Three tuning metrics were computed from the peak-type rate-ITD curves and from the positive-going component of the biphasic rate-ITD curves: the best ITD (corresponding to the maximum firing rate), the halfwidth of ITD tuning (ITD range for which
firing rate is ≥50% of the maximum), and the ITD of maximum slope (ITDM S, the point where firing rate is most sensitive to changes in ITD). Figure 4 compares the distributions of these metrics across the three deafness groups. Summary statistics are given in Table 3.
In acutely-deafened cats, best ITDs of IC neurons were biased toward contralateral- leading values (Fig. 4A) as is the case in normal- hearing animals with acoustic stimulation (K uwada and Yin, 1983; Hancock and Delgutte, 2004; Smith and Delgutte, 2007). In contrast, best ITD distributions in long-term and congenitally-deaf cats were comparatively broad and lacked a clear contralateral bias (Fig. 4A). In the acutely-deafened cats, the mean best ITD was 288 µs, which is significantly greater than zero [i.e. contralaterally-biased] (t-test, p<0.001). In long-term deafened cats, the mean best ITD was only slightly smaller (222 µs), but because the distribution is so broad, this does not quite represent a significant contralateral bias (t-test, p = 0.065). A lack of contralateral bias is especially clear in the congenitally deaf cats (mean best ITD = 47 µs; t-test: p=0.37). The best ITD distributions were significantly broader in both groups that experienced prolonged deafness compared to acutely-deafened cats (Levene’s test on the variance, p<0.01 for both comparisons). The best ITD distributions did not differ between LTDC and DWC with respect to either mean (t-test, p=0.39) or variance (Levene’s test, p=0.62).
Halfwidths of ITD tuning tended to be narrowest in acutely-deafened cats, broader in congenitally deaf cats, and unexpectedly, broadest in long-term deafened cats (Fig. 4B). O verall, there was a significant effect of deafness group on the halfwidth distributions (Kruskal-Wallis test, p<0.01). Pairwise comparisons show a significant difference in median halfwidths between LTDC and the other two groups (Wilcoxon rank sum test, p<0.05 or lower) but not between ADC and DWC (p=0.36).
Best ITD and halfwidth interact to determine the ITD where firing rate varies most with incremental changes in ITD (ITD at maximum slope, ITDM S). Consistent with the pronounced contralateral bias and relatively sharp tuning in acutely-deafened cats, the ITDM S in that group tended to occur near the midline with the majority falling within the naturally-occurring range of ITDs for the cat (Fig. 4C). This pattern is similar to that observed in the IC of normal-hearing animals (McAlpine et al., 2001; Hancock and Delgutte, 2004; Joris et al., 2006). In contrast, ITDMS were more broadly distributed in the other two deafness groups, with fewer than half
falling in the natural range (Fig. 4C). There was a significant effect of deafness group on the proportion of neurons for which ITDMS falls within the natural ITD range (χ2
-test, p<0.001). Overall, our results show that prolonged deafness, regardless of onset time, causes neural ITD tuning to disperse across the ITD-axis, eventually obscuring the contralateral bias which is a hallmark of ITD coding in normal- hearing animals and ensures that maximum sensitivity to changes in ITD occurs within the natural range (K uwada and Yin, 1983; McAlpine et al., 2001; Hancock and Delgutte, 2004; Joris et al., 2006; Smith and Delgutte, 2007).
Functional consequences of the differences in ITD coding
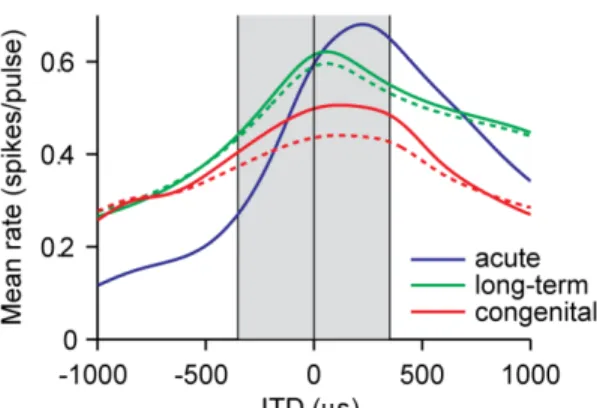
Fig. 5 shows the average ITD tuning curves over the population of ITD-sensitive units for each of the three deafness group. Together with its mirror image from the opposite IC, this average tuning curve is the information on which lateralization judgments are based in “two-channel” models of sound localization, which compare the summed neural activity on both sides of the brain (e.g. van Bergeijk, 1962; McAlpine et al., 2001; Stecker et al., 2005; Devore et al., 2009). Here, we use the two-channel concept as a qualitative means of assessing the relative effect of each deafness model on ITD perception. Assuming that the variance of firing rates across stimulus trials is not strongly affected by deafness, ITD discrimination performance in two-channel models is proportional to the slope of the average tuning curve. Acutely deafened cats have the steepest slopes near the midline (meaning better performance) because they have a comparatively focused distribution of best ITDs with a pronounced contralateral bias and relatively narrow halfwidths (meaning individual ITD tuning curves have steep slopes). In long-term deafened cats, the slopes of the average tuning curve are shallower, and flat near the midline, because the best ITD distribution is broader and halfwidths of ITD tuning are wider. Slopes are shallowest in congenitally deaf cats because the best ITD distribution is very broad and centered at the midline.
The average ITD tuning curves shown by solid lines in Fig. 5 include only ITD-sensitive units (based on STVR) and do not reflect the decreased incidence of ITD sensitivity in congenitally deaf cats. If insensitive units are included in the average (dashed lines), the average ITD tuning curve for congenitally deaf cats becomes even more compressed, further reducing the slopes and making the predicted reduction in discrimination performance for DWC relative to the other two groups even more dramatic. Thus, the combination of decreased incidence of ITD
sensitivity and changes in ITD tuning properties observed in congenitally deaf cats predicts a more severe degradation in ITD acuity than the more limited changes occurring in long-term deafened cats.
Effect of stimulus level on ITD coding
In acutely-deafened cats, one of the factors affecting ITD coding with bilateral CI is the limited dynamic range over which IC neurons are sensitive to ITD (Smith and Delgutte, 2007). As a preliminary step towards comparing the dynamic range of ITD sensitivity for the three deafness group, we first characterized the level dependence of rate responses to single pulses (see Methods). In all three deafness groups, thresholds for single pulses delivered to the contralateral ear varied widely across neurons, with 90% between –12 and +2 dB re 1 mA (0.25 to 1.25 mA). Thresholds were lowest in DWC (mean = –6.0 dB re. 1 mA), higher in ADC (–4.7 dB) and highest in LTDC (–2.6 dB). While these threshold differences between groups are statistically significant (ANOVA, p=0.01), they are hard to interpret because they are comparable in magnitude to EABR threshold differences across animals within each deafness group and between ears in the same animal, suggesting an effect of variability in quality of electrode insertion. In contrast to thresholds, the three deafness groups did not differ in the dynamic range of rate responses to single pulses (ANOVA, p=0.97), which averaged ~3 dB for all groups (90% between 1 and 8 dB).
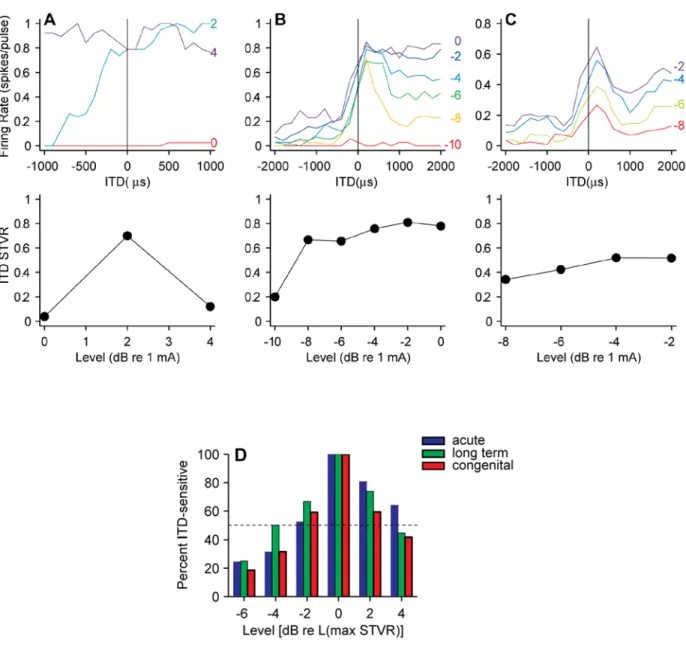
We then compared the dynamic range of ITD coding across the three deafness groups. The ITD tuning curves from three example neurons at the top of Fig. 6 illustrate that the different degrees of robustness to changes in level previously observed in acutely-deafened cats are also present in long-term and congenitally deaf cats. Fig. 6A shows data from a neuron with a very narrow dynamic range. At 0 dB re 1 mA, this neuron showed little or no response to a 40-pps pulse train. At a level 2 dB higher, it showed clear ITD-sensitivity with a sigmoidal tuning curve, but with a further 2 dB increase in level, the response was nearly saturated, yielding a flat rate-ITD curve and a non-significant ITD STVR. In contrast, the neuron in Fig. 6B was ITD sensitive over a range of at least 8 dB. Its rate-ITD curve changed from peak-shaped to sigmoidal as the level increased from –8 dB to 0 dB re. 1 mA, but the ITD STVR remained stable despite these changes in shape. The neuron in Fig. 6C was also ITD sensitive over at least a 6 dB range of levels, but in this case the tuning curve shape was largely maintained across levels and the ITD STVR seemed to improve slightly with increasing level. This degree of shape
stability with changes in stimulus level was comparatively rare. ITD tuning of most neurons in all three deafness groups changed shape in some manner as level increased from threshold to saturation, often changing from peak-shaped to either sigmoidal (as in Fig 6B) or biphasic (Smith and Delgutte, 2007). Changes in shapes of ITD tuning curves with increasing level have also been observed in cortical multi- unit responses in both acutely-deafened and congenitally deaf cats (Tillein et al., 2009).
Figure 6D summarizes the effect of level on ITD sensitivity across the three deafness groups. The histograms show the percentage of neurons for which the ITD STVR was significantly greater than zero (p<0.025) as a function of level relative to the level that yielded the maximum ITD STVR (on average, 3-4 dB above the single-pulse threshold). A neuron was included in the histogram only if ITD tuning curves were measured at three or more stimulus levels and the neuron was ITD sensitive for at least one level. There was no significant difference in the level dependence of the prevalence of ITD sensitivity across the three deafness groups (χ2
-test, p=0.79), consistent with the lack of an effect of deafness group on the dynamic range of single-pulse responses.
Correlation of ITD sensitivity with other response properties
IC neurons in neonatally deaf cats and acutely deafened adult cats differ in several response properties besides ITD coding, including spontaneous firing rate, response latencies, and the maximum pulse rate that evokes pulse- locked discharges (Snyder et al., 1995; Shepherd et al., 1999; Hancock et al., 2010). There is however no information on these response properties in long-term, adult-deafened animals. We therefore compared these response properties across the three deafness groups and also tested for correlations between these properties and ITD sensitivity in the hope of gaining insight into the neural mechanisms underlying the across-group differences in ITD sensitivity.
Spontaneous activity
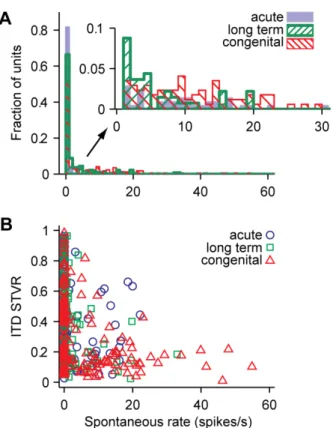
We found a clear effect of deafness group on the distribution of spontaneous activity (Fig. 7A, Table 2). In acutely-deafened cats, only 18% of IC neurons had spontaneous rates >1 spike/s, consistent with the low spontaneous rates observed in the IC of normal-hearing cats with barbiturate anesthesia (Ehret and Merzenich, 1988). The fraction of spontaneously active neurons increased to 34% in long-term deafened cats and to 49% in congenitally deaf cats
(Table 2). The overall effect of deafness group on median spontaneous rate was highly significant (Kruskal-Wallis test, p<0.001). All the pairwise differences were also significant (Wilcoxon rank sum test, p=0.05 or less). Spontaneous rates were significantly higher in older DWC compared to both young DWC and LTDC (Wilcoxon rank sum test, p=0.05 and p=3.7×10⁻⁴, respectively), but not different between young DWC and LTDC (Wilcoxon rank sum test, p=0.30). Regardless of deafness group, neurons with high spontaneous rates tend to have poor ITD sensitivity (Fig. 7B). The converse is not true: poor ITD sensitivity can occur even in the absence of spontaneous activity.
Temporal response patterns to low-rate pulse trains
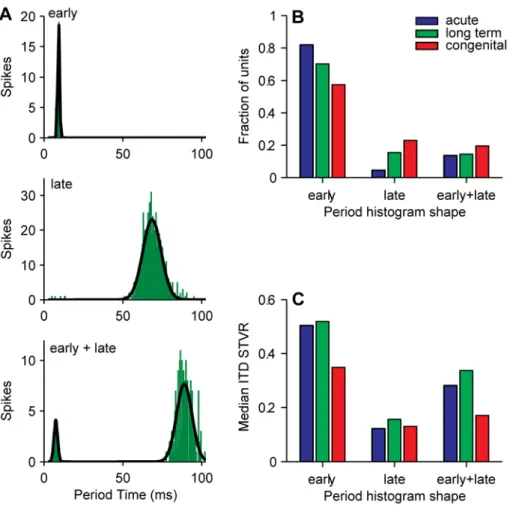
Period histograms were used to characterize the temporal discharge patterns evoked by low-rate pulse trains (Fig. 8). As previously described for acutely-deafened and neonatally deaf cats (Shepherd et al., 1999; Hancock et al., 2010), three general period histogram shapes were observed in all three animal groups. “Early” responses exhibited short latency, tightly pulse-locked spikes (Fig. 1A, Fig. 8A top). “Late” responses were poorly timed and much longer in latency, apparently the result of rebound from inhibition produced by each pulse rather than a direct excitatory response (Fig. 1C, Fig. 8A middle). The third discharge pattern comprised a combination of the early and late responses (Fig. 8A bottom). The fraction of IC neurons exhibiting early responses was greatest in acutely deafened cats, smaller in long-term deafened cats, and smallest in congenitally deaf cats (Fig. 8B). There was a concomitant increase in the number of late responses from acute to long-term to congenital deafness, but the number of mixed responses was roughly constant across deafness groups. The dependence of temporal discharge pattern on deafness group was highly significant (χ2
-test, p<0.001).
There was a strong correlation between median spontaneous rate and discharge pattern (Kruskal-Wallis test, p<0.001). Only ~10% of early-only responding neurons had spontaneous rates >1 spike/s compared to ~70% in both groups showing a late response. Late responses were not simply a return to spontaneous activity following suppression by each stimulus pulse because firing rates during the late response were typically larger than the spontaneous rate. Thus, late responses and spontaneous activity seem to be two manifestations of elevated excitability, both occurring more frequently with longer periods of deafness.
Neural ITD sensitivity was also highly correlated with temporal discharge pattern (Fig. 8C). The median ITD STVR was greatest for early responses and smallest for neurons showing only a late response (Kruskal-Wallis test, p<0.001). Among the early responders, ITD sensitivity was comparatively good for acutely-deafened and long-term deafened cats and poorer for congenitally deaf cats, consistent with the general trend in Fig. 2. Thus, long-term deafened cats fall about halfway between congenitally deaf and acutely deafened cats with respect to the number of IC neurons showing short latency, pulse- locked responses. Interestingly, this has little effect on overall ITD sensitivity in that group.
Upper rate limit of pulse-locking
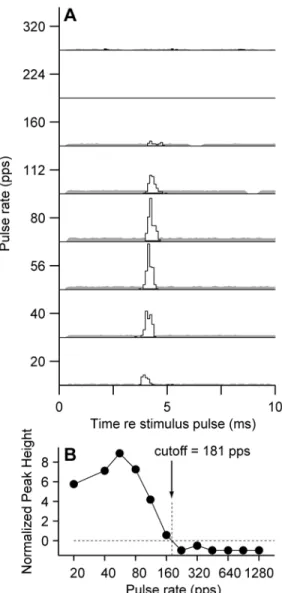
Most IC neurons entrain to low-rate electric pulse trains, but pulse-locking diminishes with increasing pulse rate such that most neurons give only onset responses to pulse trains above 100-200 pps (Snyder et al., 1995; Shepherd et al., 1999; Smith and Delgutte, 100-2007; Middlebrooks and Snyder, 2010; Hancock et al., 2012). The exact pulse rate limit varies across neurons, and is also affected by neonatal deafening and chronic stimulation (Snyder et al., 1995; Vollmer et al., 1999; Vollmer et al., 2005), but there are no published data for long-term, adult-deafened cats. We compared the range of pulse rates over which neurons show pulse- locked responses in the three deafness models and looked for possible correlation with ITD coding. Figure 9 illustrates the cross-correlation based method used to quantify pulse locking and compute a cutoff pulse rate for one example neuron from a LTDC. Each correlogram in Fig. 9A plots, for one pulse rate, the firing rate as a function of time given a stimulus pulse occurs at t=0. For low pulse rates, the correlograms show a sharp peak in firing rate at ~5 ms latency following each stimulus pulse. The peak amplitude grows with increasing pulse rate up to 56 pps and thereafter decreases, with minimal response to pulse rates >160 pps. Fig. 9B shows the normalized height of the correlation peak (relative to the 95% confidence bound for randomly distributed spike trains) as a function of pulse rate. Using linear interpolation, the pulse rate for which the normalized peak height just becomes negative (meaning no significant pulse locking) is found to be 181 pps.
Fig. 10A compares the distributions of pulse- locking limits across the three deafness groups. The fraction of neurons that did not show pulse locking at any rate was greatest in congenitally deaf cats, followed by acutely-deafened cats, and then long-term deafened cats (Fig. 10A, Table 2; χ2
-test, p=0.044). Among neurons that had pulse- locked responses, pulse- locking limits were
lowest in congenitally deaf cats but comparable in acutely-deafened and long-term deafened cats, as clearly shown by the cumulative distributions in Fig. 10B. The median pulse locking cutoff was 74 pps in acutely deafened cats, 76 pps in long-term deafened cats, and 56 pps in congenitally deaf cats. The effect of deafness group on median pulse locking cutoff was weakly significant (p=0.04, Kruskal-Wallis test). The large difference in median cutoffs between young and older DWC (Table 2) suggests that ongoing deafness may continue to degrade pulse locking, although the difference was not significant due to scatter in the data. These values are somewhat lower than those reported in previous studies of temporal coding with CI in acutely deafened and neonatally deafened cats (Snyder et al., 1995; Vollmer et al., 1999; Middlebrooks and Snyder, 2010). Our pulse locking criterion based on cross-correlation is more stringent than the Rayleigh test criterion used in most previous studies because it requires spikes to occur within a narrow temporal window following a stimulus pulse, while the Rayleigh test includes all spikes regardless of their time of occurrence.
There was no correlation between pulse locking limits and ITD sensitivity for any of the three deafness groups (Fig. 10C). In other words, an IC neuron that is capable of temporal coding up to relatively high pulse rates is not more likely to show good ITD sensitivity at the low pulse rates (10-80 pps) we used to characterize ITD coding. This dissociation between ITD sensitivity and temporal coding, which is also observed for pure-tone stimulation in normal hearing animals (K uwada et al., 1984; K uwada et al., 1987), is consistent with the fact that the IC is not the primary site of binaural interaction where ITD sensitivity first arises (Batra and Yin, 2004), and suggests that pulse locking in the IC is limited by processing at sites beyond the primary binaural neurons in MSO and LSO.
Discussion
Effects of onset age of deafness and duration of deafness on ITD sensitivity
Previous studies of IC and auditory cortex have demonstrated that congenital deafness degrades neural ITD coding in cats with bilateral CI compared to acutely-deafened cats with normal auditory development (Tillein et al., 2009; Hancock et al., 2010). These changes represent the combined effects of auditory deprivation on maturational processes during the formative neonatal period and possible degenerative processes during the subsequent prolonged period of deafness. As a first step towards assessing the relative importance of each effect, we characterized the responses of IC neurons to bilateral CI stimulation in adult cats deafened six months prior to study. Response properties in these long-term deafened cats were generally intermediate between those in acutely-deafened and congenitally deaf cats. Long-term deafened cats were similar to acutely-deafened cats in their high incidence of ITD-sensitive neurons and high pulse locking limits. In contrast, long-term deafened cats were similar to congenitally deaf cats in their broad distributions of best ITDs lacking a contralateral bias. Finally, long-term deafened cats fell in between ADC and DWC with respect to spontaneous firing rate and the incidence of late responses.
The finding that the effects of deafness are more subtle in long-term, adult-deafened cats than in congenitally deaf cats suggest that the severe degradations in ITD coding observed in deaf white cats result primarily from the early onset of deafness rather than the prolonged duration of deafness. A caveat is that variability in the chronological ages of the DWC (Table 1) might confound the effects of onset age and duration of deafness on the observed differences in neural ITD sensitivity between DWC and LTDC. However, ITD sensitivity in the long-term deafened cats was still better when compared to the young subgroup of DWC that roughly matched the LTDC group in duration of deafness (Fig. 2B and Table 2). Moreover, there was no difference between young and older DWC in the incidence of ITD sensitivity, suggesting that duration of deafness has no effect on this specific response property in DWC. These findings strengthen the conclusion that it is specifically the early onset of deafness that causes the decreased incidence of neural ITD sensitivity in the congenitally deaf cats. This conclusion is consistent with numerous studies showing more dramatic effects of sensorineural hearing loss on the central auditory system if it occurs prior to a sensitive developmental period (see reviews by
Hardie, 1998; Sharma and Dorman, 2006; Kral and Eggermont, 2007; Sanes and Bao, 2009; Kral and Sharma, 2012).
Nevertheless, effects of other differences across deafness groups cannot be ruled out. For example, genetic mutations in deaf white cats could have a direct effect on the function of binaural neurons in addition to those induced by deprivation of peripheral auditory inputs. Moreover, the ototoxic drugs used for deafening the LTDC could have direct neurotoxic effects on peripheral and central auditory neurons in addition to their effect on hair cells that are the proximal cause of deafness (Leake and Hradek, 1988; Ryugo et al., 2010). Further studies using a variety of deafness models are needed to fully understand the relative importance of onset age of deafness and duration of deafness on binaural processing.
Effect of deafness and auditory experience on ITD tuning in brainstem neurons
In congenitally-deaf and long-term deafened cats, the distribution of best ITDs was spread out and lacked the strong contralateral bias observed in both normal- hearing animals (McAlpine et al., 2001; Hancock and Delgutte, 2004; Joris et al., 2006) and acutely deafened cats (Smith and Delgutte, 2007). This finding suggests that auditory experience is necessary not only for the development of this contralateral bias (Kapfer et al., 2002; Seidl and Grothe, 2005) but also for its maintenance during adulthood.
The observed effects of deafness on best ITD distributions in the IC have parallels in studies of normal- hearing animals showing that abnormal sensory experience during development can alter neural ITD tuning at subcortical levels. In neonatal gerbils raised in omnidirectional noise for two weeks, the best ITD distribution in the dorsal nucleus of the lateral lemniscus (DNLL) is abnormally broad and lacks a contralateral bias (Seidl and Grothe, 2005), similar to our observations from congenitally deaf cats. Seidl and Grothe give no information on the incidence of ITD sensitivity which is sharply reduced in congenitally deaf cats. In young barn owls raised with either prisms that displace the visual field laterally or acoustic devices that distort binaural cues, the neural maps of ITD in the optic tectum and the external nucleus of the inferior colliculus are systematically shifted compared to the maps in animals reared with normal auditory and visual inputs (Knudsen and Brainard, 1991; Brainard and Knudsen, 1993; Gold and Knudsen, 2000b, a).
Consistent with our findings in long-term, adult-deafened animals, abnormal sensory experience can also have an effect on neural ITD coding in adult animals with normal hearing,
although the effects are weaker than in juvenile animals. The reorganization in neural ITD maps in barn owls is greatly reduced if exposure to prisms occurs after about 200 days postnatal (Brainard and K nudsen, 1998), although even in adult animals, map reorganization can be induced by allowing owls to hunt for prey while wearing the prisms (Bergan et al., 2005). Exposing adult gerbils to omnidirectional noise appears to alter the distribution of best ITDs in DNLL (Siveke et al., 2012), but the shifts are in the opposite direction (away from the midline) from those observed in both noise-exposed juvenile gerbils and our long-term adult-deafened cats, and there is no broadening of the best ITD distribution in adult gerbils. Unlike our deafening protocol, omnidirectional noise may not completely mask environmental ITD cues.
Overall, the results from normal- hearing gerbils and owls and our results from deaf cats concur that the neural code for ITD remains plastic and sensitive to auditory experience well into adulthood. Importantly, the altered ITD tuning induced by abnormal sensory inputs are reversed after animals are returned to a normal environment (Brainard and K nudsen, 1998; Siveke et al., 2012), suggesting that appropriate experience with bilateral CIs might also restore normal ITD tuning in deaf animals.
Not only the distribution of best ITDs, but also the shapes of ITD tuning curves differed significantly in the three deafness groups (Fig. 3). In normal-hearing animals, the shapes of ITD tuning curves are informative about the neural mechanisms giving rise to ITD sensitivity: Peak-type curves are associated with excitatory coincidence detection in MSO, while trough-Peak-type curves are associated with an EI mechanism in LSO. Thus, our results raise the possibility that deafness may have a differential impact on the mechanisms leading to ITD sensitivity. However, an association between shapes of ITD tuning curves and underlying binaural mechanisms is not firmly established for deaf animals, and the finding that the shapes of ITD tuning curves typically change with stimulus level in deaf animals suggest that the association may not be simple. A definite interpretation of the differences between deafness group in terms of underlying mechanisms must await further data comparing ITD tuning curve shapes measured from the same neurons with both acoustic and electric stimulation, as is possible with either round-window or intraneural stimulation (Vollmer et al., 2009; Middlebrooks and Snyder, 2010).
Effect of deafness on spontaneous activity
The fraction of IC neurons with spontaneous firing rates above 1 spike/s was highest in congenitally deaf cats, and also elevated in long-term deafened cats compared to
deafened cats (Fig. 7 and Table 2). Interestingly, spontaneous activity was elevated in older DWC compared to both young DWC and LTDC, but was similar between young DWC and LTDC, for which the duration of deafness was also similar. Thus, it appears that spontaneous activity increases with duration of deafness but depends minimally on onset age of deafness, in contrast to the degraded ITD sensitivity described above, for which onset age was the dominant factor.
Multiunit spontaneous activity has also been found to be elevated in the auditory cortex of congenitally deaf cats compared to normal- hearing cats (Kral et al., 2003). Spontaneous activity in the IC is also elevated following acoustic trauma that leads to tinnitus-like symptoms (Ma et al., 2006; Mulders and Robertson, 2009; Manzoor et al., 2012). The elevated activity occurs specifically in areas corresponding tonotopically to regions of the cochlea where the traumatizing narrowband sounds produce permanent threshold shifts, and so is closely associated with a loss of normal peripheral function, as is also the case with the elevated spontaneous activity in LTDC and DWC. A caveat is that many of these studies (including the present one) were done in barbiturate-anesthetized animals, where the level of spontaneous activity tends to be substantially depressed (K uwada et al., 1989). Ongoing studies in our laboratory using an awake rabbit preparation (Chung et al., 2013) show much higher spontaneous activity in deaf rabbits compared to anesthetized ADC and LTDC.
Can chronic electric stimulation reverse degraded ITD coding?
Both congenital deafness and neonatal deafening cause structural abnormalities in the brainstem circuits that process ITD, including the endbulbs of Held in ventral cochlear nucleus (Ryugo et al., 1997; Ryugo et al., 1998; Lee et al., 2003; Ryugo et al., 2010) and inhibitory synapses onto MSO neurons (Tirko and Ryugo, 2012). Chronic diotic stimulation using clinical CI processors largely reverses these changes (O'Neil et al., 2010; Tirko and Ryugo, 2012). In the cat IC, neonatal deafening degrades pulse- locking limits to unilateral CI stimulation compared to acutely deafened cats (Snyder et al., 1995; Vollmer et al., 2005). We also found lower pulse-locking limits in congenitally deaf cats (especially the older DWC), but not in long-term, adult deafened cats (Fig. 10). In neonatally deafened cats, chronic electric stimulation can restore pulse- locking limits back to normal and beyond (Vollmer et al., 1999), and even greater effects are observed in auditory cortex when chronic stimulation is combined with behavioral training (Vollmer and Beitel, 2011). The effects of chronic electric stimulation on both synaptic
morphology in binaural circuits and temporal response properties suggest that it can improve the encoding of precise timing features required for ITD processing. It will be important to determine whether chronic stimulation can improve ITD coding with bilateral CI in both adult and juvenile deaf animals, and, if so, what timing and type if stimulation is required.
Implications for cochlear implants
Comparing our neurophysiological results with perceptual data from bilateral CI users is challenging because of species differences in brainstem physiology and developmental time course, and the possible confound of anesthesia in our experiments. Additionally, the uncontrolled variability among bilateral CI subjects in the timing of deafness and implantation and the amount and nature of their auditory experience can make it hard to discern trends in perceptual performance. Nevertheless, there appears to be broad agreement between the neural and perceptual data with respect to the effects of onset age and duration of deafness on ITD coding.
Our main finding is the greater degradation in neural ITD coding observed for congenitally deaf cats compared to adult-deafened cats that experienced comparable periods of auditory deprivation, suggesting the importance of the neonatal period for the development of ITD sensitivity. This finding is consistent with psychophysical data indicating that prelingually deaf bilateral CI users who were implanted as adults are unable to lateralize sounds based on ITD, even though most are able to utilize ILDs (Litovsky et al., 2010). Even when they are bilaterally implanted at a relatively young age (< 5 yrs) and use their implants daily, most prelingually deaf subjects still do not acquire ITD sensitivity (Salloum et al., 2010). Possibly, these subjects might develop ITD sensitivity if they were implanted even earlier and simultaneously on both sides. Alternatively, the limited ITD cues provided by today’s clinical processors may be too rudimentary to drive normal development of ITD sensitivity, even if implantation occurs before a sensitive period for binaural development. Studies in animal models of deafness receiving controlled chronic electric stimulation through CIs have much to contribute to this issue.
Our second major finding is the more subtle, yet substantial degradation in ITD coding in the long-term, adult-deafened cats. While there was no decrease in the incidence of ITD-sensitive neurons, ITD tuning was broader and the distribution of best ITD more scattered, leading to a predicted decrease in discrimination performance within the natural range of ITDs. Evidence for an effect of prolonged auditory deprivation in adulthood on perceptual ITD
sensitivity in bilateral CI users is very limited. Among four subjects tested for ITD discrimination by Laback et al. (2007), the best performer had been deaf for only 2 months prior to implantation, while the other listeners experienced several years of bilateral or unilateral auditory deprivation. Among four subjects tested by Poon et al. (2009), two who had experienced relatively short periods (< 6 years) of auditory deprivation showed ITD sensitivity as soon as their bilateral processor was activated, while the other two subjects who experienced over 10 years of bilateral deprivation did not regain ITD sensitivity until after several months of bilateral CI usage. While very limited, these psychophysical data are consistent with the moderate effects of auditory deprivation in our long-term deafened cats. Although the 6 months duration of deafness in these cats is shorter than the periods of deprivation typically experienced by CI users, this period is biologically significant in cats, which become sexually mature at ~7 months of age (Scott, 1970). The maintenance of a high number of ITD-sensitive neurons in long-term adult-deafened cats, along with the general reversibility of changes in coding of binaural cues induced by abnormal sensory experience regardless of age (Brainard and K nudsen, 1998; Kacelnik et al., 2006; Siveke et al., 2012) suggests that the degradation in ITD coding resulting from long-term auditory deprivation in adults may be reversible by appropriate binaural stimulation.
Conclusion
Our results strongly suggest that early onset of deafness and prolonged duration of deafness cause different degradations in neural ITD coding. Although we could not completely disambiguate the two factors, it appears that prolonged deafness causes a blur in neural ITD tuning that is likely to be reversible with appropriate binaural experience, while early-onset deafness additionally reduces the number of ITD-sensitive neurons. This severe degradation specific to early-onset deafness may underlie the apparent inability of prelingually deaf CI users to acquire ITD perception, at least when using clinical processors that provide reduced ITD cues. Overall, our results support the idea that deaf children may need to be fitted at an early age with processors optimized to deliver ITD cues in order to achieve full benefits from binaural hearing.
Acknowledgements
We are grateful to Dr. David Ryugo for providing deaf white cats from his colony, and to Connie Miller for expert surgical assistance. Thanks to Evan Foss and Ishmael Stefanov-Wagner for development of custom current sources, based on a design generously shared by Chris van den Honert. Supported by NIDCD Grants R01 DC005775 and P30 DC005209.
References
Aronoff JM, Yoon YS, Freed DJ, Vermiglio AJ, Pal I, Soli SD (2010) The use of interaural time and level difference cues by bilateral cochlear implant users. J Acoust Soc Am 127:EL87-92.
Batra R, Yin TC (2004) Cross correlation by neurons of the medial superior olive: a reexamination. J Assoc Res Otolaryngol 5:238-252.
Batra R, Kuwada S, Fitzpatrick DC (1997) Sensitivity to interaural temporal disparities of low- and high- frequency neurons in the superior olivary complex. II. Coincidence detection. J Neurophysiol 78:1237-1247.
Bergan JF, Ro P, Ro D, Knudsen EI (2005) Hunting increases adaptive auditory map plasticity in adult barn owls. J Neurosci 25:9816-9820.
Brainard MS, K nudsen EI (1993) Experience-dependent plasticity in the inferior colliculus: a site for visual calibration of the neural representation of auditory space in the barn owl. J Neurosci 13:4589-4608.
Brainard MS, Knudsen EI (1998) Sensitive periods for visual calibration of the auditory space map in the barn owl optic tectum. J Neurosci 18:3929-3942.
Bronkhorst AW, Plomp R (1992) Effect of multiple speechlike maskers on binaural speech recognition in normal and impaired hearing. J Acoust Soc Am 92:3132-3139.
Chung Y, Hancock KE, Nam S, Delgutte B (2013) Better temporal neural coding with cochlear implants in awake animals. In: Basic Aspects of Hearing (Moore BCJ, Carlyon RP, Gockel HE, Patterson RD, Winter IM, eds): Springer.
Devore S, Ihlefeld A, Hancock K, Shinn-Cunningham B, Delgutte B (2009) Accurate Sound Localization in Reverberant Environments Is Mediated by Robust Encoding of Spatial Cues in the Auditory Midbrain. Neuron 62:123-134.
Ehret G, Merzenich MM (1988) Complex sound analysis (frequency resolution, filtering and spectral integration) by single units of the inferior colliculus of the cat. Brain Res 472:139-163.
Gold JI, K nudsen EI (2000a) A site of auditory experience-dependent plasticity in the neural representation of auditory space in the barn owl's inferior colliculus. J Neurosci 20:3469-3486.
Gold JI, Knudsen EI (2000b) Abnormal auditory experience induces frequency-specific adjustments in unit tuning for binaural localization cues in the optic tectum of juvenile owls. J Neurosci 20:862-877.
Hancock KE, Delgutte B (2004) A physiologically based model of interaural time difference discrimination. J Neurosci 24:7110-7117.
Hancock KE, Chung Y, Delgutte B (2012) Neural ITD coding with bilateral cochlear implants: effect of binaurally coherent jitter. Journal of Neurophysiology 108:714-728.
Hancock KE, Noel V, Ryugo DK, Delgutte B (2010) Neural Coding of Interaural Time Differences with Bilateral Cochlear Implants: Effects of Congenital Deafness. J Neurosci 30:14068-14079.
Hardie NA (1998) The consequences of deafness and chronic intracochlear electrical stimulation on the central auditory pathways. Clinical and experimental pharmacology & physiology 25:303-309.
Heffer LF, Fallon JB (2008) A novel stimulus artifact removal technique for high-rate electrical stimulation. Journal of Neuroscience Methods 170:277-284.
Heid S, Hartmann R, K linke R (1998) A model for prelingual deafness, the congenitally deaf white cat--population statistics and degenerative changes. Hear Res 115:101-112.
Joris PX, Yin TC (1998) Envelope coding in the lateral superior olive. III. Comparison with afferent pathways. J Neurophysiol 79:253-269.
Joris PX, Van de Sande B, Louage DH, van der Heijden M (2006) Binaural and cochlear disparities. Proc Natl Acad Sci U S A 103:12917-12922.
Kacelnik O, Nodal FR, Parsons CH, K ing AJ (2006) Training- induced plasticity of auditory localization in adult mammals. PLoS Biol 4:e71.
Kapfer C, Seidl AH, Schweizer H, Grothe B (2002) Experience-dependent refinement of inhibitory inputs to auditory coincidence-detector neurons. Nat Neurosci 5:247-253.
Knudsen EI, Brainard MS (1991) Visual instruction of the neural map of auditory space in the developing optic tectum. Science 253:85-87.
Kral A, Eggermont JJ (2007) What's to lose and what's to learn: development under auditory deprivation, cochlear implants and limits of cortical plasticity. Brain research reviews 56:259-269.
Kral A, Sharma A (2012) Developmental neuroplasticity after cochlear implantation. Trends Neurosci 35:111-122.
Kral A, Schroder JH, K linke R, Engel AK (2003) Absence of cross- modal reorganization in the primary auditory cortex of congenitally deaf cats. Exp Brain Res 153:605-613.
Kuwada S, Yin TC (1983) Binaural interaction in low- frequency neurons in inferior colliculus of the cat. I. Effects of long interaural delays, intensity, and repetition rate on interaural delay function. J Neurophysiol 50:981-999.
Kuwada S, Stanford TR, Batra R (1987) Interaural phase-sensitive units in the inferior colliculus of the unanesthetized rabbit: effects of changing frequency. J Neurophysiol 57:1338-1360. Kuwada S, Batra R, Stanford TR (1989) Monaural and binaural response properties of neurons in
the inferior colliculus of the rabbit: effects of sodium pentobarbital. J Neurophysiol 61:269-282.
Kuwada S, Yin TC, Syka J, Buunen TJ, Wickesberg RE (1984) Binaural interaction in low-frequency neurons in inferior colliculus of the cat. IV. Comparison of monaural and binaural response properties. J Neurophysiol 51:1306-1325.
Laback B, Majdak P, Baumgartner WD (2007) Lateralization discrimination of interaural time delays in four-pulse sequences in electric and acoustic hearing. J Acoust Soc Am 121:2182-2191.
Leake PA, Hradek GT (1988) Cochlear pathology of long term neomycin induced deafness in cats. Hear Res 33:11-33.
Lee DJ, Cahill HB, Ryugo DK (2003) Effects of congenital deafness in the cochlear nuclei of Shaker-2 mice: an ultrastructural analysis of synapse morphology in the endbulbs of Held. J Neurocytol 32:229-243.
Litovsky R, Parkinson A, Arcaroli J, Sammeth C (2006) Simultaneous bilateral cochlear implantation in adults: a multicenter clinical study. Ear Hear 27:714-731.
Litovsky RY, Jones GL, Agrawal S, van Hoesel R (2010) Effect of age at onset of deafness on binaural sensitivity in electric hearing in humans. J Acoust Soc Am 127:400-414.
Litvak L, Delgutte B, Eddington D (2001) Auditory nerve fiber responses to electric stimulation: modulated and unmodulated pulse trains. J Acoust Soc Am 110:368-379.
Ma WL, Hidaka H, May BJ (2006) Spontaneous activity in the inferior colliculus of CBA/J mice after manipulations that induce tinnitus. Hear Res 212:9-21.
Macpherson EA, Middlebrooks JC (2002) Listener weighting of cues for lateral angle: the duplex theory of sound localization revisited. J Acoust Soc Am 111:2219-2236.
Manzoor NF, Licari FG, K lapchar M, Elkin RL, Gao Y, Chen G, Kaltenbach JA (2012) Noise-induced hyperactivity in the inferior colliculus: its relationship with hyperactivity in the dorsal cochlear nucleus. J Neurophysiol 108:976-988.
McAlpine D, Jiang D, Palmer AR (2001) A neural code for low-frequency sound localization in mammals. Nat Neurosci 4:396-401.
Middlebrooks JC, Snyder RL (2010) Selective electrical stimulation of the auditory nerve activates a pathway specialized for high temporal acuity. J Neurosci 30:1937-1946.
Mulders WH, Robertson D (2009) Hyperactivity in the auditory midbrain after acoustic trauma: dependence on cochlear activity. Neuroscience 164:733-746.
O'Neil JN, Limb CJ, Baker CA, Ryugo DK (2010) Bilateral effects of unilateral cochlear implantation in congenitally deaf cats. J Comp Neurol 518:2382-2404.
Poon BB, Eddington DK, Noel V, Colburn HS (2009) Sensitivity to interaural time difference with bilateral cochlear implants: Development over time and effect of interaural electrode spacing. J Acoust Soc Am 126:806-815.
Ryugo DK, Pongstaporn T, Huchton DM, N iparko JK (1997) Ultrastructural analysis of primary endings in deaf white cats: morphologic alterations in endbulbs of Held. J Comp Neurol 385:230-244.
Ryugo DK, Rosenbaum BT, K im PJ, N iparko JK, Saada AA (1998) Single unit recordings in the auditory nerve of congenitally deaf white cats: morphological correlates in the cochlea and cochlear nucleus. J Comp Neurol 397:532-548.
Ryugo DK, Cahill HB, Rose LS, Rosenbaum BT, Schroeder ME, Wright AL (2003) Separate forms of pathology in the cochlea of congenitally deaf white cats. Hear Res 181:73-84. Ryugo DK, Baker CA, Montey KL, Chang LY, Coco A, Fallon JB, Shepherd RK (2010)
Synaptic plasticity after chemical deafening and electrical stimulation of the auditory nerve in cats. J Comp Neurol 518:1046-1063.