Publisher’s version / Version de l'éditeur:
Vous avez des questions? Nous pouvons vous aider. Pour communiquer directement avec un auteur, consultez la
première page de la revue dans laquelle son article a été publié afin de trouver ses coordonnées. Si vous n’arrivez pas à les repérer, communiquez avec nous à PublicationsArchive-ArchivesPublications@nrc-cnrc.gc.ca.
Questions? Contact the NRC Publications Archive team at
PublicationsArchive-ArchivesPublications@nrc-cnrc.gc.ca. If you wish to email the authors directly, please see the first page of the publication for their contact information.
https://publications-cnrc.canada.ca/fra/droits
L’accès à ce site Web et l’utilisation de son contenu sont assujettis aux conditions présentées dans le site
LISEZ CES CONDITIONS ATTENTIVEMENT AVANT D’UTILISER CE SITE WEB.
2005 IEEE International Conference on Systems, Man, and Cybernetics
[Proceedings], pp. 3466-3471, 2005-10-01
READ THESE TERMS AND CONDITIONS CAREFULLY BEFORE USING THIS WEBSITE. https://nrc-publications.canada.ca/eng/copyright
NRC Publications Archive Record / Notice des Archives des publications du CNRC :
https://nrc-publications.canada.ca/eng/view/object/?id=c0ba63e2-9b93-4004-af64-f143d626dc90 https://publications-cnrc.canada.ca/fra/voir/objet/?id=c0ba63e2-9b93-4004-af64-f143d626dc90
Archives des publications du CNRC
This publication could be one of several versions: author’s original, accepted manuscript or the publisher’s version. / La version de cette publication peut être l’une des suivantes : la version prépublication de l’auteur, la version acceptée du manuscrit ou la version de l’éditeur.
Access and use of this website and the material on it are subject to the Terms and Conditions set forth at
Condition assessment of water mains using fuzzy evidential reasoning
Najjaran, H.; Sadiq, R.; Rajani, B. B.
Condition assessment of water mains using fuzzy
evidential reasoning
Najjaran, H.; Sadiq, R.; Rajani, B.
NRCC-47738
A version of this document is published in / Une version de ce document se trouve dans :
2005 IEEE International Conference on Systems, Man, and Cybernetics,
Hawaii, U.S.A., October 10-12, 2005, pp. 3466-3471
Condition Assessment of Water Mains using Fuzzy
Evidential Reasoning
Homayoun Najjaran, Rehan Sadiq, and Balvant Rajani
Homayoun.Najjaran@nrc-cnrc.gc.ca, Rehan.Sadiq@nrc-cnrc.gc.ca, Balvant.Rajani@nrc-cnrc.gc.ca
National Research Council Canada (NRC) 1200 Montreal Road, Ottawa, ON, K1A 0R6, Canada
Abstract - This paper describes a method of combining fuzzy inference and evidential reasoning to quantify the corrosion rate of buried metallic pipes, i.e., cast-iron and ductile-iron. The method relies on two bodies of evidence: the corrosivity of surrounding soil and the corrosion rate estimated from measured maximum pit depth. Fuzzy inference is used to deduce a corrosivity criterion, viz., corrosivity potential (CoP), for each body of evidence. The two CoPs are then fused using evidential reasoning to obtain a CoP that is expected to be more reliable than that obtained from any one individual body of evidence. This type of criterion can help utility managers make informed decisions on how to protect their pipes exposed to different soil conditions. The proposed reasoning framework is demonstrated through a case study based on soil properties and corrosion rate data.
Index Terms - Dempster-Shafer theory, fuzzy logic, pipe corrosion, soil properties, and corrosivity potential.
1 Introduction
The deterioration of underground pipes due to corrosion is an increasing concern for private and public water utilities. The primary concern relates to the increasingly large number of leaks and failure of mains that have occurred in potable water distribution networks. Hence, methods to predict the deterioration rate of buried pipes and take mitigative measures have become important for decision makers and utility managers. As the number of metallic pipes far exceeds that of other materials in potable water distribution networks, it is expected that corrosion of both ductile and cast iron mains will continue to receive attention from the engineering community [1-3].
Many different mechanisms and factors lead to the failure of buried pipes. Corrosion occurs as ‘graphitization’ in cast-iron (CI) pipes. In ductile iron pipes, corrosion manifests itself in the form of ‘pits’. It is generally accepted that the corrosion rate (graphitization or external pitting) of unprotected iron mains is governed primarily by the corrosivity of the environment, and material type plays a less significant role [5].
The corrosion of metallic pipes can be also influenced by other factors such as galvanic reaction of dissimilar metals where copper services are connected to the pipes, stray current where the pipes pick up a part of the DC current of ground rails of streetcars, corrosion cells where the pipes pass through different types of soils, and microbiologically induced corrosion (MIC) where there is high concentration of anaerobic and/or aerobic bacteria [6].
Typically, corrosion initiation and growth are influenced by a large number of factors so that they are often treated as random processes and modeled using nontraditional modeling techniques. Statistical models as well as approximate reasoning methods are commonly used to estimate the corrosion rate and remaining service life of pipes [7-9]. Typically, these methods are used to identify environments that are potentially corrosive to water utilities. If done prior to pipe installation, water utilities can save significant future costs and avoid failures by selecting appropriate levels of protection, i.e., often by installing externally coated pipes. Identifying corrosive environments in existing water distribution networks can also save resources such as those spent on cathodic protection by focusing attention on the pipe lengths that are at higher risk.
conditions that are corrosive to buried iron pipes. The most common method is the 10-point scoring (10-P) that was introduced by CIPRA (Cast Iron Pipe Research Association, predecessor of DIPRA, Ductile Iron Pipe Research Association) in 1964 for cast iron pipes. The method was subsequently extended to ductile iron pipes [10]. The 10-P method uses five soil properties including resistivity, pH, redox potential, sulfide, and moisture content. In essence, this method classifies the soil as either “corrosive” or “non-corrosive”, but it does not provide information on the intensity of corrosivity. Najjaran et al [11] introduced a fuzzy expert system that determines the soil corrosiveness using
corrosivity potential (CoP), i.e., a real number in the [0, 1] interval, for given soil properties. The expert system used a fuzzy rule base that was developed based on expert opinion. They also used a linear regression model to predict the pipe deterioration rate from the CoP. The model was tested using a set of field data that were previously published in [12]. Although the CoP seems to be an appropriate criterion to gauge soil corrosivity, the regression model did not show a strong correlation between the
CoP and deterioration rate. This can occur due to imprecise measurements of soil properties and corrosion rates, or it simply indicates that the corrosion rate is also influenced by factors other than those considered in the fuzzy expert system.
In this paper, a new approach is proposed in which the CoP obtained from the soil properties is only one body of evidence providing partial information about the corrosivity of the environment. Another body of evidence for corrosivity potential is estimated from corrosion rate obtained from maximum pit depth and pipe age. Both bodies of evidence are derived from uncertain (vague and incomplete) data. Fuzzy logic can provide an appropriate framework to deal with such data. In this paper, two fuzzy models are developed to estimate the corrosivity potential, one (CoP1) based on soil properties and another (CoP2) based on corrosion rate. Subsequently, the two CoPs (CoP
and CoP2
1
) are fused using evidential reasoning, proposed by Dempster [13] and Shafer [14], to obtain an updated CoP that is expected to be more reliable than each of the two individual estimates obtained from the fuzzy models.
fuzzy evidential reasoning framework is explained in section II. Section III describes the fuzzy models and the rules of combination to determine CoP. Finally, three examples are presented in section IV to demonstrate the benefits of collectively considering all available information.
2 Fuzzy
Evidential
Reasoning
A large body of literature is extent on the hybrid use of fuzzy logic and Dempster-Shafer theory to deal with different types of uncertainties in a unified framework e.g., [15-16]. Hybrid methods are particularly useful when the available information is not only uncertain but also imprecise and vague. Evidential reasoning provides a flexible framework to combine concordance (nested), consistent, arbitrary, as well as disjointed evidence. In other words, it can be used to combine relevant evidence that fully agrees, partially supports, or conflicts. However, a major shortcoming of the Dempster-Shafer theory for evidential reasoning is that it can only deal with a set of mutually exclusive and exhaustive focal elements, i.e., evidential reasoning is not primarily defined to deal with vague information. This type of information is difficult to process with the Dempster-Shafer theory, but it is the primary focus of fuzzy theory. It has been shown, e.g., in [17], in several instances that a combination of fuzzy set theory and Dempster-Shafer theory can effectively overcome this problem.
Figure 1 shows the proposed framework for fuzzy evidential reasoning as applied to the determination of corrosivity potential (CoP) of buried pipes. The first corrosivity potential, CoP1, is obtained from the soil properties using a multi-input-single-output (MISO) fuzzy model. The soil sample is typically characterized by five soil properties including soil resistivity, pH, % clay fines (diameter < 0.002 mm), redox potential, and sulfide content. This fuzzy model includes 432 rules that are defined based on expert knowledge. The output of the model is CoP1 expressed by five fuzzy numbers, namely, very low (VL), low (L), medium (M), high (H), and very high (VH). The output of the fuzzy inference is not defuzzified; instead the memberships of the inferred
CoP fuzzy sets throughout the universe of discourse are used to measure the probability of each output fuzzy number using Zadeh’s definition [18-19] for
the probability of fuzzy sets. In his definition, the membership value of the middle of maximum (MOM) memberships of each fuzzy set is the probability of the fuzzy set. For instance, the probability of a triangular fuzzy set is the height of the triangle at the tip. The probabilities of the output fuzzy sets are used as the basic probability assignment (BPA), which is a precursor to evidential reasoning.
The second corrosivity potential, CoP2, is obtained from a single-input-single-output (SISO) fuzzy model. The input of the model is the corrosion rate of the pipe sample(s), adjacent to the location(s) of the soil sample(s). The corrosion rate is estimated from the measured maximum pit depth on the pipe sample and pipe age. In general, the use of an average (constant) corrosion rate (i.e., from installation to exhumation) is debatable, since it assumes that corrosion has initiated right after installation and continued at a constant rate throughout the service life of the pipe. However, this is the best estimate of corrosion rate in the absence of other relevant data. It is noted that the proposed framework remains largely unchanged if an alternative or an improved method to estimate corrosion rate becomes available. Similar to CoP1, the output of the second model CoP2 is not defuzzified; rather its memberships are converted to the BPA to generate a second body of evidence.
Fig. 1 Framework of fuzzy evidential reasoning A credibility factor is assigned to adjust the weight of each body of evidence with respect to the reliability of the source of information since the CoP values are based on uncertain (incomplete and
vague) information. The BPA values are normalized using the credibility factor, α, of each body of evidence, and the remaining mass is assigned to ignorance. The normalization is carried out such that the cardinality of all BPAs, including the ignorance mass, is equal to one. It is noted that the proposed framework can be used in a recursive manner to update the CoP value when new information (i.e., either soil properties or corrosion rate estimates) becomes available.
3
Determination of Corrosivity
Potential (COP)
In this section, three examples are presented and compared to describe the functionality of the proposed framework to determine the CoP from uncertain information. Table 1 shows soil properties and corrosion rates of three hypothetical pipe samples. The soil properties are identical in all samples, but the corrosion rates are different.
Table 1 Input data for the three examples
Example* Co rro sio n rate (m m/y r) R ( Ω -c m) pH Clay fines % Redox potential (mV ) Sulfide 1 0.020 3000 7.1 30 51 -1 2 0.026 Same as above 3 0.030 Same as above
* The corrosion rate of Example 1 is obtained from real data published in [12], but the corrosion rates of Examples 2 and 3 are hypothetical values to show how results change when the conflict between two bodies of evidence is more pronounced.
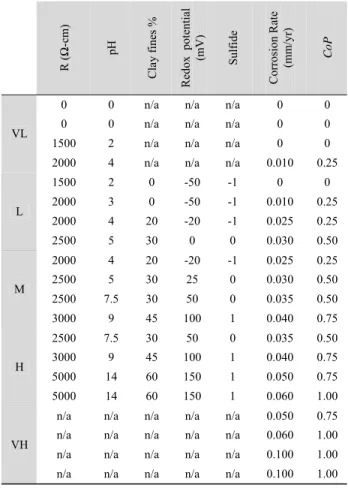
Table 2 shows the input and output parameters of the two fuzzy models. The fuzzy numbers of the two models are all defined using trapezoidal fuzzy numbers with four edges defined in the table. The outputs of both models are corrosivity potential (CoP) expressed by five fuzzy numbers, viz., very low (VL), low (L), medium (M), high (H) and very high (VH). The inputs of the first model are five soil properties. The first two inputs, namely soil resistively (R in Ω-cm) and pH, are expressed using four fuzzy numbers. The remaining three inputs including % clay fines (diameter < 0.002 mm), redox potential, and sulfide content are defined using three fuzzy numbers. The only input of the second model is the corrosion rate that is expressed by five fuzzy numbers, similar to the CoP.
Soil Properties MISO Rule Base Model Fuzzy Inference CoP1 Corrosion Rate SISO Rule Base Model Inference Mechanism Inference Mechanism DST Fusion Evidential Reasoning CoP2 CoP Final Decision
distributed in its universe of discourse, i.e., the [0, 1] interval. The partitions of the corrosion rate are defined based on the distribution of maximum pit depths obtained from about 500 pipe samples. The universes of discourse and partitions of the soil properties are defined based on their intervals used in the 10-P method [5].
Table 2 Parameters for the two fuzzy models
R ( Ω -c m) pH Clay fines % Redox potential (mV ) Sulfide Corrosion Rate (m m/y r) CoP
0 0 n/a n/a n/a 0 0
0 0 n/a n/a n/a 0 0
1500 2 n/a n/a n/a 0 0
VL
2000 4 n/a n/a n/a 0.010 0.25 1500 2 0 -50 -1 0 0 2000 3 0 -50 -1 0.010 0.25 2000 4 20 -20 -1 0.025 0.25 L 2500 5 30 0 0 0.030 0.50 2000 4 20 -20 -1 0.025 0.25 2500 5 30 25 0 0.030 0.50 2500 7.5 30 50 0 0.035 0.50 M 3000 9 45 100 1 0.040 0.75 2500 7.5 30 50 0 0.035 0.50 3000 9 45 100 1 0.040 0.75 5000 14 60 150 1 0.050 0.75 H 5000 14 60 150 1 0.060 1.00 n/a n/a n/a n/a n/a 0.050 0.75 n/a n/a n/a n/a n/a 0.060 1.00 n/a n/a n/a n/a n/a 0.100 1.00 VH
n/a n/a n/a n/a n/a 0.100 1.00 n/a: not applicable.
The rules for the MISO fuzzy model (CoP1) are in the form of IF-THEN rules and are based on expert knowledge. Some examples of the rules are as follows:
input fuzzy numbers refer to the same output fuzzy number, e.g., if (Corrosion Rate is VL) then (CoP is
VL).
Figure 2 shows the results of fuzzy inference for the three examples. The fuzzy set for CoP1, shown with solid dots, is the same in the three examples. However, the fuzzy set of CoP2, shown with open dots, changes with different corrosion rates. Figure 2 shows that the two CoPs are nearly the same in Example 1, partially support each other in Example 2, and contradict each other in Example 3.
Fig. 2 Fuzzy inference without defuzzification The expected value of every individual fuzzy number in the output fuzzy set is considered to be in the middle of the points with maximum memberships (MOM). The membership of the expected value, μMOM, is the probability of the fuzzy
number. Thus, it is possible to assign probabilities to linguistic variables that are associated with the fuzzy numbers. Table 3 shows the μMOM for Example 1 in
which the two fuzzy numbers VL and L have membership values that are greater than zero. The μMOM values are multiplied by assumed credibility
factors of α1 = 0.85 and α2 = 0.65, to discount the
credibility associated with the source of information for the first and second body of evidence, respectively. The BPAs of the fuzzy numbers are obtained by normalizing the accredited μMOM. The
remaining mass (BPA) is assigned to ignorance (θ). Table 4 shows the results of evidential reasoning using the BPAs of Example 1. Table 5 summarizes the CoP obtained from evidential reasoning for the three examples. The table shows that the two bodies
Rule 1: If (Resistivity is VL) and (pH is VL) and (FINES and (Redox is L) and (Sulfide is L) then (CoP is H) is L)
…
Rule 216: If (Resistivity is L) and (pH is H) and (FINES is H) and (Redox is H) and (Sulfide is H) then (CoP is M)
…
Rule 432: If (Resistivity is H) and (pH is H) and (FINES is H) and (Redox is H) and (Sulfide is H) then (CoP is L)
of evidence (i.e., CoP1 obtained using the soil properties and CoP2 obtained using the corrosion rate) for all three examples broadly agree with the large mass assigned to L. The ignorance mass is relatively small but it steadily increases as the corrosion rate (second body of evidence) increases. For instance, ignorance is significantly higher in example 3 as a consequence of conflicting evidence from the two bodies of information. Thus, ignorance mass can be used as measure of reliability for the final inference of corrosivity potential.
Table 3 BPA for Example1
VL L M H VH θ CoP1 , α = 0.851 μMOM 0.020 0.980 0 0 0 - BPA1 0.017 0.833 0 0 0 0.150 CoP2, α = 0.65 2 μMOM 0 1 0 0 0 - BPA2 0 0.650 0 0 0 0.350
Table 4 Evidential reasoning for Example 1
CoP1 VL L M H VH θ VL 0 0.011 0 0 0 0.006 L 0 0.541 0 0 0 0.292 M 0 0 0 0 0 0 H 0 0 0 0 0 0 VH 0 0 0 0 0 0 CoP2 θ 0 0.098 0 0 0 0.052 CoP 0.006 0.931 0 0 0 0.063
Table 5 Results of evidential reasoning all examples
CoP
VL L M H VH θ
Ex.1 0.006 0.931 0 0 0 0.063
Ex.2 0.006 0.803 0.019 0 0 0.172 Ex.3 0.006 0.292 0.097 0 0 0.605 BPA is distributed among more focal evidences and ignorance mass increases when the conflict between the two bodies of evidence is more pronounced.
4 Conclusions
A fuzzy evidential reasoning framework is proposed to evaluate the corrosivity potential of buried metallic pipes. The combination of fuzzy inference and evidential reasoning allows the
consideration of two bodies of evidence: corrosivity of the soil surrounding the pipe and pipe corrosion rate estimated from the measurements of maximum pit depth and pipe age. Fuzzy inference is used since both bodies of evidences are obtained from uncertain sources of information. Then, evidence (CoP1 and
CoP2) from each source of information is fused using evidential reasoning to derive a single surrogate criterion of corrosivity potential (CoP).
Unlike the binary states of the corrosivity (corrosive vs. non-corrosive) obtained from the traditional 10-P method, the proposed corrosivity potential (CoP) specifies the corrosivity of the environment in a number of brackets (VL, L, etc.) and a possibility associated with each bracket. Thus, the results can be used to gauge the level of required corrosion protection. Specifically, the corrosivity potential bracket with the highest probability is likely to be used to select one of the six levels of corrosion protection methods recommended for ferrous pipe materials [20].
References
[1] Lary J., “Corrosion, not age, is to blame for most water main breaks,” Water World, 2000.
[2] Davis P., Allan I., Burn S., and van de-Graaff R., Identifying trends in cast iron pipe failure with GIS maps of soil environments, Pipes Wagga 2003,
Back to Basic: Design and Innovation, Wagga City, Australia, 2003.
[3] Seica M. V., Packer J. A., Grabinsky M. W. F., Adams B. J., and Karney B. W., “Evaluation and testing of cast iron and ductile iron water mains samples,” Final Report to City of Toronto,
Department of Civil Engineering, University of Toronto, 2000.
[4] Doyle G., Seica M. V., and Grabinsky M. W. F., “The role of soil in the external corrosion of cast iron water mains in Toronto, Canada,” Canadian
Journal of Civil Engineering, 40: 225-236, 2003. [5] Spickelmire B., “Corrosion consideration for
ductile iron pipe,” Materials Performance, 41: 16-23, 2002.
[6] Kroon D. H., Lindemuth D. Sampson S., Vincenzo T., “Corrosion protection of ductile iron pipe,” NACE Corrosion 2004.
[7] Rajani B., and Kleiner Y. “Comprehensive review of structural deterioration of water mains: Physical based models,” Urban Water, 3(3): 151-164, 2001. [8] Kleiner Y., and Rajani B., “Comprehensive review
of structural deterioration of water mains: statistical models,” Urban Water, 3(3): 131-150, 2001.
method of soil corrosivity evaluation for predicting water main deterioration,” ASCE Journal of
Infrastructure Systems, 10(4): 149-156, 2004. [10] ANSI/AWWA C105/A21.5-99 American national
standard for polyethylene encasement for ductile-iron pipe systems, American Water Works
Association, Denver, CO, 1999.
[11] Najjaran H., Sadiq R., and Rajani B., “Fuzzy expert system to assess corrosivity of cast/ductile iron pipes from Backfill Properties,” Journal of
Computer-Aided Civil and Infrastructure Engineering (In press).
[12] Rajani B., Makar J., McDonald S., Zhan C., Kuraoka S., Jen C. K., and Veins M., “Investigation of grey cast iron water mains to develop a methodology for estimating service life,” American
Water Works Association Research Foundation (AWWARF), Denver, CO, 2000.
[13] Dempster A. P., “Upper and lower probabilities induced by a multivalued mapping,” Annals of
Mathematical Statistics, 38:325-339, 1967.
[14] Shafer G., A mathematical theory of evidence,
Princeton University Press, Princeton, NJ, 1976.
[15] Yen J., “Generalizing the Dempster-Shafer theory to fuzzy sets,” IEEE Transactions on Systems, Man
and Cybernetics, 20(3):559-570, 1990.
[16] Yager R. R., “Generalized probabilities of fuzzy events from fuzzy belief structures,” Information
Sciences, 28(2): 45-62, 1982.
[17] Ogawa H., Fu K. S., and Yao J. T. P., “An inexact inference for damage assessment of exisiting structures,” International Journal of Man-Machine
Studies, 22:295-306, 1985.
[18] Zadeh L. A., “Probability measure of fuzzy events,”
Journal of Mathematical Analysis and Applications, 23:421-427, 1968.
[19] Smets P., “ Probabilities of a fuzzy event: an axiomatic approach,” Fuzzy Sets and Systems, 7:153-164, 1982.
[20] Dechant D. A., and Smith G., “Present levels of corrosion on ferrous water piping in municipal infrastructure: a manufacturer’s perspective”,