HAL Id: inserm-00192886
https://www.hal.inserm.fr/inserm-00192886
Submitted on 29 Nov 2007
HAL is a multi-disciplinary open access
archive for the deposit and dissemination of
sci-entific research documents, whether they are
pub-lished or not. The documents may come from
teaching and research institutions in France or
abroad, or from public or private research centers.
L’archive ouverte pluridisciplinaire HAL, est
destinée au dépôt et à la diffusion de documents
scientifiques de niveau recherche, publiés ou non,
émanant des établissements d’enseignement et de
recherche français ou étrangers, des laboratoires
publics ou privés.
Lung liquid clearance in newborn lamb: MRI methods
and preliminary results.
Romain Viard, Maximilien Vermandel, Pierre Tourneux, Laurent Storme,
Jean Rousseau
To cite this version:
Romain Viard, Maximilien Vermandel, Pierre Tourneux, Laurent Storme, Jean Rousseau. Lung
liq-uid clearance in newborn lamb: MRI methods and preliminary results.. Conference proceedings : ..
Annual International Conference of the IEEE Engineering in Medicine and Biology Society. IEEE
En-gineering in Medicine and Biology Society. Annual Conference, Institute of Electrical and Electronics
Engineers (IEEE), 2007, 1, pp.2891-4. �10.1109/IEMBS.2007.4352933�. �inserm-00192886�
Abstract— To study the lung water clearance in vivo at the time of the birth, MR experiments were conducted on newborn lamb
immediately after uterine incision deliverance. Images obtained with a fast spin echo sequence enable to quantify lung liquid each 5 minutes during 30 minutes then each 10 minutes for 1.5 hour. From the lung contours, pulmonary volume, pulmonary water, and spatial gradient of pulmonary water were studied. At 2 hours of life, the total pulmonary water content was still high and the liquid clearance was slower in the lower part of the lung. Air inflation increased the size of the distal airways and shifted liquid from the lung lumen towards the pulmonary interstitial tissue. The pulmonary water wash-out was belated and the passage to the aerial life was performed by progressive liberation of the superior pulmonary spaces, water flowing out by gravity toward the lower spaces.
I. INTRODUCTION
Normal transition at birth requires the rapid development of the functional residual capacity (FRC). Little is known regarding the increase of the lung volume and the lung liquid clearance. Some MRI studies have been led on newborns and premature babies [1-6] to quantity the increase of lung water in premature newborn vs. infant at term, and to study if this increase was distributed uniformly or if it was in relation with atelectasis associated to earth gravity. However, no MRI survey was about the lung water clearance in newborn. To perform MRI exam during the first hours after the birth is impossible to do on human newborn. So, only animal study can study the lung since the water filling to air filling. This paper describes a survey on newborn lamb whose size makes it compatible with a clinical MR scanner and whose respiratory system is representative of human physiology. The aim is to study the spatial and temporal clearance of the lung water on the first hours of aerobic life.
II. MATERIAL AND METHODS
1) Animal preparation. Five mixed-breed were fasted for 48h before surgery. Ewes were sedated and anesthetized. Ewes were kept sedated but breathed spontaneously through the surgery and the experiment. Under sterile conditions, the foetal lamb’s neck was delivered through a uterine incision. Analgesia of the foetus lamb was then performed A polyurethane tracheal tube was placed through a tracheal incision. Tracheal tube was occluded until the mechanical ventilation was started. We used an open magnet MR scanner (Hitachi. Airis® 0.2T). The ewe was placed on the table of the MR system. The foetal lamb was extracted and placed in prone position in the head coil. The umbilical cord was not clamped. The ewe laid in supine position near the head coil to prevent any stretch of the umbilical cord. The tracheal tube was connected to a servo 900C Siemens respirator. Breath rate and maximum inspiratory pressure were adjusted if necessary to keep a normal blood pH.
2) Experimental design and MR Imaging. Fast Spin Echo T2-weighted sequences were used. This FSE sequence provides a signal proportional to protons density and it enables to obtain in a short time (35 sec) a high visualization both of the pulmonary water component (high intensity) and of the aerial lung volume (low intensity). At the initial time of the experiment, images were obtained according to the three main planes (transaxial, coronal and sagittal) in order to define accurately the initial lung volume (Fig. 1).
J. Rousseau is with the INSERM U 703, Institut de Technologie Médicale, CHRU Lille France (corresponding author phone: +333.20.44.67.14; e-mail: [email protected]).
R. Viard (r-viard]@chru-lille.fr) and M. Vermandel ([email protected]) are with INSERM U 703.
P.. Tourneux ([email protected]) is with Neonatology Dept, CHU Amiens, and with EA3901, University of Picardie, France L. Storme ([email protected]) is with Perinatology Dpt, CHRU Lille and with JE2490, University of Lille II, France
Grants were received from the "Conseil Régional du Nord-Pas-de-Calais" (CPER 2002), from the European Community (FEDER), from the "Ministère de l'Education Nationale, de la Recherche et de la Technologie" (EA 1049 / JE 2490) and from the "Institut national de la Recherche Médicale" (Inserm).
Lung liquid clearance in newborn lamb: MRI methods and
preliminary results
R. Viard, M. Vermandel, Member IEEE, P. Tourneux, L. Storme, J. Rousseau, Member, IEEE
This material is presented to ensure timely dissemination of scholarly and technical work. Copyright and all rights therein are retained by authors or by other copyright holders.
All persons copying this information are expected to adhere to the terms and constraints invoked by each author's copyright. In most cases, these works may not be reposted without the explicit permission of the copyright holder.
Fig. 1. MR images obtained at the beginning of the exam.
At the beginning time (T0), at 2 minutes from the beginning (T2), then every 5 minutes until T30, successive coronal images were acquired during successive apnoeas of 30 seconds, have been gotten by stop provoked of the respirator. The umbilical cord was clamped 30 min after the beginning. The same protocol was applied during the next 30 minutes (T35 to T60) with apnoeas and images every 5 min, then during one hour (T70 in T120). At the end of the experiment (Tend), images were acquired in the three main planes.
3) Image analysis. Image processing was performed with an house-made software written in Borland C++ Builder® and implemented on standard PC computer. The lung volumes appeared on the slices with homogeneous high signal intensity at the beginning of the experiment. The signal decreased progressively with time and became different from image to another according to the position of the slice considered. As a robust automatic segmentation of the lung contours was impossible, the pulmonary volumes were manually contoured by an expert. The different contours obtained at a given time have been merged by a fuzzy logic data fusion algorithm [7].
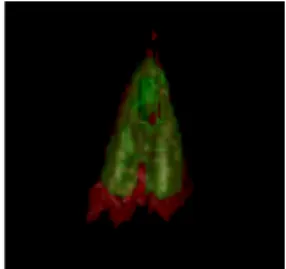
4) Data analysis and models. From these contours and volumes, the following parameters were studied as function of time: pulmonary volume (PV), pulmonary water (PW), spatial gradient of pulmonary water (WG). Curve fitting and model parameters were obtained by using dedicated statistical software (XLSTAT-2006®, Addinsoft™, France). Pulmonary volumes were determined accurately at the beginning (tinit, PVinit) and at the end of the experience (tend, PVend) by associating the contours obtained on the three plans (Fig. 2).
Fig. 2. Lung volume visualization at Tinit (green) and at Tend (red). The areas of lung volume inflation are clearly visible.
The contours obtained on coronal images from t0 to t120 were used to measure of the pulmonary volume (PV) as function of
time. The volume was fitted by PV PV (PV PV )x( 1 e t)
0 0 α − ∞− − +
= and the half inflation time was obtained by T1/2-PV =
Log(2)/α.
Pulmonary water (PW) was studied while adding the gray levels inside the pulmonary volumes (PV0 to PV120). Considering that the global pulmonary signal remained roughly constant during the two hours of experience, the mean value PW and its
standard deviation SDPW were computed on the two hours data, as well as the coefficients of variation CVPW.
The pulmonary water density was defined as the ratio of the pulmonary water to the pulmonary volume WD = PW/PV. With
the hypothesis of an exponential decreasing behaviour, pulmonary water density WD was modelized by WD=WD0e−kWDt,
where WD0 represents the initial water density present water in the lungs and where kWD is the decreasing factor.
Half-draining times were determined by TWD = Log(2)/kWD.
The pulmonary water was studied according to the level of each coronal slice. It will shown below that the most proclive pulmonary regions (i.e. the back regions since the lamb was in prone position) were draining away whereas the water content of the most declive regions remains constant or even increases during the first two hours of the draining. Roughly assuming that, because of gravity, the pulmonary water flows out from the highest regions to the lowest ones and that the water resorption toward the extrapulmonary space will be carried out later, the water content PWi of each slice Si was divided by
the corresponding volume PVi to obtain water density WDi which was modelized by WDi=e−kWDit and corresponding
half-draining time TWDi . The slope of the linear regression of TWDi (in min) vs. the height Hi of the slice Si (in mm) gave the
so-called water gradients WG and WG (in min mm-1) of spatial draining.
III. RESULTS
a) Pulmonary volume vs. time. Table I summarizes the results obtained on the pulmonary volumes of the 5 lambs at the beginning and at the end of experience. The measured initial and final lung volumes are compared to the corresponding volumes obtained by model extrapolation at Tinit and Tend. The pulmonary half inflation times (T1/2-PV), are also given.
Lamb n° 1 2 3 4 5 Term (j) 141 138 139 139 141 Weight (kg) 4.34 2.70 3.20 2.92 2.40 PVinit (mL/kg) 47.0 48.1 40.6 56.2 40.8 PVend (ml/kg) 62.4 65.2 59.7 108.6 99.6 PV0-model (mL/kg) 57.1 54.4 53.4 74.7 53.7 PV∞-model (mL/kg) 91.2 79.3 105 105.5 81.2 T1/2-PV (min) 29 29 70 37 46
Table I: Lung water volumes. PVinit, PVend: initial and final volumes, measured with using three MR planes. PV0-model, PV∞-model: initial (T0) and final (T∞) volumes obtained by the exponential model. T1/2-PV: half inflation times, corresponding to the time for reach the intermediary value 0.5 x (PV0-model + PV∞-model).
b) Pulmonary water vs. time. Fig. 3 shows the mean lung water content (5 lambs, MLW) vs. time.
Fig. 3: Mean lung water content vs. time MLW, each value of the five lambs being normalized by initial values (T0).
Table II gives the results of time evolution parameters of lung water content for the 5 lambs.
Lamb 1 2 3 4 5
PW (u.a.) 1.22 1.14 0.98 0.86 1.05 VC (%) 3.1 5.6 2.8 6.7 6.0 TWD (min) 185 155 155 217 155
Table II. Whole lung water draining. PW values, which are proportionnal to the lung water content along the experience duration, are obtained by adding gray levels in lung ROI's (PW) and are given in arbitrary units. Their low variation coefficients (VC) show that the water remains globally in the lungs during the 2 first hours after birth. The half-water draining times, TWD, correspond to the time necessary to reach whole lung water densities (WD) equal to 0.5.
c) Lung draining geometry. Table III gives the draining water gradient values (WG). This spatial gradient corresponds to the fact that the proclive regions were draining away more quickly than the declive regions. At the end of the 2 hours, the lowest regions remain full of water, whereas the lung volume increases, as it is shown in Fig. 4 and 15.
Lamb 1 2 3 4 5
WG (min mm-1) 3.41 5.33 3.16 3.92 2.17 Table III. Draining water gradients WG. They are defined as the slopes of the linear regressions between lung water densities and coronal slice heights.
0 0,2 0,4 0,6 0,8 1 1,2 0 20 40 60 80 100 120 140 Slice 1 Slice 2 Slice 3 Slice 4 Slice 5
Fig. 4. Mean water densities (five lambs) of slices i, from the most proclive slice (i=1) to the most declive (i=5). 0 0,2 0,4 0,6 0,8 1 1,2 1,4 0 20 40 60 80 100 120 140 MLW t (min) t (min) MWDi
0 0,2 0,4 0,6 0,8 1 1,2 1,4 1,6 1,8 0 20 40 60 80 100 120 140 Slice 1 Slice 2 Slice 3 Slice 4 Slice 5
Fig. 5. Mean water contents MPWi (five lambs) of slices i , from the most proclive slice (i=1) to the most declive (i=5).. The PWi were normalized by their initial value at T0.
t (min) MPWi
IV. DISCUSSION
The aim of this study was to demonstrate that it was possible to quantify the lung water in vivo at the time of the birth. Different methods of acquisition, of image processing, and of data analysis, with underlying implicit or explicit hypotheses, have to be discussed.
a) The experimental in vivo model. We chose a model of extraction of the foetus by Caesarean rather than by low way, the pulmonary water level coming closer more of the one observed in utero (Bland RD, 1979). After the birth, sequential MR acquisition required the foetus immobility which was obtained by curarization. A respiratory aid was performed thanks to a respirator. Apnoeas of 35 sec. permitted a satisfactory ratio "apnoeas duration / MR image quality", but this experimental model is obviously different from birth conditions by physiological natural way. However, it comes closer to the conditions of taking charge of the newborn presenting a severe neonatal asphyxia. On the other hand, to clamp the cord after a delay of 30 min assures an optimal oxygenation of the foetus during the first apnoeas whereas the foetal cardiac rhythm is still low. We didn't observe effect of the cord clamp on the variations of lung volume and lung water.
b) MR imaging. MRI demonstrated its ability to visualize the lungs and to quantify their volume and their content. The FSE sequence used, gave proton density weighted images, and thus a good contrast both of the liquid compartment (hypersignal) and of the air compartment (hyposignal) all experiment long. Obviously, intermediate contrasts were more difficult to analyze, forbidding all automatic image processing. An enough accurate contouring of the lungs could not be achieved otherwise than manually, the user taking advantage from contouring realized on the images obtained at the time t-1 to define the contours on the images of the time t. Considering the large number of images involved (close to 200 per lamb), and even with an effective software especially dedicated to this application to facilitate the task, this manual technique is evidently very long and fastidious, leading to possible mistakes or accuracies.
In other respects, the parameters of the FSE sequence were determined to get an acceptable compromise between acquisition time, field of view (FOV), number of slices, slice thickness, signal-to-noise ratio (SNR), and image resolution. FOV (320 x 320 mm2) allowed, in coronal planes, whole lung visualization. As the lung thickness was only of about 50 to 60 mm, 12 slices (10 mm thickness) were sufficient to be sure that the whole pulmonary volume, in expansion during the 2 hours of acquisition, would be covered perfectly. The respiratory movements didn't give artefacts since the breathing was blocked in apnoea during acquisitions, unlike the cardiac movements. A cardiac gating could be used, but to the detriment of the acquisition time and the artefact was not judged sufficiently troublesome to justify cardiac gating.
It would have been certainly easier to get a sequence more adapted, in terms of image quality as well as of acquisition time, with a higher field MR scanner. However, such facilities, commonly used in clinical daily practice, would have been poorly adapted to our study. Their magnet bore are not easy to install a newborn lamb while the umbilical cord joins it to the ewe, and with the delicate setting up of intubation system and physiological monitoring. On the contrary, our open-field 0.2T MR scanner was perfectly adapted to our needs.
c) Image processing. Volume and water content measurements were based on lung contours defined on the different slices. The accuracy of these contours was evidently much higher when three sets of slices (sagittal, transaxial and coronal) were used, as at the beginning and at the end of the exam. Data fusion method by a fuzzy logic algorithm that we used and the data redundancy of the planes minimize the partial volumes effects [7, 8]. It can be noted that, in Table I, the initial lung volumes (PVinit), obtained from the three planes, without air insufflation and therefore corresponding to expiration condition, are lower (in the order of 15 to 25%) than the corresponding PV0-model volumes obtained by model extrapolation from coronal-only contours. It would have been therefore preferable to realize MR images in the three planes at each measuring time during the 2 hours of the exam. Unfortunately, it would have induce a very long acquisition time, physiologically incompatible with an apnoea every 5 min. However, it could be possible to use the initial volumes PVinit to correct the volumes obtained by modelization in order to achieve a better quantification. The corrective factor is equal to PVinit/PV0-model.
d) Models and results. The modelization of the lung volume increase vs. time by a simple exponential function appears well justified. As a matter of fact, it is difficult to determine accurately the PV'∞-model asymptote.
Assimilating the pulmonary water to a simple sum of gray levels inside to the lung volumes is also a rough approximation of the underlying physiological reality, and the modelization could have been more complete. One could make for example the hypothesis that the pulmonary signal is produced on the one hand by the progressive draining of the alveolar water, and on the other hand by the increase of blood vascularization of the lung parenchyma. Unfortunately, considering the characteristic times observed, the length of the observations (2 hours) is certainly insufficient to validate experimentally such a hypothesis, and to prolong the protocol would be little viable for the animals. The results obtained have also to be compared to the functional physiological values observed at the same time as the IRM acquisitions, and to the parameters obtained post-mortem on the animals. It is the subject of a work in progress.
V. CONCLUSION
The methodology of this MRI study permits to follow spatial and temporal wash-out of the pulmonary water on the newborn lamb. An open field 0.2T MR scanner allowed us such an exploration, impossible to achieve in a conventional machine. We have shown that the liquid clearance is slower in the lower part of the lung. At 2 hours of life, the total pulmonary water content is still high, close to the levels measured in the fetus. We speculate that air inflation increases the size of the distal airways and shifts liquid from the lung lumen towards the pulmonary interstitial tissue. The results seem to indicate that the draining of the pulmonary water is belated and that the passage to the aerial life is performed by progressive liberation of the superior pulmonary spaces, water flowing out by gravity of these last toward the lower spaces. These results must be confirmed by longer studies and by the confrontation of MRI results with physiological parameters and functional exploration.
VI. REFERENCES
[1] Jani J, Breysem L, Maes F, Boulvain M, Roubliova X, Lewi L, Vaast P, Biard JM, Cannie M, Deprest J. Accuracy of magnetic resonance image for measuring fetal lungs and other organs. Ultrasound Obstet Gyn 25:270-6, 2005
[2] Adams EW, Counsell SJ, Hajnal JV, Cox PN, Kennea NL, Thornton AS, Bryan AC, Edwards AD. Magnetic Resonance Imaging of Lung Water Content and Distribution in Term and Preterm Infants. Am J Respir Crit Care Med 166:397–402, 2002
[3] Appleby CJ, Towner RA. Magnetic resonance imaging of pulmonary damage in the term and premature rat neonate exposed to hyperoxia. Pediatric research, 50:502-507, 2001
[4] Huang MQ, Basse PH, Yang Q, Horner JA, Hichens TK, Ho C. MRI detection of tumor in mouse lung using partial liquid ventilation with a perfluorocarbon-in-water emulsion. Magn Reson Imaging 22:645-52, 2004
[5] Heverhagen JT, Hahn HK, Wegmann M, Herz U, Shaffer Whitaker CD, Matschl V, Alfke H. Volumetric analysis of mice lungs in a clinical magnetic resonance imaging scanner. MAGMA 17:80-5, 2004
[6] Ward VL, Nishino M, Hatabu H, Estroff JA, Barnewolt CE, Feldman HA, Levine D. Fetal lung volume measurements: Determination with MR imaging - Effect of various factors. Radiology 240:187-193, 2006
[7] Vial S, Gibon D, Vasseur C, Rousseau J. A fuzzy logic method for volume delineation in tomographic imaging. IEEE Trans. Med. Imag. 20:1362-1372, 2001
[8] Caudrelier JM, Vial S, Gibon D, Kulik C, Fournier C, Castelain B, Coche-Dequéant B, Rousseau J. MRI definition of target volumes using fuzzy logic method for three dimensional conformal radiation therapy. Int. J. Radiat. Oncol. Biol. Phys. 55:225-233, 2003.