Publisher’s version / Version de l'éditeur:
Review of Quantitative Nondestructive Evaluation, 23, 2004-02-26
READ THESE TERMS AND CONDITIONS CAREFULLY BEFORE USING THIS WEBSITE.
https://nrc-publications.canada.ca/eng/copyright
Vous avez des questions? Nous pouvons vous aider. Pour communiquer directement avec un auteur, consultez la première page de la revue dans laquelle son article a été publié afin de trouver ses coordonnées. Si vous n’arrivez pas à les repérer, communiquez avec nous à PublicationsArchive-ArchivesPublications@nrc-cnrc.gc.ca.
Questions? Contact the NRC Publications Archive team at
PublicationsArchive-ArchivesPublications@nrc-cnrc.gc.ca. If you wish to email the authors directly, please see the first page of the publication for their contact information.
NRC Publications Archive
Archives des publications du CNRC
This publication could be one of several versions: author’s original, accepted manuscript or the publisher’s version. / La version de cette publication peut être l’une des suivantes : la version prépublication de l’auteur, la version acceptée du manuscrit ou la version de l’éditeur.
For the publisher’s version, please access the DOI link below./ Pour consulter la version de l’éditeur, utilisez le lien DOI ci-dessous.
https://doi.org/10.1063/1.1711723
Access and use of this website and the material on it are subject to the Terms and Conditions set forth at
Laser-Ultrasonic Characterization of Thermal Spray Coatings
Bescond, C.; Lima, R. S.; Gilbert, A.; Kruger, S. E.; Levesque, D.; Marple, B.
R.
https://publications-cnrc.canada.ca/fra/droits
L’accès à ce site Web et l’utilisation de son contenu sont assujettis aux conditions présentées dans le site LISEZ CES CONDITIONS ATTENTIVEMENT AVANT D’UTILISER CE SITE WEB.
NRC Publications Record / Notice d'Archives des publications de CNRC:
https://nrc-publications.canada.ca/eng/view/object/?id=d02eb1d0-4095-4ec1-9ff0-e75bb92a87a9 https://publications-cnrc.canada.ca/fra/voir/objet/?id=d02eb1d0-4095-4ec1-9ff0-e75bb92a87a9LASER-ULTRASONIC CHARACTERIZATION OF THERMAL
SPRAY COATINGS
C. Bescond, R. S. Lima, A. Gilbert, S. E. Kruger, D. Lévesque and B. R. Marple
Industrial Materials Institute, National Research Council of Canada, 75 de Mortagne Blvd., Boucherville, Québec, J4B 6Y4, Canada
ABSTRACT. The laser-ultrasonic technique uses lasers to generate and detect ultrasound and present interesting possibilities for characterizing thermal spray coatings in a non-destructive manner. In this study, the thickness, density and elastic moduli of very uniform, dense and nearly isotropic TiO2 and WC-Co thermal spray coatings are evaluated by using laser generated surface
Rayleigh waves and surface skimming longitudinal waves. The elastic properties of the layer are obtained via an inverse procedure based on the minimization of the difference between the measured and calculated Rayleigh wave dispersion curves. The results are compared to the values obtained with an optical microscope for the thickness and the Knoop indentation technique for the elastic modulus. The agreement between the techniques is found to be excellent and laser-ultrasonics appears to be very promising for characterizing such materials. In particular, coatings deposited at high temperature on parts of complex shape could be characterized in-situ where other methods cannot be applied.
INTRODUCTION
In the increasing market of surface engineered materials, thermal spray coatings have a prominent place and are used for various reasons including for enhancing the wear and corrosion resistance and serving as efficient thermal barrier. The non-destructive characterization of thermal spray coatings is of particular importance to understand and/or model the mechanical behavior of coated materials as well as to provide an interesting tool for quality and/or process control. The laser-ultrasonic technique is a contact and non-destructive method that uses lasers to generate and detect ultrasound [1] and can be adapted to the elastic characterization of thermal spray coatings, in particular when using surface acoustic waves (SAW) [2].
In this study, the laser ultrasonic technique is employed to characterize thermal spray coatings, typically of 200-400 µm thickness, having low porosity (<1%) and deposited on a well-characterized low-carbon steel substrate. The coatings considered are made of WC-Co deposited by HVOF (High Velocity Oxy-Fuel) and TiO2 produced by HVOF or APS (Atmospheric Plasma Spray). These layers are very uniform, dense and nearly isotropic The thickness, density, Young’s modulus and Poisson’s ratio of thermal spray coatings are obtained from measurements of the surface skimming longitudinal wave
CP700, Review of Quantitative Nondestructive Evaluation Vol. 23, ed. by D. O. Thompson and D. E. Chimenti 2004 American Institute of Physics 0-7354-0173-X/04/$22.00
(SSLW) velocity and Rayleigh wave velocity dispersion. The inverse problem is solved by using an optimization procedure to minimize the difference between the measured and calculated Rayleigh wave dispersion curves. The resulting elastic properties are related to the tribological and mechanical properties of the coating such as the wear resistance and hardness.
In this paper, particular attention is paid to the characterization of the WC-Co coatings for which the best results have been obtained. Finally, the results for the thickness and the Young’s modulus are compared respectively with those obtained by sectioning and with optical microscopy and Knoop indentation measurements [3].
LASER ULTRASONIC EXPERIMENTS
The laser-ultrasonic experimental set-up is presented in Fig. 1. A pulsed Nd:YAG laser (3rd harmonic: 355 nm wavelength, 35 ps pulse duration) is employed to generate SAW in the ablation regime. An UV radiation with very short pulse duration is chosen to get good generation efficiency without damaging the sample surface. For the detection, a long pulsed Nd:YAG laser (1064 nm wavelength, 50 µs pulse duration) is coupled to an InP:Fe photorefractive interferometer by optical fibers. A photorefractive interferometer has been chosen instead of a Fabry-Perot for its better sensitivity to lower ultrasonic frequencies.
A line-source and line-detection configuration was chosen for this work to minimize the noise from the coating microstructure. In fact, line detection is similar to spatial averaging. The line dimensions are about 10 mm long per 50 µm wide for both the generation and detection. With this configuration, Rayleigh waves with a 60 MHz bandwidth can be generated and detected in low attenuating materials. A scanning system with a mirror and a translation table allows the SAW to be generated at different locations on the specimen while the line detection is kept fixed. As a result, precise SAW velocity measurements are obtained from different source-to-receiver distances, between 1 and 10 mm.
Pulsed Nd:YAG Laser (1064 nm; δ=200 µs) Translation table Sample Photo refractive interferometer INP:Fe
Pulsed Nd:YAG Laser (355 nm; δ=35 ps)
Pulsed Nd:YAG Laser (1064 nm; δ=200 µs) Translation table Sample Photo refractive interferometer INP:Fe
Pulsed Nd:YAG Laser (355 nm; δ=35 ps)
FIGURE 1. The laser ultrasonic experimental set up.
1 2 3 0 Dis p alcement (a. u.) Time (µs) SSLW Rayleigh Wave
FIGURE 2. Typical waveform.
In Fig. 2, a typical laser ultrasonic waveform is shown for a WC-Co coating on a steel plate. In this waveform, the discontinuities associated with the SSLW and the Rayleigh wave are indicated. The Rayleigh wave is found to be dispersive and an example of theoretical calculated velocity dispersion for the WC-Co case is shown in Fig. 3 using the properties in Table 1. The prediction of the Rayleigh velocity dispersion is a classical problem with solutions given by a characteristic equation that satisfies the free surface condition and the continuity of stresses and displacements at the interface between the coating and the substrate [4]. The WC-Co coating on steel substrate corresponds to the case referred in the literature as a slow layer on a fast substrate and exhibits only a slight velocity dispersion (less than 10 %) due to the small deviation between the acoustic wave velocities of the two materials. Classically, the Rayleigh velocity dispersion curve tends to the Rayleigh velocity in steel at low frequency and to the Rayleigh velocity in WC-Co at high frequency, see Fig. 3. Note that this dispersion curve possesses a minimum at intermediate frequencies. This minimum comes from the important difference between the density value of the WC-Co coating and that of the steel substrate.
TABLE 1. Material properties used in the calculation. Thickness (µm) Density (g/cm3) Longitudinal velocity (mm/µs) Transversal velocity (mm/µs) Rayleigh velocity (mm/µs) WC-Co coating 300 14 5.5 3.03 2.8 Steel substrate 7.8 5.8 3.2 2.96 0 5 10 15 20 2.7 2.8 2.9 3.0 VR layer Rayleigh V elocity (mm/ µ s) Frequency (MHz) VR substrate
FIGURE 3. Calculated dispersion curve of the Rayleigh wave for WC-Co on steel. 970
SENSITIVITY ANALYSIS OF RAYLEIGH WAVE DISPERSION
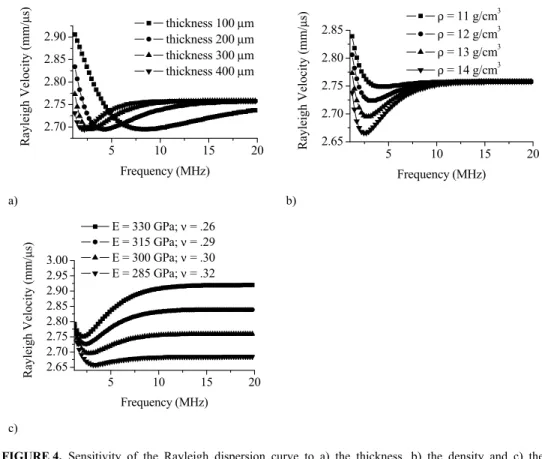
The theoretical sensitivity of the Rayleigh velocity dispersion to properties of the WC-Co coating was studied. In Fig. 4, dispersion curves have been calculated for different thicknesses, densities and elastic parameters, respectively. The existence of a minimum in the dispersion curve introduces a clear signature for thickness and density variations. The thickness seems to be related to the frequency of the minimum while the density seems to be related to the Rayleigh velocity at the minimum. Also, the elastic constants, i.e., the Young’s modulus and the Poisson’s ratio, correlate with the asymptotic behavior of the dispersion curve at higher frequencies. Therefore, the Rayleigh velocity dispersion for WC-Co coatings on a steel substrate is very sensitive to each of the above parameters. Note that, to measure precisely the thickness or the density from the Rayleigh velocity dispersion curve, the measurement of the minimum location is not enough since all the above parameters are inter-connected. An inverse procedure is then needed to find the optimal values of these parameters from Rayleigh velocity dispersion data.
5 10 15 20 2.70 2.75 2.80 2.85 2.90 thickness 100 µm thickness 200 µm thickness 300 µm thickness 400 µm R ayleigh V elocity (mm/ µ s) Frequency (MHz) 5 10 15 20 2.65 2.70 2.75 2.80 2.85 ρ = 11 g/cm3 ρ = 12 g/cm3 ρ = 13 g/cm3 ρ = 14 g/cm3 R ayleigh Velocity (mm/ µ s) Frequency (MHz) a) b) 5 10 15 20 2.65 2.70 2.75 2.80 2.85 2.90 2.95 3.00 E = 330 GPa; ν = .26 E = 315 GPa; ν = .29 E = 300 GPa; ν = .30 E = 285 GPa; ν = .32 R ayl eigh Velocity (mm/ µ s) Frequency (MHz) c)
FIGURE 4. Sensitivity of the Rayleigh dispersion curve to a) the thickness, b) the density and c) the Young’s modulus and Poisson’s ratio.
INVERSE PROBLEM
Characterization of the coatings involves the solution of an inverse problem which includes signal processing and an optimization procedure that minimizes the difference between calculated and measured Rayleigh velocity dispersion curves. A cross-correlation technique is used to measure the SSLW velocity, considered as the longitudinal velocity, and the Rayleigh velocity dispersion from signals collected at two source-to-receiver distances. Such velocity dispersion is obtained via Fourier transformation (FFT algorithm) of the cross-correlation function [5].
From longitudinal velocity and Rayleigh velocity dispersion data, the optimization process consists in minimizing the function:
[
]
∑ − f S V hMin V f V V f meas L calc R meas R ( ) ( , ) 2 , ,ρ (1)where h, ρ, VS are the unknowns, respectively the thickness, the density and the shear velocity, f is the frequency, VL is the longitudinal velocity, VR is the Rayleigh velocity and the superscripts “meas” and “calc” denote measured and calculated values. The minimization process is performed on a summation of the measured Rayleigh velocity dispersion data in the available frequency range. The minimization is performed with the Downhill simplex method [6] and provides optimal values for the three unknowns h, ρand
VS. The longitudinal velocity could be also optimized, but, in this work, we chose to measure and provide it as an input in the calculation, as discussed later in this paper. Note that the calculated Rayleigh velocity dispersion, VcalcR , also depends on the properties of the substrate, considered as known values. The Rayleigh velocity dispersion is calculated while assuming the coating to be isotropic. This has been verified experimentally for the WC-Co case and the result is not surprising since the coating is very dense.
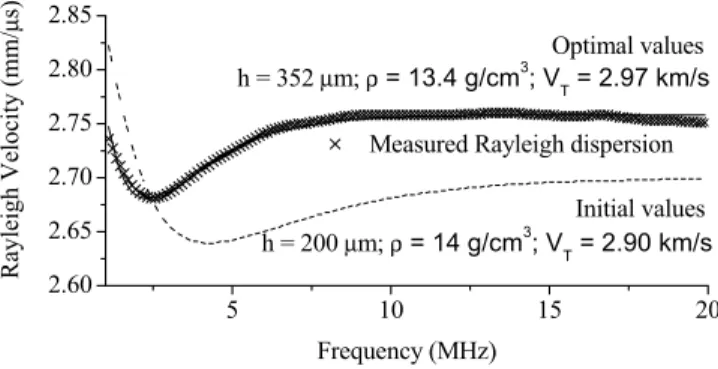
As mentioned, the longitudinal velocity is measured with the SSLW and is kept fixed during minimization, giving a better convergence of the minimization process. In fact, when the minimization is performed on the three unknowns and on the longitudinal velocity, the solution depends on the initial values injected in the process. This is not surprising since the high frequency limit of the dispersion curve is the Rayleigh velocity in the layer and different longitudinal and shear velocity combinations can give the same Rayleigh velocity. It was also verified numerically that a valley with fictitious minima usually appear. Therefore, the optimization is more robust by measuring and providing the longitudinal velocity in the minimizing process. In Fig. 5, an example of the optimization process is illustrated. The experimental data points are shown with crosses, the dotted line is the dispersion curve calculated with the initial values inserted in the minimization process and the solid line (nearly superimposed to the data) is the dispersion curve calculated with the optimal values found from solution of the inverse problem. Note that the algorithm converges to the optimal values even if the initial values are far from them.
5 10 15 20 2.60 2.65 2.70 2.75 2.80 2.85
Measured Rayleigh dispersion Optimal values h = 352 µm; ρ = 13.4 g/cm3 ; VT = 2.97 km/s Rayleigh Velocity ( mm/ µ s) Frequency (MHz) h = 200 µm; ρ = 14 g/cm3 ; VT = 2.90 km/s Initial values
FIGURE 5. Optimization process.
RESULTS
Measurements have been performed on eight samples having WC-Co coatings with different properties. In Fig. 6, the optimization results are shown for three of these samples where the squares, circles and triangles are the experimental data and the solid lines are the Rayleigh velocity dispersion curves calculated with the optimal values. The thickness, the density, the Young’s modulus and the Poisson’s ratio found with the above technique are indicated in the figure. Notice that the Young’s modulus, E, and the Poisson’s ratio, ν, are calculated from the density, the longitudinal and shear velocities issued from the minimization process using the relations:
) ( ) 4 3 ( 2 2 2 2 2 T L T L T V V V V V E − − = ρ , ) ( 2 ) 2 ( 2 2 2 2 T L T L V V V V − − = ν . (2)
The minimization process works very well since the Rayleigh velocity dispersion curves are perfectly superimposed to the data.
5 10 15 20 2.7 2.8 2.9 3.0 Optimal fit h = 367 µm; ρ = 14.2 g/cm3; E = 311 GPa; ν = 0.30 h = 251 µm; ρ = 13.4 g/cm3 ; E = 321 GPa; ν = 0.29 h = 205 µm; ρ = 12.9 g/cm3 ; E = 325 GPa; ν = 0.28 Rayleigh velocity (mm/ µ s) Frequency (MHz) FIGURE 6. Optimization results.
The results obtained with laser-ultrasonic SAW measurements were compared to those from destructive techniques. In Fig. 7, the thicknesses measured with laser-ultrasonics and with an optical microscope after sectioning are compared for the eight WC-Co coatings. It is observed that the data points are well fitted by a straight line, thus indicating an excellent correlation. Note that, for such coatings, the thickness is not uniform, as indicated by the error bars representing one standard deviation.
In Fig. 8, the Young’s modulus obtained with the laser-ultrasonic SAW technique is compared with values from the Knoop indentation technique. The coatings studied for this comparison are HVOF TiO2, APS TiO2, HVOF conventional WC-Co and HVOF multimodal (nanostructured and micro-sized particles) WC-Co. The correlation of the results obtained with the two techniques is excellent. Note that the uncertainty given by the Knoop indentation technique for the WC-Co coatings is very important. One reason for this result is that the Knoop indentation technique gives a relatively local measurement and that the WC particles in the coating are not uniformly dispersed.
An alternative to SAW measurements is bulk wave measurements. Even though the experimental setup could be simpler, through thickness bulk waves measurements do not allow measuring all the above properties of the coating since at best one gets only two experimental values (i.e. the longitudinal and shear time-of-flights or resonance frequencies). To overcome this limitation, two quantities (i. e. density and one velocity) could be fixed, but in practice this is not reliable since these parameters are very dependant upon the thermal spray process. Further, we verified that it was even difficult to get the measurements. Due to the laser impact disturbance, the transmission in the substrate and the attenuation in the coating, no shear resonance frequency was actually observed and the signal-to-noise ratio for the longitudinal resonance frequencies was poor. As a result, SAW measurement is more precise and provides a more complete characterization of dense thermal spray coatings.
200 240 280 320 360 200 240 280 320 360 Thickness me
asured with LUS SAW
Thickness measured with optical microscopy y=x
FIGURE 7. Comparison between laser-ultrasonic and optical microscopy measurements.
Knoop indentation Laser ultrasonic 50 100 150 200 250 300 350 400 450 500
Elastic modulus (GPa)
Measurement method
HVOF - TiO2 APS - TiO2
Conventional WC-Co Multimodal WC-Co
FIGURE 8. SAW LUS and Knoop indentation measurement comparison.
CONCLUSION
Properties of very dense thermal spray coatings were measured with SAW generated and detected with the laser-ultrasonic technique. The inverse problem was shown to provide simultaneously the thickness, the density, the Young’s modulus and the Poisson’s ratio from experimentally obtained SSLW velocity and Rayleigh velocity dispersion. As a result, a complete characterization of the coating was achieved with SAW measured at two source-to-receiver distances.
The sensitivity of the technique to the different properties of the coating was found to be excellent for WC-Co coatings. In addition, the minimization process was found to be very robust, mainly because the longitudinal velocity measured with SSLW was introduced as a known value in the calculation rather than an additional unknown.
Thickness and Young’s modulus values obtained with the laser-ultrasonic technique were compared to values from optical microscopy and from the Knoop indentation technique. The correlations were found to be excellent, demonstrating the usefulness of SAW combined with laser-ultrasonics to characterize dense thermal spray coatings in a non-destructive manner.
REFERENCES
1. Scruby, C. B. and Drain, L.E., Laser Ultrasonics, Techniques and Applications, Adam Hilger, Bristol, UK, 1990.
2. Abbate, A., Russell, W., Goldman, J., Kotidis, P. and Berndt, C.C., “Nondestructive determination of thickness and elastic modulus of plasma spray coatings using laser ultrasonics,” in Review of Progress in Quantitative Nondestructive Evaluation, ed. By D.O. Thompson and D.E. Chimenti, 18, Plenum, New York, 1999, pp. 373-380. 3. Marshall, D. B., Noma, T. and Evans, A. G., J. Am. Ceram. Soc. 65, C-175-176 (1982). 4. Farnell, G. W. and Adler, E. L., Physical Acoustics, Academic Press, New York, Vol.
2, 1972.
5. Aussel, J.-D. and Monchalin, J.-P., Ultrasonics 27, 165-177 (1989).
6. Press, W.H., Teukolsky, S.A., Vetterling, W.T. and Flannery, B.P., Numerical Recipes
in Fortran, Cambridge Univ. Press, NY, 1992.