Publisher’s version / Version de l'éditeur:
Vous avez des questions? Nous pouvons vous aider. Pour communiquer directement avec un auteur, consultez la première page de la revue dans laquelle son article a été publié afin de trouver ses coordonnées. Si vous n’arrivez pas à les repérer, communiquez avec nous à PublicationsArchive-ArchivesPublications@nrc-cnrc.gc.ca.
Questions? Contact the NRC Publications Archive team at
PublicationsArchive-ArchivesPublications@nrc-cnrc.gc.ca. If you wish to email the authors directly, please see the first page of the publication for their contact information.
https://publications-cnrc.canada.ca/fra/droits
L’accès à ce site Web et l’utilisation de son contenu sont assujettis aux conditions présentées dans le site LISEZ CES CONDITIONS ATTENTIVEMENT AVANT D’UTILISER CE SITE WEB.
Technical Translation (National Research Council of Canada), 1968
READ THESE TERMS AND CONDITIONS CAREFULLY BEFORE USING THIS WEBSITE.
https://nrc-publications.canada.ca/eng/copyright
NRC Publications Archive Record / Notice des Archives des publications du CNRC :
https://nrc-publications.canada.ca/eng/view/object/?id=1c0b05c7-eb55-487d-994a-8439e0841026 https://publications-cnrc.canada.ca/fra/voir/objet/?id=1c0b05c7-eb55-487d-994a-8439e0841026
Archives des publications du CNRC
For the publisher’s version, please access the DOI link below./ Pour consulter la version de l’éditeur, utilisez le lien DOI ci-dessous.
https://doi.org/10.4224/20358983
Access and use of this website and the material on it are subject to the Terms and Conditions set forth at
Strength studies of concrete on an actual job and of the corresponding
control cubes
Henzel, J.; Grube, H.; National Research Council of Canada. Division of
Building Research
It is frequently asked what relationship is
to be expected between concrete quality control
com-pression test results and similar results obtained
from tests on cores drilled from the structure.
More
generally, what inferences about the actual strength
of the concrete in the structure can be made from the
control cylinder results.
The investigation of these questions reported
in this paper was extensive and appeared to be a
valuable contribution to the rather sparse
informa-tion on the sUbject.
It was therefore thought that
a translation of the· report would be of value to
those in this country concerned with matters of
con-crete quality control and safety.
The Division wishes to record its thanks to
Mr. D.A. Sinclair, Translations Section, National
Research Council, for translating this paper and to
Mr. W.G.
Plewes of this Division who checked the
tra' slation.
Ottawa
June
1968
R.F. Legget
Director
Technical Translation 1327
Title:
Strength studies of concrete on an actual job and of
the corresponding control cubes
(Festigkeitsuntersuchungen an Bauwerksbeton und zugehorigen
Gutewurfeln)
Authors:
J.
Henzel and H. Grube
Reference:
Der Bauingenieur, 41 (12): 487-491, 1966
THE CORRESPONDING CONTROL CUBES
The present studies of control cubes for a comparatively large concrete construction, and of corresponding sample cores, were carried out in order to determine the difference in the magnitude and scatter of the compressive strength.
1. Introduction
In order to estimate the compressive strength of the concrete in a
structure, as a rule the examination of control cubes is employed. The
reliability of this method of estimation can only be appraised if the
actual structural strength at the time of the control tests is known. No
studies have recently been published clarifying this relationship. In the
years 1909 to 1913 tests of this kind were carried out at the Materials Testing Institute of the Technische Hochschule Darmstadt(l), but on account of the widely scattering results, which were few in number and derived from many different sites, no clear relationship between cube strength and structure strength could be found.
Compressive strength studies have now been carried out on a large number of control cubes and sample cores of the same age and from closely
related concrete on an especially suitable building site. On this site,
a rather large amount of concrete with the same rated composition was installed over a comparatively long time, so that moisture content variations were inevitable.
The results of the concrete studies are appraised with the aid of mean
value and scatter figures. For this purpose we have a large enough number
of individual values so that the difference between the compressive strength of the concrete of the control cubes and of the structure itself can be
estimated. For the present, however, the results hold only for this
individual case, because it depends on the particular nature of the 「オセャ、ゥョァ
site, and hence on the following influences: personnel factors,
effective-ness of supervision of the preparation of the concrete, available equipment, kind and quantity of concrete, quality and uniformity of delivered building materials, period of time of concreting, and exposure to weather conditions and the outside temperature.
Before any general estimate of the possible strength differences can
be made, additional investigations of a similar type are necessary. However,
these are of no value unless they are carried out on bUilding jobs of a kind that will pernit their careful 。ーーセゥ」。エゥッョN
Since the strength ッセ a structure cannot be reliably determined with
non-destructive testing methods, specimens of the concrete being used have
to be spot checked. For this purpose, sample cores are the least expensive.
However, the following questions remain unanswered:
What is the ratio of sample core strength to the compressive strength of a 20 cm cube?
Does the concrete structure of the sample core experience any damaged which reduces its strength?
What is the effect of differences in the processing of the bearing surfaces on the cylinder str>ength?
Laboratory tests have shown that the strength values of sample cores of 15 cm diameter and 15 cm height, which have been smoothed with a thin layer of sulphur cement, agreed with the compressive strength values obtained
from corresponding cubes of 20 cm side. Thereafter the results of the sample
cores studied could be compared directly with the control tests.
2. The Structure Under Investigation
The investigations were carried out on a foundation slab with dimensions
142.5 m x 97.5 m x (0.8 to 2.0 m) セ 17,500 m3
• The concreting period
extended over 3 months. The sequence of concreting segments, the amount of
concrete per segment and the growth of the construction are represented in
Figure 1. The foundation slab was furnished with an amount of reinforcement
unusual in mass concrete.
The structure was erected by four large construction firms working as a team, which were kind enough to support the investigations.
The aim was to produce a mass concrete with a low heat generation but little shrinkage tendency, and which would have a cube strength at the age
of go days equal to 300 kg/cmz . For this purpose we used blast furnace
cement HOZ 275. The cement content of the green concrete was about 300 kg/m3•
The aggregates consisted of sand and gravel from the Main River district with
grain sizes of 0 - 3 mm, 3 - 7 mm and 7 - 30 mm. According to the instructions
could be obtained on the effective water-cement ratio, since the aggregates
were very hygroscopic. The slump of the green concrete was approximately
38
cm. In order to reduce the amount of mixing water, Plastocrete D 600 wasadded in powdered form with the aid of a volume-measuring container. Owing to the large amount of building materials required during the concreting time, considerable supplies had to be kept on the building site.
The aggregates were kept in two unroofed batching bins. The blast furnace
cement was housed in four silos. The concrete was mixed in two rolling and
kneading mixers of 1000 litres capacity each and was then pumped by means of a Torket concrete pumping system through pipes of 180 mm diameter and
up to 180 m length to the point of installation. At high outside
temperatures the pipelines were wrapped in wet rags in order to prevent excessive increases in the green concrete temperatures as far as possible. At the installation point the green concrete was consolidated with the aid
of an immersion vibrator. The concrete was then covered with straw mats.
3.
Quality StudiesThe scope of the quality tests was determined in accordance with the
requirements of DIN 10 115. Beyond these requirements the contractors took
additional sample cutes for their initial orientation at tte ages of
7
and28 days. The scope of the cube studies at concrete ages of 28 and 90
days is indicated ゥセ detail in Figure 1. The cubes were produced by the
team of contractors in tte concrete laboratory at the building site. As
required, the concrete for each cube was taken separately from the place
of installation. The cubes were subjected to standard tamping, then,
after two days, they were stripped and stored for five days in a heated
cupboard at 200C and about 100% relative humidity, 7 days under water, and
finally were retained for study ゥセ the testing room at about 200C and
varying relative humidity. The
7
and 28 day tests were carried out by oneof the participating firms in the laboratory. The studies of the
go
dayold specimens were undertaken here.
4.
Securing of Sample CoresThe sample cores were obtained with the aid of a drill specially designed for this purpose by the institute, and which, owing to excellent drill crown gUiding, rendered economic drilling possible despite the high
all sample cores 0 - 20 cm high contained reinforcement rods. The number of drilling places corresponded to the number of control cubes that had
been manufactured. At 93 places, two sample cores were taken, at 17 places
three and at 7 places four. Figures 1 indicates the depth of drilling and
the number of sample cores taken from a concrete segment.
Up to segment no. 22, drilling was first carried out 2 days before
examination, and then up to
3
weeks before. The sample cores weretrimmed to H
=
D=
15 cm and their end faces were smoothed with a thinlayer of sulphur cement. They were then kept in the testing room along with·
the corresponding control cubes until tested. 5. Supplementary Tests
For a single comparison, specimens of the aggregates and cements were taken, and green concrete was produced with them in the institute
for
6
cubes of 20 cm side. In doing so the mixture proportions specifiedby the contractors at the time of sampling were observed, but without using
the plasticizer. The quantity of water added was measured so that an
expansion of about 34 cm resulted. Tllree of the sample cubes were subjected
to standard tamping and three others were consolidated by vibration
(f = 2800/sec; U
=
800 kg; vibration time t=
15 sec). The specimenswere wrapped in wet bags and kept under a plastic cover.
In order to get an idea of the uniformity of the cement properties, 22 cement specimens were examined according to RILEM-CEM by some of the contracting firms, as well as in the institutes.
Since the aggregates were delivered in three grain sizes, it should have been possible largely to equalize the final overall grain distribution even when variations occurred in the individual groups of grain sizes
resulting from varying components. The extent to which this actually took
place may be considered characteristic of building sites. Therefore, there
was no inspection of the aggregates for uniformity during the building period.
6.
ResultsIn the aLove report no separate values have been stated. These were
published in Issue 12 of the Mitteilungen des Instituts fUr Massivbau der THD. Figures 1 indicates the number of control cubes and the number, depth
and distribution of the sample cores. A total of 125 control cubes and 254
sample cores were examined at a concrete age of 90 days, and 82 cubes were examined at an age of 28 days.
Table I contains information concerning the number of specimens, the
mean compressive strength and the standard deviation. We also calculated,
according to stange(2), the lower limits of tolerance for reliable results
a
=
95% and the probability of a one-sided occurrence p 5% (5% fractilevalues). The corresponding strength values are denoted by min So.os.
In the concrete inspection, extremely high cube strength values were
obtained for concreting segment 14 (see Figure 2). Enquiries revealed that
on this day a different kind of cement had been made. Thus the cube results
for segment 14 were not employed in subsequent evaluations.
The test mixture produced in the institute, together with the samples of building materials obtained from the building site, showed the cube
strength values of Table II after 116 days. For comparison this table also
contains the results of three control cubes which were produced at the build-ing site in the course of samplbuild-ing the buildbuild-ing materials in steel forms,
treated with pump grease, that belonged to the institute. They were stored
at the building and then examined in the institute. Table II also gives
the results from 6 control cubes of concreting segment 24, which had been manufactured on the same day at the building site and later examined in the
institute. Figure 2 also contains the results from 6 control cubes of
concreting segment no. 24, which were produced during the same day and were
later examined in the institute. All the cubes produced on the building site
are thus ゥュセ・、ゥ。エ・ャケ comparable with respect to green concrete, subsequent
treatment and examination.
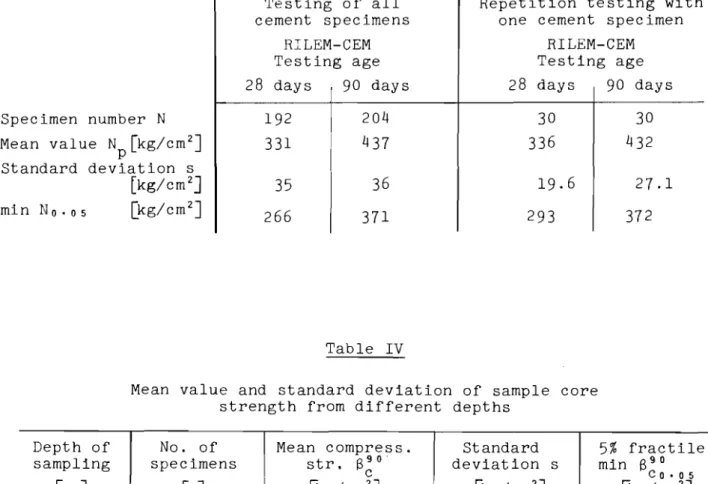
In the RILEM-CEM cement tests the values shown in Table III were obtained. In addition, repetition tests were carried out with cement of the specimen
taken on the 63rd day after the start of concreting. The results of this
are also contained in Table III.
7. Evaluation 7.1 Development of strength
In order to estimate the increase of hardness, mean 28 and 90 day cube
strengths are plotted in Figure 2. The average ratio found is S28 : S90 equals
w w
0.78. The maximum and minimum ratios are 0.90 and 0.66.
In the standard cement tests an average ratio of N : N 0 equals 0.76
P28 p9
was obtained, with a fluctuation between 0.64 and 0.84. Quite accidentally,
therefore, there is good agreement with the sUbsequent hardening of the control cube.
7.2 Strength values of the structure over the height of the cross-section In Table IV we have the mean values of the core sample compressive strength at the age of 90 days (S90) as well as the standard deviations and
c
the 5% fractile values, classified according to depth of sampling. In order
to test the relationship between the sample core compressive strength and the depth of sampling, in each case groups of sample cores lying immediately above one another were subjected to a t-test(3).
From the values represented in Table V it follows that between the
compressive strengths at the depths 20 - 40 and 40 - 60 cm or 40 - 60 and
60 - 80 cm there is no significant difference. Between depths 0 - 20 and
20 - 40 cm, however, a significant difference cannot be ruled out. However,
for subsequent evaluation purposes the summarizing of sample core strengths from all depths appears justified.
7.3 Ratio of sample core strength to control cube strength
In Figure 3 the mean sample core and control cube compressive strengths
(concrete age 90 days) and the corresponding ratios S ISc w are plotted. The
overall mean of ratio values was 0.79. This value was also obtained for the
quotient aM
=
S
c18
w from the mean values of all sample core and cubecom-pressive strengths.
For a fuller understanding we have the frequency distribution of all
possible ratios a and the fractile values to be expected for them. In
determining these coefficients it should be borne in mind that the separate sample core and the cubic strength values do not belong in pairs.
It was assumed that the random sample results and the strength values of the basic population have a normal distribution, and that mean value and
standard deviation of the two random samples (Bc ' Sw) describe with sufficient
accuracy the corresponding characteristic values of the basic population
involved. Thus セ
=
x
and 0=
s were put. This assumption appears justifiablefor the given scope of random samples (Nc
=
254, Nw=
122) and the shape ofthe total frequency curves in the probability grid (Figure 4). A numerical
testing by Kolmogorow's method also showed that this hypothesis must not be rejected, even though a value cannot be stated for the "strictness" of the normal distribution.
From the thus determined density functions f(S ) and g(S ) we canc w
calculate the density function q(a)
=
f(S )/g(S ) according toc w ef.(4).This function contains the mean values and standard deviations of the initial
functions and the integral ljJ (>..)
=
(2/rrr)te-t2dt.
A numerical evaluationt1'fie=±5,Skg/em',A
s.
=±8,6 kg/em'c.,ll= 0.79±0,024
distribution given in Figure 5 for a (sum frequency curve). As is clear from the shape of the curve, the distribution of a is skew-symmetrical (positive skew) .
It gives the fractile values shown in Table VI, column 2. The 50% fractile aO.50 agrees with the initially mentioned proportion aM = 0.79.
As a check, all possible proportions a i k = Bci/B
wk were formed from the available random sample values (Na
=
Nc . Nw
254· 122 = 30,988). For this the sum frequency curve also shown in Figure 5 was obtained. It yielded the fractile values presented in Table VI,-column 3, which agree for all practical purposes with the corresponding values of the completely determined distri-bution function Q (a).Finally, the confidence region of the above-mentioned mean proportional value aM was investigated. The mean error rna also determined the deviations
LIp
= ±ys/rr;-(y two-fold p% boundary of the student distribution for the degree of freedom n - 1) of the mean values of the sample core and cube compressive strengths according to the law of propagation of errors was obtained as
m.=
(LlPr/P,J
+(ii;.
Ap,o/p:l.
In the present case, for a fallout probability of 5%, the following was obtained.
7.4 Possible causes of the differences in strength of sample cores and cubes According to Table I, at an age of 90 days the mean strength of the structure was 286 kg/cm 2, which is 21% lower than the mean strength of the concrete of the control cube, which was 361 kg/cm 2. The scatter of individual values, expressed by the standard deviations, are approximately equal for sample cores and cubes, namely 43 and 45 kg/cm 2, respectively. For cube strength at the age of 28 days, a value of S28 = 28 kg/cm 2 was obtained.
According to the empirical values of RUSCh(5), on well-run building jobs a standard deviation of the cube strengths of s = 35 + WM : 30 may be expected.
For 90 day values, therefore, S90 = 35 + 361 : 30 = 47 kg/cm 2 and in the case
2
of 28 day values S28 = 35 + 288 : 30 45 kg/em. Accordingly the concrete
on the building site in question was very uniform.
As causes for the lower compressive strength of the structural concrete, we may cite poorer green concrete consolidation, greater separation of the water of mixture in the manufacture of the cube, and a higher hardening temperature in the construction.
As a measure of the green concrete consolidation obtained, the bulk
density may serve as an approximate value. The values of Table VII were
obtained for cubes and sample cores 90 days old. No difference between the
consolidation of cube and structural concrete can accordingly be detected, since the mean solid concrete bulk densities are practically the same.
As the results of the supplementary investigations in Table II show, in the case of the processed concrete there was no gain in strength as a
result of consolidation by vibration (324 : 315
=
1.03).However, part of the difference in strength may be attributed to the different reduction in the W/Z value in cube and construction, respectively, due to separation of water of mixture in the course of consolidation,
according to the results of Table II (382: 410
=
0.93), although theprocessed green concrete showed no tendency to segregate.
Although the control cubes were stored at +200C and owing to their
small size would have reached only slightly higher temperatures, temperatures
of over 400
c
were measureQ in the structural concrete. As our own laboratorytests showed, the storing of concrete cubes in water of 450C compared with
others stored at 200C resulted in a loss of strength after 28 days of
approximately 10%. Similar results were obtained with brief heat treatment
of the concrete(6).
It has already been pointed but that for concretes of the quality in
question here and with the type of testing that has been described no loss of strength in the sample cores may be expected either from the drilling or from the testing.
The extent to which the individual effects contribute to the difference
in strength, of course, is still unknown; the purpose of this summary was
to show that the difference in strength cannot be explained simply by "poorer workmanship" at the building site.
7.5
Effects governing the scatter of concrete strength valuesVariations of quality in concrete are, of course, due to numerous
causes. It would scarcely be possible to determine the influences of the
individual parameters in the course of building site activity. As mentioned
previously, all these hidden influences can be regarded as characteristic of the building site and in the evaluation they may be attributed to "chance". Only the effect of strength fluctuations of the randomly sampled cement is
to be studied additionally here. The standard deviation will be used as a
In the following investigation it is assumed that the standard deviations of the cube and cement strength determined from random samples are in each
case equal to those of the corresponding basic population. Since this
assumption is not quite correct, the result can serve only as an initial
orientation value. Further inaccuracies are derived from the still inadequate
scope of the investigation for determining the test fluctuation spZ of the cement and in the determination of the relationship between the compressive strength of concrete and the standard strength.
The standard deviation of the cement strength is made up of two
compo-nents, namely the test strength spZ and the quality scatter sQZ. Since only
the second component can affect the strength fluctuations of the concrete, the standard deviation determined in the cement tests must be divided into these components.
According to Meyer(7) in repetition tests according to DIN 1164 on the
same cement PZ 275 in every case a test scatter of spZ
=
10 to spZ=
26, oran average of spZ = 18 kg/cm2 is obtained. Corresponding repetition tests
in the institute using a small number of specimens resulted in the following
average standard deviations in kg/cm2
; Test Method RILEM-CEM Number n [-] 30 Age 28 days 90 days 20 27
Accordingly, the assumption of spZ
=
26 kg/cm2 in accordance with ref. (7)appears justified. The quality scatter of the cement employed at an age of
90 days is found to be S90
=
1362 - 262=
25 kg/cm2 • If the standardQZ
deviation of the concrete compressive strength sB is to be brought into
relationship with the standard deviation sQZ' the relation between the concrete
strength and the cement standard strength must be known. From general
experience (cf. ref. (8» the concrete compressive strength under otherwise
equal conditions increases by the same percentage as the standard strength
of the cement. In our case the ratio of mean values for a test age of 90
days is found to be
a
9 0: N 90 = 361: 437
=
0.83.w
pThis regularity should also hold for the standard deviations; that is to say,
the component sZB caused by sQZ of the standard deviation sB of the concrete is found to be
S90 = 0.83 . 25 = 21 kg/cm2 •
the
to cube strength was found, with In some of the individual con-If the concrete at the building site were produced from a cement without
strength variations, then the standard deviation sB
=
145
2- 212 40 kg/cm2
would be obtained. Accordingly, in the present case around 10% of the standard
deviation found in the concrete quality tests could be explained by variations in the strength of the cement employed.
8.
SummaryFor the erection of a concrete work of considerable size, investigations were instituted into the difference between the construction strength and the strength of the corresponding control cubes as well as the scatter of
the individual values. The selected construction was especially suitable
since a rather large amount of concrete of the same rated composition was being produced over a considerable time and the quality Lests could be carried out at a concrete age of 90 days.
In accordance with the size of the object, the building site was well
equipped in relation to the ideas prevailing at the time. The results obtained
apply only to this one building site, of course, but they show that appreciable differences can arise between the strength of the control cube and that of
the structure. The decrease of strength in the structure compared with the
control cube in the present instance averaged about 20%. The scatter of
individual values was approximately the same for cubes and sample cores;
standard deviations were about
45
kg/cm2•The mean ratio of sample core strength
95% probability, to be ao.so
=
0.79
± 0.024.creting segments, however, definite departures from the mean value occurred. These variations were characterized with the aid of the fractile values.
The fractile values 5% and 95%, for example, were found to be ao.os
=
0.56and aO'9S = 1.00.
References
I. O. Rrrur!t 11. QセN Preuss: V('rsudrc zum Vcrd('ilh dcr
WiirCd-HヲセウHェァォHGゥエ lit's Bl'tllllS :1'1def nn Uall\\'('rk crzu-ltcn Ft·.<ttigkdl. Dcut-セ、QHGイ Q|ャiAGゥウャセャャャャャ f. I':iwllltl'lon If.:m IfJ!.').
2. 1\.. SI(IIII-:C: Die Ih·rt,dlllllllg von ャGゥョウャGゥイゥセHGョ tHIャ・イョョWNセイHLGhGNャセョ
nus Mtttt-iwert iuul sゥ。ョ」ャ。イ、ZャィキャGゥ、ャャャョセ chu-r Pro he. QlIl1litiitJII:" konlrollo 1I11d Opcr.uionul hHGセー。イ、ャ JD:->R 7/8 S.84.
3. A. Ullrler: Stati.,ti.,dlC Mvthorlcn 3. AuR. Hascl II. Stuttgnrt , ninl<h,iu"'r Verlaf' !!JuO.
4. J. ll cinhol« u, K.-W. Gaede: Ingenieur-Stntistlk, Miinmcnf Wien; I\. Ol<!enhourl: Verlal: Inr,4.
5. 11. Jlji.,d" Dr-r ElIlflufl dcr Streuung bci dcr Belonkonlrolle.
Der Bauinzcnieur 37 (1%2), 11.10, S.373.
O.K. Wal.: Dcr EinRul3 einer Wiirmchchandlun/( auf die Festig-kcit von Beton all.'; vcrsduedenon Zcmcnte n. Botonn-dmisdie
Be-rtdue !!JUO, S.29, Dusseldorf: Bcton-Vcrlo c 1901.
7. A. Meyer: Anwendung stutisrisdror Methoden br-Im Auswertcn
von Zcmentfcs'Igkeitsprufunge». Tontndnstrrc-Ztg. 88 (1064), Nr, 17/18
S.3R9.
R. A. Markrstod II. A. nu";or<1: Untr-rsudumgon von Zemenl-priifmelhoden und ,lcr Knrrclalion zwisdien Zcmcnlfcsli/(kcil und Bctcnfcstigkclt. Zcmcnl,Kalk, Gips. H. I, 1005, S.I3.
Table I
Number of specimens, mean value and standard deviation of compressive strengths
No. of Mean compress. Standard
5%
fractilespecimens strength deviation min B0 • 0 5
n [-] [kg/cm2] [kg/cm2] [kg/cm2] Sample cores at
254
286
43
209
age of90
days .-'--- - -"---"-'--'---_ _..0_- _._---.._._---_.- .MMMMLMMMMセ --Cube at age of122
361
45
276
90
days -Cube at age of79
282
28
227
28
days Ratio B9 0 : B9 0-
0.79
-
-c w Table II
Compressive strength of control cubes from different cube forms and with different degrees of consolidation
Solid con- Testing
Place of crete density age Compress. str.
fabrication Consolidation /}:g/dm
3J
[days] B [kg/cm2]w
Sep. val. Av.
Standard tamp-
2.32
322
ing in closed2.33
116
295
315
Institute forms2.31
328
Vibrated in2.33
331
closed forms2.33
116
316
324
2.33
325
Standard tamp-2.28
386
ing vibrated in2.27
92
384
382
Building closed forms
2.27
375
site Standard tamp-
2.29
401
Lng in normal2.29
424
build.ing site2.29
92
426
410
forms2.28
389
2.27
415
2.28
407
Table III
Results of RILEM-CEM cement testing
Testing of all cement specimens
RILEM-CEM Testing age
28 days 90 days
Repetition testing with one cement specimen
RILEM-CEM Testing age 28 days 90 days Specimen number N 192 204 Mean value N [kg/cm2 ] 331 437 p Standard deviation s [kg/cm2] 35 36 min No , o 5 [kg/cm2] 266 371 Table IV 30 336 19.6 293 30 432 27.1 372
Mean value and standard deviation of sample core strength from different depths
Depth of No. of Mean compress. Standard 5% fractile
sampling specimens str. 90' deviation s min
B
90B
c c e . 0 5 [cm]n[- ]
[}cg/cm2] [kg/cm2] [}cg/cm2] 0 - 20 112 279 42.7 197 20 - 40III
290 41.1 211 40 - 60 24 292 43.0 194 60 - 80 7 300 (52.8)* (33)*o -
80 254 286 42.5 209Table V
Comparison of compressive strength of sample cores taken from different tests with the aid of the t-tests
Depths Depths Depths
0
-
20 cm 20-
40 cm 40-
60 cm20
-
40 cm 40-
60 cm 60-
80 cmt-test 2.46 1. 49 (1.50)*
No. of specimens
from that depth 106 24 (7)*
Probability P(%) 95<P<99 P<95 (P<95)*
* Too small a sample.
Table
VI
Fractile values of the quotient a
=
Bc/BkFractile values 1 a0 • 2 0 aO. 50 a0 • 80 a0 • 90 From distribution function Bc a = Sw 2 0.56 0.61 0.67 0.79 0.93 1. 01 1. 09 From sum frequency curve Bc ' a = _ _l BWk 3 0.57 0.61 0.67 0.79 0.93 1. 01 1. 08 4 0.79 Table
VII
Solid concrete bulk density of control cubes and sample cores Solid concrete bulk density
Min. value Mean value
[kg/d m3] Max. value Control cubes Sample cores 2.23 2.21 2.28 2.28 2.36 2.42
IIPm'"
j +1zom'([) 8t.m1@1°..."セjャWュQrv,.,1Ii
@mm' @",,.,. 1!iP1l."" fii;iJ'Omt: セM !.i!.Lt . セ 11 Al .1L ?L"
:" I-+ +-r---
+ + + セ + + + [illJ0 -+ + + -+ -_±_- -+ +"'""@
!! + + + -+ + + + +um
[ill] + + 0lJ[ill] 0IJnm
[ill] [ill] [ill] lIJIJ(D5frmJ-?'-@5tomJ @ ...mlI @tnm' @JlOm ' `GUWセ H7oKj) oltllm'@ -t-"R1OmJ
fjf.
セッQ。^ュG E I t e 11 I !L セK !L s: + + It+!l-i;; + +1 [ill] +[ill]
...
[Ill! [ill] [ill] 11+ + +[ill] + -t IllIJ
-zm [ill] + [ill] +
(i).tlm' I@""m' 0."m' @mm' "''''m'0
r
.«I1m'@セNNNLュャ +570"")1> ュュjセ GzャュZセIk' l ! L • it + .!1 + lU !...,
+ + +
-+1m] -+ [ill)
+ + + +
•
+ [ill)IlJlIJ + imJl+[ill] [ill] [ill] + +
rnn
[ill] -'- [ill]...
.) +I@ セBBLュG
I@
/®
@ + @I@
セセッエijiiGB + セ + I,
+ + +•
•
+ + + + -+ + rrm + rIm iセ I f- "'1,5m0
Progressive pouring segments, followed by amount of concrete m3i Number of days after pouring
セ ba number ofnumber of
28
day cubes90 day cubes
+ Drilling depth
40
cm 2 sarrple cores-?-
Drilling depth 60 cm 3 sample cores+
Drilling depth 80 cm4
sample coresFigure 1
Plan of the foundation slab, order of pouring,
Cone. age 90 days* Cone. age 28 days* <> "'$: ClJ. ec
'"
セ ClJ.Td!
·rl0 .j..) co セ OJ .j..) OJ H o C o oce;
RooエMMMMMKMMMKMMヲMMMKMMMKMセMMKMM ({J 00 ({J 70 lIJ 30 "0 50 GO 80 OJH Days after pouring
0..
S I I II III III I I III 1111 III I I lit II II I II
0 18 1'1 S 1 , 10
n
1115 11 18 ZIJ Z1 lJ ZUi 18 .1J 11 J1 0 i J 1Z'"
1119 11 JUT 11 11 Jif Pouring segments.t
WPPQMMMMKMMMKMMKMMMMKMMMKMMセ ({J .. GOO'r--,---,---,---,---r--r---,r---,---,---., akg/em?
"::2
500r--II--t---t:t-i-T---t-t==i===L
* Every point represents the mean value of the results for one pouring segment
Figure 2
Mean compressive strengths of concretes in control cubes
aged 28 days and 90 days, and the ratio
e
2 8 :e
9 0*
Every point represents the mean value of the results for one pouring segment" ' 0 en II 3J 311 e 0,710,50 J2 11 13 15 1618 ZO 22 23 211 Zf 28 .1J 72 111. 1719 21 2527 29 J1 Pou ri ng segment s Rat .0
fJf:p90
30 1ft) 50 6'0 70 80Days after pouring
!I III IIII I I I I I II I II II I I I I III II I TZH57810 6 9 lfJ lfJ ill H o, E o o 0 BGセen 6'OD '0 ko/cmz c 5fX) (lj " ' 0 en ill .p ill セ 0 c 0 0 c... 0 セ 00 .p TO 20 lfJ Figure 3
Mean compressive strengths of concrete of control cubes 89 0
and sample cores 89 0 at the age of 90 days, and the ratio
c 8 9 0 : 69 0
300 J'IO 380
kg/cm
Zlf6'O Compressive strength of cube---+---
f----V
I - - -!--7
V
'1
ssumed normal/ distribution unctionセ
pIe valul
#
I
V/
)
/ //
n AセQM
j-jf-1--- ---r-MMMセMイ[M -
"
,l.(1
I
-,;V
andom s arFセヲャ
t/
/ . III
II Z 1 200 2110 280 )20 kg/cmZ"oo 260 Compressive strength of sample core 20 10 90 80 60 Co-< o セ Q) JJ1§
982
9& Figure4
Distribution of' compressive strength of sample cores and cubes (sum frequency curves) and calculated distribution function.
60 / / / /V iセy ! - - - - -- - - ' - - - Mセ・MM - - -
---lL
--- - - - - - ---- 1 - - -V
/
-
---+--- --- ---b/----
--- ---! - --- l - - -[/--1--
---Distribution ---.._-1-----7
___ function Q (a) _--- Sum freq. curve
/ 1--- ___