HAL Id: hal-02557291
https://hal.univ-lorraine.fr/hal-02557291
Submitted on 28 Apr 2020HAL is a multi-disciplinary open access archive for the deposit and dissemination of sci-entific research documents, whether they are pub-lished or not. The documents may come from teaching and research institutions in France or abroad, or from public or private research centers.
L’archive ouverte pluridisciplinaire HAL, est destinée au dépôt et à la diffusion de documents scientifiques de niveau recherche, publiés ou non, émanant des établissements d’enseignement et de recherche français ou étrangers, des laboratoires publics ou privés.
as a prognostic factor in patients admitted for worsening
heart failure from the ICALOR cohort study
Masatake Kobayashi, Matthieu Bercker, Olivier Huttin, Sarah Pierre, Nicolas
Sadoul, Erwan Bozec, Tahar Chouihed, Joao Pedro Ferreira, Faiez Zannad,
Patrick Rossignol, et al.
To cite this version:
Masatake Kobayashi, Matthieu Bercker, Olivier Huttin, Sarah Pierre, Nicolas Sadoul, et al.. Chest X-ray quantification of admission lung congestion as a prognostic factor in patients admitted for worsening heart failure from the ICALOR cohort study. International Journal of Cardiology, Elsevier, 2020, 299, pp.192-198. �10.1016/j.ijcard.2019.06.062�. �hal-02557291�
Chest X-Ray Quantification of Admission Lung Congestion as a Prognostic Factor in
Patients Admitted for Worsening Heart Failure from the ICALOR cohort study
Masatake Kobayashi*, 1 MD; Matthieu Bercker*,2 MD; Olivier Huttin, 2 MD, PhD; Sarah Pierre, 2 MD; Nicolas Sadoul, 2 MD; Erwan Bozec, 1 PhD; Tahar Chouihed, 1 MD, PhD; João Pedro Ferreira, 1 MD, PhD; Faiez Zannad, 1 MD,PhD; Patrick Rossignol, 1 MD, PhD; Nicolas Girerd, 1 MD, PhD.
* These authors contributed equally to this manuscript and should be considered as co-first authors.
1
: Université de Lorraine,Inserm, Centre d’Investigations Cliniques- 1433, and Inserm U1116; CHRU Nancy; F-CRIN INI-CRCT, Nancy, France.
2
: Department of Cardiology, University Hospital of Nancy, Nancy, France.
Running title: Radiographic Congestion Scoring at admission in Patients with Worsening Heart Failure
Corresponding Author: Nicolas GIRERD
Centre d'Investigation Clinique Pierre Drouin -INSERM - CHRU de Nancy, Institut lorrain du coeur et des, vaisseaux Louis Mathieu, Nancy, France
Address: 4, rue du Morvan. 54500 Vandoeuvre-Les-Nancy
E-mail: n.girerd@chru-nancy.fr Phone: +33383157496 Fax: +33383157324
Abstract
Introduction: Chest X-ray (CXR) widely used, but the prognostic value of congestion quantification using CXR remains uncertain. The main objective of the present study was to assess whether initial quantification of lung congestion evaluated by CXR [and its interplay with estimated plasma volume status (ePVS)] in patients with worsening heart failure (WHF) is associated with in-hospital and short-term clinical outcome.
Methods: We studied 117 patients hospitalized for WHF in the ICALOR HF disease management program. Pulmonary congestion was estimated using congestion score index (CSI, range 0 to 3) evaluated from 6 lung areas on CXR. Systemic congestion was assessed by ePVS. Logistic regression analysis was used to assess length of stay and the composite of all-cause death or HF re-hospitalization at 90 days.
Results: Patients were divided according to the median of admission CSI (median=2.20) and ePVS (median=5.38). Higher CSI was significantly associated with higher pulmonary arterial systolic pressure in multivariable models. Multivariable models showed patients with high CSI/high ePVS had a 6-day longer length of stay [OR (95%CI)=6.78 (1.82-29.79), p<0.01] and 5-fold higher risk of 90-day composite outcome [OR (95%CI)=5.13 (1.26-25.11) p=0.03] compared to patients with low CSI/low ePVS, while other configurations (either isolated high CSI or high ePVS) yielded neutral associations. Furthermore, CSI and ePVS significantly improved reclassification on top of clinical covariates for the composite outcome [Net reclassification index=37.3% (0.52-87.0), p=0.046].
Conclusion: An admission assessment of pulmonary and systemic congestion in WHF patients using CSI and ePVS can identify a cluster of high-risk patients at short-term outcomes.
Keywords: lung congestion, worsening heart failure, congestion score index, plasma volume, prognosis
Introduction
Worsening heart failure (WHF) is a frequent cause of hospitalization worldwide and is associated with a high short-term risk of HF re-hospitalization and death 1, 2. Most hospitalizations in patients with HF are the consequence of congestion 3. Our group 3-5 and others 6-8 have demonstrated that residual congestion is strongly associated with outcome. The value of congestion quantification at admission is however less well documented and its evaluation remains difficult 3, 5 despite the advent of new tools including lung ultrasound 5, 9. Importantly, two major components of congestion should be distinguished: i) pulmonary congestion (which is associated with increased left ventricular filling pressure 10
and pulmonary artery systolic pressure 11 and ii) systemic (peripheral) congestion which is associated with increased right atrial pressure 12. However, the interplay between these two congestion components is yet to be determined.
Chest X-ray (CXR), which was until the 1980s the only test performed to help the diagnosis of WHF, is almost considered nowadays to be an obsolete tool and has been replaced in many indications. However, in addition to the diagnostic value recommended by the current guidelines 13, recent studies showed the prognostic values of quantification of congestion using CXR in patients with acute decompensated HF 14 and chronic HF 15. In contrast, systemic and right sided congestion can be measured by a number of variables, although typically rely on the assessment of peripheral edema and inferior vena cava measurements, respectively 16. Estimated plasma volume status (ePVS) has recently been proposed by our group as a useful marker of congestion 17, 18 which, by essence, evaluates systemic congestion.
Our main objectives were to assess whether initial CXR quantification of lung congestion 1) is correlated with other methods of congestion assessment (i.e. clinical, biological and echocardiographic), 2) is associated with in-hospital and clinical outcomes at 90 days, and 3) interacts with ePVS (the latter assessing different dimensions of congestion) in terms of short-term outcomes.
Methods
Study population
Patients from the HF disease management program entitled Insuffisance CArdiaque en LORraine (ICALOR) 19, 20 hospitalized in the Cardiology department, Nancy University Hospital, France from January 2010 to December 2013 were studied. Of 460 patients, 117 patients aged 18 or older were admitted for WHF, as defined by the ESC guidelines 21, which was not caused by acute myocardial infarction and had available laboratory findings at admission and usable echocardiographic data [performed at 1.0 (1st quartile 1.0–2nd quartile 2.0) days from admission] (Supplementary figure 1). The study was approved by the Commission nationale de l'informatique et des libertés (CNIL). Under French law, no formal Institutional Review Board approval is required for data extraction from patients’ medical records.
Outcome
The primary outcome was the composite of all-cause mortality or re-hospitalization for HF at 90 days, which was prospectively collected in the database as part of the disease management surveillance program. Five patients (4.3 %) were lost to follow-up.
Clinical profiles
Clinical data including demographic characteristics, comorbidities, physical examination and blood pressure at admission were prospectively collected and used in this analysis. The clinical
classifications were defined by the absence or presence of signs of congestion and hypoperfusion as previously shown 13, 22. Indications of congestion included orthopnea, jugular venous distention, rales or peripheral edema, whereas compromised perfusion was assessed by the presence of a narrow proportional pulse pressure ([systolic - diastolic blood pressure]/systolic blood pressure (SBP) ≤25%
22
Echocardiography
Echocardiographic examinations were performed using Vivid 7 or Vivid 9 (GE Vingmed Ultrasound, Horten, Norway) with a 2.5 MHz transducer and analyzed offline using dedicated automated software (Echo PAC PC version 110.1.0, GE Healthcare). All images were acquired at a frame rate of 50 to 70 frames/s. In the present study, all echocardiographic parameters were re-analyzed by two operators blinded to clinical parameters (SP and MB).
Left ventricular (LV) volumes were measured from 2D standard views and LV ejection fraction (LVEF) estimated by the biplane Simpson’s method according to the recommendations of the American Society of Echocardiography 23. LV volumes measures were indexed to body surface area.
Severity of mitral regurgitation was evaluated and inferior vena cava (IVC) and tricuspid annulus plane systolic excursion (TAPSE) were obtained as recommended 23. Pulmonary arterial systolic pressure (PASP) was estimated using tricuspid velocity and inferior vena cava compliance and diameter 24. Diastolic function was assessed from the pattern of mitral inflow and e’ velocity measured by pulsed-wave Doppler and tissue Doppler imaging respectively, enabling the calculation of E/A and E/e’ ratios 25, 26
.
Radiographic congestion score index
The severity of lung congestion was quantified using the previously published congestion score index (CSI) 14, 15. After dividing the lung field into six topographical areas, each area was evaluated as follows: Score 0, normal; Score 1, cephalization (superior area), perihilar haze or perivascular/peribronchial cuffing or Kerley’s A lines (middle area), Kerley’s B or C lines (inferior area); Score 2, interstitial or local or mild alveolar pulmonary edema; Score 3, intense alveolar pulmonary edema (Figure 1).
To enhance the reproducibility of this scoring with regard to the degree of confluent edema, a part of the divided lung field which visually occupied a density similar to cardiac silhouette was regarded as an intense area whereas the field with weaker density was considered to be a mild area. Lung areas were not scored when they were occupied by more than one third pleural effusion (including vanishing
tumor), atelectasis or cardiac silhouette. CSI was calculated as the sum of the scores in each area divided by the number of available areas.
CXR was analyzed by a single physician (MB), blinded from clinical data and outcome, with no previous training in congestion quantification on CXR prior to this study. After a short training using a 20-patient sample with a CXR congestion quantification expert (MK), intra-observer and inter-observer (with MK) were tested on 30 randomly selected patients, blinded to clinical status and CXR timing (i.e. at admission, at discharge or intermediate). Intra-class correlation coefficients showed good reproducibility [0.86 (0.68–0.93) and 0.83 (0.62–0.93) for intra and inter-observer reproducibility, respectively].
Estimated Plasma Volume (ePVS) Status
The ePVS was calculated from the Strauss-derived Duarte formula using hematocrit and hemoglobin values at admission as follows 17, 27, 28 and expressed in dL/g 29:
Statistical methods
Continuous data are expressed as means ± standard deviation or as medians (interquartile range) and categorical variables as frequencies (percentage). Patients with WHF were divided into four groups according to median CSI (2.20) and median ePVS (5.38) at admission; low CSI/low ePVS, low CSI/high ePVS, high CSI/low ePVS and high CSI/high ePVS. Group differences were assessed using Kruskal-Wallis tests for continuous variables and chi-square test for categorical variables, while unadjusted correlations were expressed using Pearson's correlation coefficients. Inter-observer and intra-observer agreements of CSI were assessed with the intraclass correlation coefficient (ICC).
Linear regression analyses and binary logistic regression analyses were performed to assess the associations between clinical, biological, echocardiographic variables and admission CSI. All variables with a P<0.10 by univariable analysis were used as candidate variables in the multivariable model.
Associations of CSI and ePVS with length of hospital stay and composite outcome were derived from univariable and multivariable logistic regression analyses. Adjusted variables were selected from clinically relevant variables including age, SBP, LVEF, blood urea nitrogen (BUN), estimated glomerular filtration rate (eGFR) 30 and brain natriuretic peptide (BNP) at admission. An interaction test was performed to determine whether there would be interaction between CSI and ePVS on the 90-day composite outcome. In addition, the increase in discriminative value with the addition of CSI and ePVS to predict the 90-day composite outcome on top of aforementioned clinical variables was evaluated using continuous net reclassification improvement (NRI) and integrated diagnostic improvement (IDI) as previously used by our group 4, 31.
A p-value <0.05 was considered significant. No imputation was performed. Statistical analyses were performed using the R statistical software (3.4.0) including ICC and continuous NRI and IDI (ICC and survIDINRI packages).
Results
Baseline characteristics
The patient characteristics of the 117 included WHF patients are reported in Table 1. Most patients were male, had hypertension, and frequently had (>20%) diabetes, ischemic cardiac disease or chronic kidney disease. LVEF was less than 40% in a majority of patients.
Association between admission CSI and other congestion variables
Mean CSI at admission was 2.1±0.8. Admission CSI was moderately correlated with oxygen flow and poorly correlated with ePVS, body mass index and echocardiographic variables with regard to right-sided function: PASP and TAPSE (Supplementary table 1). No other noteworthy correlations were identified, including with E/e’ and IVC.
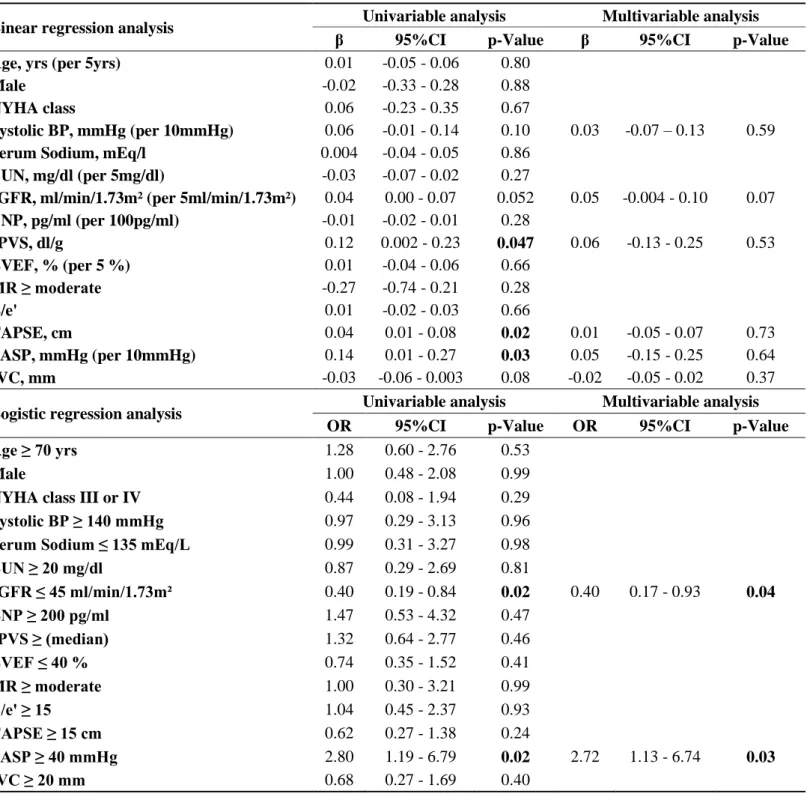
Univariable linear regression analysis revealed significant associations of higher ePVS, TAPSE and PASP with higher CSI (Table 2). There was no significant association with CSI in multivariable model.
In considering CSI to be a dichotomized variable (according to the median), higher eGFR and PASP remained significantly associated with higher CSI in multivariable logistic regression analysis (Table 2).
Interplay between admission CSI and ePVS
When considering subsets of patients divided according to CSI and ePVS medians (Table 1), patients with high CSI and low ePVS were younger than other subsets whereas TAPSE was higher in patients with high ePVS, with or without high CSI. Similarly, higher PASP was observed in patients with high ePVS, with or without high CSI, although the highest values were observed in the high CSI/high ePVS group. BNP values were not significantly different across groups.
Survival Analysis
The mean length of hospital stay was 12.5±8.0 days. At 90 days, 30 (25.4%) patients reached the primary outcome with 13 (11.0%) and 22 (18.6%) for all-cause death and/or HF re-hospitalization, respectively.
Multivariable cox models showed that high admission CSI was significantly associated with a greater than 4-day longer length of stay and a 3-fold higher 90-day risk of the composite outcome (Supplementary table 2). Association of ePVS with either length of stay or 90-day outcome yielded borderline significance p-values. The p-value for interaction between ePVS and CSI for the 90-day composite outcome was 0.05, leading to a further examination of the association between subsets derived from both CSI and ePVS and clinical outcomes.
In univariable analyses, compared to patients with low CSI/low ePVS, patients with high CSI/high ePVS had a significantly longer length of stay [OR (95%CI)=3.35 (1.12-10.01), p=0.03] and higher risk of the composite outcome [OR (95%CI)=4.36 (1.09-17.54), p=0.04]. After adjusting for clinical confounders, patients with high CSI/high ePVS retained at higher risk of prolonging hospital stay and the incidence of the composite outcome (Figure 2). In contrast, other configurations (either isolated high CSI or isolated high ePVS) had non-statistically significant associations with length of stay and 90-day composite outcome.
With regard to the composite outcome, the addition of admission CSI and ePVS on top of age, SBP, reduced LVEF, BUN, eGFR and BNP at admission improved significantly reclassification [NRI (95%CI)=37.3 (0.5-87.0), p=0.046 and IDI (95%CI)=3.3 (0.4-14.9), p=0.03].
Discussion
The main findings of this study are that 1) quantification of admission pulmonary congestion with CXR is significantly associated with PASP; 2) patients with concomitant high CSI and high ePVS have a marked increase in both length of stay and 90-day risk of death or HF re-hospitalization whereas patients with only one of these features appear to have a much less detrimental prognosis and; 3) the combined use of CSI and ePVS improves patient’s risk-stratification beyond clinical profiles. Is it worth assessing and how to assess pulmonary congestion in patients admitted for worsening heart failure?
It is well known that both the level and the distribution of congestion matter 3. Many algorithms have been proposed to grade congestion 3 using clinical, biological and imaging variables. However, most algorithms propose a “qualitative” congestion assessment or require specific clinical training and/or expertise. The present work shows that a readily available semi-quantitative pulmonary congestion assessment using CXR is associated with PASP and short-term outcomes. Indeed, one of the few variables associated with CSI in multivariable models was PASP, suggesting that CSI can accurately assess pulmonary congestion which is the consequence of rising intravascular pressure in pulmonary arteries. In contrast, BNP was not significantly (and strongly) different across CSI/ePVS groups, probably because of its incapacity to identify the congestion profile of patients; All of the patients included in this analysis had worsening HF and consequently raised BNP 32, 33. In addition, we found that higher eGFR was also associated with increased CSI. Fluid re-distribution rather than accumulation, which is an important contributor of worsening renal function 34, may lead to pulmonary congestion 35.
We previously showed that lung congestion quantified by lung ultrasound imaging (LUS) within days of admission 5 or at discharge 4 was associated with short-term outcome following discharge. In the present study, we demonstrated that lung congestion assessed by CSI is significantly associated with longer length of stay as well as with higher incidence of primary outcome when used in conjunction with ePVS. These findings are congruent with the results of Melenovsky et al 15 who demonstrated that CSI was associated with pulmonary vascular disease, right ventricular overload/
dysfunction and increased mortality in chronic HF. We believe the present results may encourage to perform CXR more systematically in patients admitted for suspected WHF.
Interplay between CSI and ePVS
In the current cohort, we identified that patients with both increased CSI and ePVS had a marked increase in the risk of 90-day HF readmission or all-cause death. In contrast, patients with only one abnormal congestion component (i.e. only pulmonary congestion assessed using CXR or only systemic congestion assessed with ePVS) had a less stringent increased risk of clinical events. Moreover, addition of admission CSI and ePVS yielded a significant improvement on top of traditional clinical covariates at admission (e.g. SBP, LVEF, eGFR and BNP). This suggests that patients with both systemic and pulmonary congestion are at the utmost risk of events. Isolated pulmonary congestion, especially in the setting of hypertension, is often perceived as a less severe form of WHF although has not been extensively studied 36-41. Likewise, the clinical prognosis of patients with isolated systemic/intravascular congestion has yet to be comprehensively studied. The novelty of the present study lines in assessing the interplay between these two components of congestion and identifying that the specific phenotype of generalized congestion is associated with a markedly increased risk of event and could represent an integrative marker of more severe HF.
Residual congestion is typically the focus of risk-stratifying tools 16, 42. However, there is a likely link between admission and discharge congestion since patients with the most overt admission congestion are the most likely to experience discharge congestion. Discharge CXR was only available in a minority of patients in our study and consequently we were unable to measure the in-hospital changes in congestion profiles. We can hypothesize that discharge CSI could have been a more relevant prognostic marker although this particular aspect would need to be studied in future analyses. Pathophysiology of pulmonary congestion: PASP and RV function
Our results target some pathophysiological features that have not been often previously addressed. McIver et al. advocated the notion that RV function was volume dependent and that an increase in RV function may actually contribute to pulmonary congestion development 43. In contrast, other authors rather promote the concept of increased LV filling pressure that eventually increase pulmonary congestion, overload the RV and result in decreased RV function 44. In the present study, higher
TAPSE was associated overall with a higher CSI level (i.e. pulmonary congestion) as highlighted in the univariable linear regression analysis which would favor the first aforementioned postulate. However, when dividing the cohort according to both CSI and ePVS, an intriguing association pattern was observed, notably that patients with high CSI but low ePVS had a lower TAPSE than patients with high ePVS regardless of CSI status. This could be the result of an increase in RV contractility following increased RV volumes as recently suggested by McIver 43.
We identified the association between PASP and CSI in the multivariable model. Nevertheless, this association could be perceived as weak since patients with both high ePVS and high CSI had approximately 10 mmHg higher in a mean PASP compared to patients with low ePVS and low CSI. However, it should be emphasized that equivocal associations of pulmonary congestion and elevated wedge pressure have been reported in the past 11, 45. In addition, the reported association between LUS with invasive wedge pressure 11 appeared of similar magnitude to that observed in the present study.
Clinical perspectives
Patients admitted for WHF have a high-risk of death and/or re-hospitalization either during or after their index hospitalization. A better risk stratification is likely to help tailoring the monitoring of identified high-risk patients. Our results suggest that the combined assessment of admission pulmonary congestion using CSI and systemic congestion using ePVS has an important prognostic value. This simple categorization of patients, performed at admission, does not require highly specialized exams while conversely providing relevant information regarding PASP. This simple evaluation method could hence be very useful in hospitals or units where an expert evaluation by a cardiologist is not easily available 24 hours a day, 7 days a week: We believe that looking carefully at CXR to quantify congestion remains a viable tool in a number of clinical settings. In addition, an automated evaluation of congestion using CXR could ultimately be implemented in radiographic software, which would greatly promote the utilization of CSI to quantify congestion. As a consequence, large-scale multicenter studies should explore whether this simple assessment of CXR and hemoglobin/hematocrit could help identifying risk-stratification of patients with worsening HF admitting to the hospitals.
Limitations
This is a single-center cohort study derived from a disease management program: thus, residual confounding may ultimately exist and generalizability is not certain. In addition, some patients were lost to follow-up (approximately 5%) and patients were including in this management program at hospital discharge, which prevented the analysis of in-hospital mortality. However, patients included in this cohort were followed within a HF disease management program, which ensure some standardization in patients’ care and follow-up. In addition, the moderate size of our cohort only yielded moderate statistical power and patients in each CSI/ePVS subgroups were small, which made difficult the use of survival analysis (including Kaplan-Meier curves). Moreover, given the size of the cohort, only median were considered as cut-offs; Other cutoff points might have resulted in different associations. Moreover, patients with only one abnormal congestion component (i.e. isolated increased CSI or ePVS) could have significantly increased risk of events in larger datasets. Certain important variables, e.g. factors precipitating to WHF and diastolic dysfunction grade (because of the absence of available LA volume), were not available and consequently could not be adjusted for. We had no direct measurement of plasma volume; Recent data suggest that the association of plasma volume measurements and estimation can differ 46
.
CSI was measured retrospectively; 50 had no CXR at admission as part of routine care. Nevertheless, all analyses were performed blinded from other parameters and outcomes. The CSI method also has some intrinsic limitations: it is a semi-quantitative tool which necessarily features some subjectivity. Despite our efforts in CSI quantification, scoring CSI was at times challenging, especially when CXR was of average quality or when patients had acute or chronic pulmonary comorbidities. These difficulties reflect real-life circumstances, which may alleviate the applicability of our results. Lastly, it is important to emphasize that CSI quantification requires a short training period of about 2-3 hours before accurate scoring of congestion can be achieved and in a reproductive manner. CSI scoring thus requires more effort than routine CXR reading in an acute setting.
Conclusion
A combined assessment of pulmonary and systemic congestion at admission using CSI and ePVS can help in identifying a cluster of patients who have a higher risk of short-term outcomes. These patients would demand particular monitoring during decongestion therapy as well as closer surveillance in the post-discharge term. CXR should hence still be systematically performed in patients admitted for WHF.
Acknowledgements
This study was sponsored by the Nancy CHRU and JPF, NG, PR, FZ are supported by a public grant overseen by the French National Research Agency (ANR) as part of the second “Investissements d’Avenir” program (reference: ANR-15-RHU-0004).
Reference
1. Maggioni AP, Dahlstrom U, Filippatos G, Chioncel O, Crespo Leiro M, Drozdz J, Fruhwald F, Gullestad L, Logeart D, Fabbri G, Urso R, Metra M, Parissis J, Persson H, Ponikowski P,
Rauchhaus M, Voors AA, Nielsen OW, Zannad F, Tavazzi L and Heart Failure Association of the European Society of C. EURObservational Research Programme: regional differences and 1-year follow-up results of the Heart Failure Pilot Survey (ESC-HF Pilot). Eur J Heart Fail. 2013;15:808-17. 2. HAS. Note méthodologique et de synthèse documentaire : Comment organiser la sortie des patients hospitalisés pour insuffisance cardiaque ? 2015.
3. Girerd N, Seronde MF, Coiro S, Chouihed T, Bilbault P, Braun F, Kenizou D, Maillier B, Nazeyrollas P, Roul G, Fillieux L, Abraham WT, Januzzi J, Jr., Sebbag L, Zannad F, Mebazaa A and Rossignol P. Integrative Assessment of Congestion in Heart Failure Throughout the Patient Journey. JACC Heart failure. 2018;6:273-285.
4. Coiro S, Rossignol P, Ambrosio G, Carluccio E, Alunni G, Murrone A, Tritto I, Zannad F and Girerd N. Prognostic value of residual pulmonary congestion at discharge assessed by lung ultrasound imaging in heart failure. Eur J Heart Fail. 2015;17:1172-81.
5. Coiro S, Porot G, Rossignol P, Ambrosio G, Carluccio E, Tritto I, Huttin O, Lemoine S, Sadoul N, Donal E, Zannad F and Girerd N. Prognostic value of pulmonary congestion assessed by
lung ultrasound imaging during heart failure hospitalisation: A two-centre cohort study. Sci Rep. 2016;6:39426.
6. Goonewardena SN, Gemignani A, Ronan A, Vasaiwala S, Blair J, Brennan JM, Shah DP and Spencer KT. Comparison of hand-carried ultrasound assessment of the inferior vena cava and N-terminal pro-brain natriuretic peptide for predicting readmission after hospitalization for acute decompensated heart failure. JACC Cardiovasc Imaging. 2008;1:595-601.
7. Greene SJ, Fonarow GC, Vaduganathan M, Khan S, Butler J and Gheorghiade M. The vulnerable phase after hospitalization for heart failure. Nature Reviews Cardiology. 2015;12:220-229. 8. Gargani L, Pang PS, Frassi F, Miglioranza MH, Dini FL, Landi P and Picano E. Persistent pulmonary congestion before discharge predicts rehospitalization in heart failure: a lung ultrasound study. Cardiovascular Ultrasound. 2015;13.
9. Volpicelli G, Mussa A, Garofalo G, Cardinale L, Casoli G, Perotto F, Fava C and Frascisco M. Bedside lung ultrasound in the assessment of alveolar-interstitial syndrome. The American Journal of Emergency Medicine. 2006;24:689-696.
10. Maines M, Catanzariti D, Angheben C, Valsecchi S, Comisso J and Vergara G. Intrathoracic impedance and ultrasound lung comets in heart failure deterioration monitoring. Pacing Clin
Electrophysiol. 2011;34:968-74.
11. Platz E, Lattanzi A, Agbo C, Takeuchi M, Resnic FS, Solomon SD and Desai AS. Utility of lung ultrasound in predicting pulmonary and cardiac pressures. European journal of heart failure. 2012;14:1276-84.
12. Stein JH, Neumann A and Marcus RH. Comparison of estimates of right atrial pressure by physical examination and echocardiography in patients with congestive heart failure and reasons for discrepancies. Am J Cardiol. 1997;80:1615-8.
13. Ponikowski P, Voors AA, Anker SD, Bueno H, Cleland JG, Coats AJ, Falk V, Gonzalez-Juanatey JR, Harjola VP, Jankowska EA, Jessup M, Linde C, Nihoyannopoulos P, Parissis JT, Pieske B, Riley JP, Rosano GM, Ruilope LM, Ruschitzka F, Rutten FH, van der Meer P, Authors/Task Force M and Document R. 2016 ESC Guidelines for the diagnosis and treatment of acute and chronic heart failure: The Task Force for the diagnosis and treatment of acute and chronic heart failure of the European Society of Cardiology (ESC). Developed with the special contribution of the Heart Failure Association (HFA) of the ESC. European journal of heart failure. 2016;18:891-975.
14. Kobayashi M, Watanabe M, Coiro S, Bercker M, Paku Y, Iwasaki Y, Chikamori T, Yamashina A, Duarte K, Ferreira JP, Rossignol P, Zannad F and Girerd N. Mid-term prognostic impact of residual pulmonary congestion assessed by radiographic scoring in patients admitted for worsening heart failure. Int J Cardiol. 2019.
15. Melenovsky V, Andersen MJ, Andress K, Reddy YN and Borlaug BA. Lung congestion in chronic heart failure: haemodynamic, clinical, and prognostic implications. Eur J Heart Fail. 2015;17:1161-71.
16. Gheorghiade M, Follath F, Ponikowski P, Barsuk JH, Blair JE, Cleland JG, Dickstein K, Drazner MH, Fonarow GC, Jaarsma T, Jondeau G, Sendon JL, Mebazaa A, Metra M, Nieminen M, Pang PS, Seferovic P, Stevenson LW, van Veldhuisen DJ, Zannad F, Anker SD, Rhodes A, McMurray JJ, Filippatos G, European Society of C and European Society of Intensive Care M. Assessing and grading congestion in acute heart failure: a scientific statement from the acute heart failure committee of the heart failure association of the European Society of Cardiology and endorsed by the European Society of Intensive Care Medicine. Eur J Heart Fail. 2010;12:423-33.
17. Duarte K, Monnez JM, Albuisson E, Pitt B, Zannad F and Rossignol P. Prognostic Value of Estimated Plasma Volume in Heart Failure. JACC Heart Fail. 2015;3:886-93.
18. Rossignol P, Menard J, Fay R, Gustafsson F, Pitt B and Zannad F. Eplerenone survival benefits in heart failure patients post-myocardial infarction are independent from its diuretic and potassium-sparing effects. Insights from an EPHESUS (Eplerenone Post-Acute Myocardial Infarction Heart Failure Efficacy and Survival Study) substudy. J Am Coll Cardiol. 2011;58:1958-66.
19. Agrinier N, Altieri C, Alla F, Jay N, Dobre D, Thilly N and Zannad F. Effectiveness of a multidimensional home nurse led heart failure disease management program--a French nationwide time-series comparison. Int J Cardiol. 2013;168:3652-8.
20. Alla F, Agrinier N, Lavielle M, Rossignol P, Gonthier D, Boivin JM and Zannad F. Impact of the interruption of a large heart failure regional disease management programme on hospital admission rates: a population-based study. European journal of heart failure. 2018;20:1066-1068.
21. Dickstein K, Cohen-Solal A, Filippatos G, McMurray JJ, Ponikowski P, Poole-Wilson PA, Stromberg A, van Veldhuisen DJ and Atar D. ESC Guidelines for the diagnosis and treatment of acute and chronic heart failure 2008: The Task Force for the Diagnosis and Treatment of Acute and Chronic Heart Failure 2008 of the European Society of Cardiology. European heart journal. 2008;29:2388-2442.
22. Nohria A, Tsang SW, Fang JC, Lewis EF, Jarcho JA, Mudge GH and Stevenson LW. Clinical assessment identifies hemodynamic profiles that predict outcomes in patients admitted with heart failure. J Am Coll Cardiol. 2003;41:1797-804.
23. Lang RM, Badano LP, Mor-Avi V, Afilalo J, Armstrong A, Ernande L, Flachskampf FA, Foster E, Goldstein SA, Kuznetsova T, Lancellotti P, Muraru D, Picard MH, Rietzschel ER, Rudski L, Spencer KT, Tsang W and Voigt JU. Recommendations for cardiac chamber quantification by
echocardiography in adults: an update from the American Society of Echocardiography and the European Association of Cardiovascular Imaging. J Am Soc Echocardiogr. 2015;28:1-39 e14. 24. Kircher BJ, Himelman RB and Schiller NB. Noninvasive estimation of right atrial pressure from the inspiratory collapse of the inferior vena cava. The American journal of cardiology. 1990;66:493-6.
25. Nagueh SF, Smiseth OA, Appleton CP, Byrd BF, 3rd, Dokainish H, Edvardsen T,
AD. Recommendations for the Evaluation of Left Ventricular Diastolic Function by
Echocardiography: An Update from the American Society of Echocardiography and the European Association of Cardiovascular Imaging. J Am Soc Echocardiogr. 2016;29:277-314.
26. Caballero L, Kou S, Dulgheru R, Gonjilashvili N, Athanassopoulos GD, Barone D, Baroni M, Cardim N, Gomez de Diego JJ, Oliva MJ, Hagendorff A, Hristova K, Lopez T, Magne J, Martinez C, de la Morena G, Popescu BA, Penicka M, Ozyigit T, Rodrigo Carbonero JD, Salustri A, Van De Veire N, Von Bardeleben RS, Vinereanu D, Voigt JU, Zamorano JL, Bernard A, Donal E, Lang RM,
Badano LP and Lancellotti P. Echocardiographic reference ranges for normal cardiac Doppler data: results from the NORRE Study. European heart journal cardiovascular Imaging. 2015;16:1031-41. 27. Chouihed T, Rossignol P, Bassand A, Duarte K, Kobayashi M, Jaeger D, Sadoune S, Buessler A, Nace L, Giacomin G, Hutter T, Barbe F, Salignac S, Jay N, Zannad F and Girerd N. Diagnostic and prognostic value of plasma volume status at emergency department admission in dyspneic patients: results from the PARADISE cohort. Clin Res Cardiol. 2018.
28. Kobayashi M, Rossignol P, Ferreira JP, Aragao I, Paku Y, Iwasaki Y, Watanabe M, Fudim M, Duarte K, Zannad F and Girerd N. Prognostic value of estimated plasma volume in acute heart failure in three cohort studies. Clin Res Cardiol. 2018.
29. Kobayashi M, Huttin O, Rossignol P and Girerd N. The unit of Estimated Plasma Volume in Patients with Heart Failure using the Strauss-derived Duarte formula is not liter but dL/g. J Card Fail. 2018.
30. Levey AS, Bosch JP, Lewis JB, Greene T, Rogers N and Roth D. A more accurate method to estimate glomerular filtration rate from serum creatinine: a new prediction equation. Modification of Diet in Renal Disease Study Group. Ann Intern Med. 1999;130:461-70.
31. von Lueder TG, Girerd N, Atar D, Agewall S, Lamiral Z, Kanbay M, Pitt B, Dickstein K, Zannad F and Rossignol P. Serum uric acid is associated with mortality and heart failure
hospitalizations in patients with complicated myocardial infarction: findings from the High-Risk Myocardial Infarction Database Initiative. Eur J Heart Fail. 2015;17:1144-51.
32. Vodovar N, Mebazaa A, Januzzi JL, Jr., Murtagh G, Stough WG, Adams KF, Jr. and Zannad F. Evolution of natriuretic peptide biomarkers in heart failure: Implications for clinical care and clinical trials. Int J Cardiol. 2018;254:215-221.
33. Maeder MT, Mueller C, Pfisterer ME, Buser PT and Brunner-La Rocca HP. Use of B-type natriuretic peptide outside of the emergency department. Int J Cardiol. 2008;127:5-16.
34. Mullens W, Abrahams Z, Francis GS, Sokos G, Taylor DO, Starling RC, Young JB and Tang WH. Importance of venous congestion for worsening of renal function in advanced decompensated heart failure. J Am Coll Cardiol. 2009;53:589-96.
35. Fallick C, Sobotka PA and Dunlap ME. Sympathetically mediated changes in capacitance: redistribution of the venous reservoir as a cause of decompensation. Circ Heart Fail. 2011;4:669-75.
36. Parissis JT, Nikolaou M, Mebazaa A, Ikonomidis I, Delgado J, Vilas-Boas F, Paraskevaidis I, Mc Lean A, Kremastinos D and Follath F. Acute pulmonary oedema: clinical characteristics,
prognostic factors, and in-hospital management. European journal of heart failure. 2010;12:1193-202. 37. Gheorghiade M, Abraham WT, Albert N, Greenberg B, O’Connor C, She L, Stough W, Yancy CW, Young J and Fonarow GC. Systolic blood pressure at admission, clinical characteristics, and outcomes in patients hospitalized with acute heart failure. Jama. 2006;296:2217–2226.
38. Gheorghiade M, Filippatos G, De Luca L and Burnett J. Congestion in acute heart failure syndromes: an essential target of evaluation and treatment. Am J Med. 2006;119:S3-S10.
39. Logeart D, Isnard R, Resche-Rigon M, Seronde MF, de Groote P, Jondeau G, Galinier M, Mulak G, Donal E, Delahaye F, Juilliere Y, Damy T, Jourdain P, Bauer F, Eicher JC, Neuder Y, Trochu JN and Heart Failure of the French Society of C. Current aspects of the spectrum of acute heart failure syndromes in a real-life setting: the OFICA study. European journal of heart failure.
2013;15:465-76.
40. Zannad F, Mebazaa A, Juilliere Y, Cohen-Solal A, Guize L, Alla F, Rouge P, Blin P, Barlet MH, Paolozzi L, Vincent C, Desnos M, Samii K and Investigators E. Clinical profile, contemporary management and one-year mortality in patients with severe acute heart failure syndromes: The EFICA study. Eur J Heart Fail. 2006;8:697-705.
41. Nieminen MS, Brutsaert D, Dickstein K, Drexler H, Follath F, Harjola VP, Hochadel M, Komajda M, Lassus J, Lopez-Sendon JL, Ponikowski P, Tavazzi L, EuroHeart Survey I and Heart Failure Association ESoC. EuroHeart Failure Survey II (EHFS II): a survey on hospitalized acute heart failure patients: description of population. European heart journal. 2006;27:2725-36.
42. Ambrosy AP, Pang PS, Khan S, Konstam MA, Fonarow GC, Traver B, Maggioni AP, Cook T, Swedberg K, Burnett JC, Jr., Grinfeld L, Udelson JE, Zannad F, Gheorghiade M and Investigators ET. Clinical course and predictive value of congestion during hospitalization in patients admitted for worsening signs and symptoms of heart failure with reduced ejection fraction: findings from the EVEREST trial. Eur Heart J. 2013;34:835-43.
43. MacIver DH and Clark AL. The vital role of the right ventricle in the pathogenesis of acute pulmonary edema. Am J Cardiol. 2015;115:992-1000.
44. Guglin M, Win CM, Darbinyan N and Wu Y. Predictors of right ventricular systolic dysfunction in compensated and decompensated heart failure. Congest Heart Fail. 2012;18:278-83. 45. Volpicelli G, Skurzak S, Boero E, Carpinteri G, Tengattini M, Stefanone V, Luberto L, Anile A, Cerutti E, Radeschi G and Frascisco MF. Lung ultrasound predicts well extravascular lung water but is of limited usefulness in the prediction of wedge pressure. Anesthesiology. 2014;121:320-7. 46. Fudim M and Miller WL. Calculated Estimates of Plasma Volume in Patients With Chronic Heart Failure-Comparison With Measured Volumes. J Card Fail. 2018.
Table 1. Patient Characteristics for the Whole Cohort and according to CSI/ePVS
Subsets
Values are mean ± SD, n (%) or median (25th to 75th percentile)
CSI, congestion score index; ePVS, estimated plasma volume; COPD, chronic obstructive pulmonary disease; NYHA, New York Heart Association, BUN, blood urea nitrogen; eGFR, estimated glomerular filtration rate; BNP, brain natriuretic peptide; LVDVI, left ventricular diastolic volume index; LVEF, left ventricular ejection fraction; TMF, transmitral flow; E/A ratio, ratio of peak early and late diastolic velocities; E/e’, ratio of early mitral inflow velocity and mitral annular early diastolic velocity; TAPSE, tricuspid annular plane systolic excursion; IVC, inferior vena cava; PASP, pulmonary artery systolic pressure; MR, mitral regurgitation; ACEi, angiotensin converting enzyme inhibitor; ARB, angiotensin receptor blocker; MRA, mineralocorticoid receptor antagonist.
Table 2. Association of Admission Radiographic Congestion Score Index with Clinical,
Echocardiographic and Biological Congestive Variables
Logistic regression analysis was performed for dichotomized variables determined by CSI of 2.20 (median). CSI, congestion score index; NYHA, New York Heart Association; BP, blood pressure; BUN, blood urea nitrogen; eGFR, estimated glomerular filtration rate; BNP, brain natriuretic peptide; LVEF, left ventricular ejection fraction; MR, mitral regurgitation; TMF, transmitral flow; TAPSE, tricuspid annular plane systolic excursion; PASP, pulmonary artery systolic pressure; IVC, inferior vena cava.
Table 1. Patient Characteristics for the Whole Cohort and according to CSI/ePVS Subsets
Overall (N=117) Low CSI Low ePVS (N=30) Low CSI High ePVS (N=33) High CSI Low ePVS (N=22) High CSI High ePVS (N=32) p-value Age, yrs 73.7 ± 14.4 73.4 ± 14.7 75.2 ± 11.8 66.1 ± 16.4 77.2 ± 15.2 0.045 Male, n (%) 75 (56.8 %) 18 (58.1 %) 18 (54.5 %) 15 (68.2 %) 15 (46.9 %) 0.48Body mass index, kg/m² 26.4 ± 6.0 25.0 ± 6.2 25.5 ± 4.7 29.3 ± 5.4 26.4 ± 5.9 0.12
Heart failure etiology, n (%)
Ischemic 42 (35.9 %) 11 (37.9 %) 10 (34.5 %) 5 (25.0 %) 16 (55.2 %) 0.17 Valvular 28 (21.2 %) 10 (32.3 %) 5 (15.2 %) 5 (22.7 %) 4 (12.5 %) 0.46 Medical history, n (%) Hypertension 89 (67.4 %) 22 (71.0 %) 20 (60.6 %) 14 (63.6 %) 23 (71.9 %) 0.86 Diabetes mellitus 46 (34.8 %) 10 (32.3 %) 13 (39.4 %) 4 (18.2 %) 14 (43.8 %) 0.36 COPD 28 (21.2 %) 8 (25.8 %) 5 (15.2 %) 6 (27.3 %) 7 (21.9 %) 0.82
Chronic kidney disease 28 (21.2 %) 5 (16.1 %) 9 (27.3 %) 2 (9.1 %) 11 (34.4 %) 0.21
Physical examinations
NYHA class ≥III, n (%) 65 (55.1 %) 20 (64.5 %) 16 (48.5 %) 10 (45.5 %) 17 (53.1 %) 0.29
Rales, n (%) 83 (71.6 %) 14 (58.3 %) 22 (71.0 %) 15 (71.4 %) 22 (81.5 %) 0.35
Systolic blood pressure, mmHg 119.4 ± 20.2 118.5 ± 16.4 117.0 ± 25.8 114.0 ± 15.2 126.8 ± 21.3 0.12
Heart rate, bpm 74.6 ± 15.3 75.9 ± 16.4 71.4 ± 11.3 78.2 ± 19.0 72.9 ± 14.5 0.38 Physical profiles, n (%) 0.04 Warm/ Wet 99 (89.2 %) 25 (86.2 %) 29 (96.7 %) 17 (77.3 %) 28 (93.3 %) Warm/ Dry 8 (7.2 %) 4 (13.8 %) 0 (0 %) 2 (9.1 %) 2 (6.7 %) Cold/ Wet 4 (3.6 %) 0 (0 %) 1 (3.3 %) 3 (13.6 %) 0 (0 %) Cold/ Dry 0 (0 %) 0 (0 %) 0 (0 %) 0 (0 %) 0 (0 %) Laboratory findings Sodium, mmol/l 139.6 ± 3.8 139.5 ± 2.7 140.1 ± 4.1 138.7 ± 3.7 139.6 ± 4.2 0.66 BUN, mg/dl 33.7 ± 16.5 36.4 ± 18.3 36.7 ± 16.6 29.1 ± 16.2 33.5 ± 16.4 0.41 eGFR, ml/min/1.73m² 53.7 ± 22.1 49.3 ± 21.3 45.2 ± 17.1 64.3 ± 17.9 50.7 ± 21.9 <0.01 BNP, pg/ml 900 (477 - 1477) 970 (392 - 1933) 1055 (586 - 1864) 561 (419 - 915) 1031 (589 - 1438) 0.09 ePVS, dl/g 5.4 ± 1.3 4.4 ± 0.6 6.3 ± 0.8 4.3 ± 0.6 6.6 ± 1.0 <0.01 Echocardiography LVDVI, ml/m² 79.0 ± 34.0 80.2 ± 28.9 73.2 ± 29.6 75.6 ± 32.9 88.9 ± 45.8 0.49 LVEF, % 40.1 ± 16.0 36.3 ± 16.6 43.2 ± 17.3 38.4 ± 16.5 43.4 ± 15.4 0.24 LVEF <40 %, n (%) 68 (51.5 %) 18 (58.1 %) 16 (48.5 %) 12 (54.5 %) 13 (40.6 %) 0.54 TMF E/A ratio 2.0 ± 1.2 2.3 ± 1.0 2.2 ± 1.4 1.4 ± 1.1 1.9 ± 0.9 0.21
TMF E deceleration time, msec 174.9 ± 66.9 180.1 ± 64.0 170.6 ± 69.4 175.8 ± 95.2 174.0 ± 54.6 0.96
E/e' ratio 13.6 ± 5.8 11.9 ± 5.1 14.4 ± 6.2 14.0 ± 6.7 15.1 ± 6.2 0.26
TAPSE, cm 15.5 ± 4.6 13.6 ± 4.5 16.2 ± 4.8 14.2 ± 3.3 17.6 ± 4.3 <0.01
IVC, mm 22.1 ± 6.2 22.4 ± 7.4 23.8 ± 5.0 23.9 ± 6.0 20.1 ± 4.7 0.13
PASP, mmHg 37.3 ± 12.9 33.3 ± 12.4 36.5 ± 12.8 33.7 ± 9.3 43.3 ± 13.6 0.02
MR grade, 0/1/2/3/4 34/32/38/10/3 12/8/6/3/1 10/10/10/2/1 6/7/8/0/1 6/7/14/5/0 0.51
Congestion score index 2.1 ± 0.8 1.5 ± 0.5 1.5 ± 0.7 2.8 ± 0.2 2.8 ± 0.2 <0.01
Medication at discharge, n (%)
ACEi or ARB 96 (83.5 %) 23 (76.7 %) 25 (75.8 %) 22 (100 %) 26 (86.7 %) 0.07
Beta-blocker 93 (80.2 %) 22 (71.0 %) 29 (87.9 %) 15 (68.2 %) 27 (90.0 %) 0.08
MRA 19 (16.4 %) 6 (19.4 %) 4 (12.1 %) 6 (27.3 %) 3 (10.0 %) 0.33
Table 2. Association of Admission Radiographic Congestion Score Index with
Clinical, Echocardiographic and Biological Congestive Variables
Linear regression analysis Univariable analysis Multivariable analysis
β 95%CI p-Value β 95%CI p-Value
Age, yrs (per 5yrs) 0.01 -0.05 - 0.06 0.80
Male -0.02 -0.33 - 0.28 0.88
NYHA class 0.06 -0.23 - 0.35 0.67
Systolic BP, mmHg (per 10mmHg) 0.06 -0.01 - 0.14 0.10 0.03 -0.07 – 0.13 0.59
Serum Sodium, mEq/l 0.004 -0.04 - 0.05 0.86
BUN, mg/dl (per 5mg/dl) -0.03 -0.07 - 0.02 0.27
eGFR, ml/min/1.73m² (per 5ml/min/1.73m²) 0.04 0.00 - 0.07 0.052 0.05 -0.004 - 0.10 0.07 BNP, pg/ml (per 100pg/ml) -0.01 -0.02 - 0.01 0.28 ePVS, dl/g 0.12 0.002 - 0.23 0.047 0.06 -0.13 - 0.25 0.53 LVEF, % (per 5 %) 0.01 -0.04 - 0.06 0.66 MR ≥ moderate -0.27 -0.74 - 0.21 0.28 E/e' 0.01 -0.02 - 0.03 0.66 TAPSE, cm 0.04 0.01 - 0.08 0.02 0.01 -0.05 - 0.07 0.73 PASP, mmHg (per 10mmHg) 0.14 0.01 - 0.27 0.03 0.05 -0.15 - 0.25 0.64 IVC, mm -0.03 -0.06 - 0.003 0.08 -0.02 -0.05 - 0.02 0.37
Logistic regression analysis Univariable analysis Multivariable analysis
OR 95%CI p-Value OR 95%CI p-Value
Age ≥ 70 yrs 1.28 0.60 - 2.76 0.53
Male 1.00 0.48 - 2.08 0.99
NYHA class III or IV 0.44 0.08 - 1.94 0.29
Systolic BP ≥ 140 mmHg 0.97 0.29 - 3.13 0.96
Serum Sodium ≤ 135 mEq/L 0.99 0.31 - 3.27 0.98
BUN ≥ 20 mg/dl 0.87 0.29 - 2.69 0.81 eGFR ≤ 45 ml/min/1.73m² 0.40 0.19 - 0.84 0.02 0.40 0.17 - 0.93 0.04 BNP ≥ 200 pg/ml 1.47 0.53 - 4.32 0.47 ePVS ≥ (median) 1.32 0.64 - 2.77 0.46 LVEF ≤ 40 % 0.74 0.35 - 1.52 0.41 MR ≥ moderate 1.00 0.30 - 3.21 0.99 E/e' ≥ 15 1.04 0.45 - 2.37 0.93 TAPSE ≥ 15 cm 0.62 0.27 - 1.38 0.24 PASP ≥ 40 mmHg 2.80 1.19 - 6.79 0.02 2.72 1.13 - 6.74 0.03 IVC ≥ 20 mm 0.68 0.27 - 1.69 0.40
Figure 1. Radiographic Congestion Scoring
A) Example of low CSI: CSI = 0.5. Cephalization and perihilar haze are visible in the right field. Inferior fields are not available due to pleural effusion.
B) Example of high CSI: CSI = (2+3+3+2+3+3)/6 = 2.67. There is diffuse alveolar edema, appearing as mild in superior fields and intense in other fields.
No available segment was defined in lung-field areas when occupied greater than one third by pleural effusion, atelectasis or cardiac silhouette.
*With regard to confluent edema, when the density in a part of divided lung field was visually similar to that of cardiac silhouette, the field was regarded as intense edema.
CSI, congestive score index.
Figure 2. Odd Ratio for Length of Hospital Stay and Composite of All-Cause Mortality
or Heart Failure Re-hospitalization at 90 days
Multivariable logistic regression models were adjusted for age, systolic blood pressure, left ventricular ejection fraction, blood urea nitrogen, estimated glomerular filtration rate and brain natriuretic peptide at admission.
Figure 2. Odd Ratio for Length of Hospital Stay and Composite of All-Cause Mortality
or Heart Failure Re-hospitalization at 90 days
Supplementary table 1. Correlation between Radiographic Congestion Index and Other
Congestive Variables
BP, blood pressure; NYHA, New York Heart Association; BUN, blood urea nitrogen; eGFR, estimated
glomerular filtration rate; BNP, brain natriuretic peptide; LVDVI, left ventricular diastolic volume index; LVEF, left ventricular ejection fraction; TMF, transmitral flow; E/e’, ratio of early mitral inflow velocity and mitral annular early diastolic velocity.
Supplementary table 2. Clinical Outcomes of Admission Radiographic Congestion Score
Index and Estimated Plasma Volume Status with Clinical, Echocardiographic and
Biological Congestive Variables
Dependent variables were defined as dichotomized length of hospital stay (10 days, median) and the composite of all-cause mortality or HF re-hospitalization at 90 days.
OR, odd ratio; CI, confidential interval; CSI, congestion score index; ePVS, estimated plasma volume.
Supplementary figure 1. Study Flow
WHF, worsening heart failure; CSI, congestion score index; ePVS, estimated plasma volume status; LOS, length of hospital stay.
*LOS is described as median value and composite indicates the composite outcome of all-cause death or HF re-hospitalization at 90 days.
Supplementary table 1. Correlation between Radiographic Congestion Index and Other
Congestive Variables
admission CSI
r p-Value
Clinical variables
Body mass index, kg/m² 0.23 0.02
Systolic BP, mmHg 0.13 0.16
NYHA class 0.14 0.21
Oxygen, L/min 0.43 <0.001
Biological variables ePVS, dl/g
Serum Sodium, mEq/l
0.19 0.002 0.04 0.98 BUN, mg/dl -0.12 0.21 eGFR, ml/min/1.73m² 0.17 0.06 BNP, pg/ml -0.14 0.12 Echocardiographic variables LVDVI, ml/m² -0.005 0.97 LVEF, % 0.07 0.46
TMF E wave deceleration time, msec 0.03 0.73
E/e' 0.07 0.44
Inferior vena cava, mm -0.20 0.06
Pulmonary artery systolic pressure, mmHg 0.25 0.01
Tricuspid annular plane systolic excursion, mm 0.26 0.006
Supplementary table 2. Clinical Outcomes of Admission Radiographic Congestion Score Index and Estimated Plasma Volume Status
with Clinical, Echocardiographic and Biological Congestive Variables
Length of hospital stay Composite outcome at 90 days
Univariable analysis Multivariable analysis Univariable analysis Multivariable analysis
OR (95% CI) p-Value OR (95% CI) p-Value OR (95% CI) p-Value OR (95% CI) p-Value
CSI admission variables
continuous CSI 1.40 (0.91 - 2.14) 0.13 2.13 (1.27 – 3.72) <0.01 1.02 (0.63 - 1.65) 0.92 1.26 (0.71 – 2.31) 0.44
dichotomized CSI 2.04 (1.01 - 4.11) 0.046 4.36 (1.85 – 10.88) <0.01 1.90 (0.87 - 4.15) 0.11 2.96 (1.11 – 8.41) 0.03
ePVS admission variables
continuous ePVS 1.27 (0.99 – 1.63) 0.057 1.30 (0.95 – 1.82) 0.11 1.35 (0.98 - 1.86) 0.07 1.14 (0.81 – 1.63) 0.45
dichotomized ePVS 1.44 (0.78 – 2.69) 0.24 1.60 (0.75 – 3.48) 0.23 2.33 (0.96 - 5.66) 0.06 1.67 (0.68 – 4.19) 0.26