HAL Id: hal-00784892
https://hal.archives-ouvertes.fr/hal-00784892
Submitted on 17 Mar 2021
HAL is a multi-disciplinary open access
archive for the deposit and dissemination of
sci-entific research documents, whether they are
pub-lished or not. The documents may come from
teaching and research institutions in France or
abroad, or from public or private research centers.
L’archive ouverte pluridisciplinaire HAL, est
destinée au dépôt et à la diffusion de documents
scientifiques de niveau recherche, publiés ou non,
émanant des établissements d’enseignement et de
recherche français ou étrangers, des laboratoires
publics ou privés.
Electronic hardware design of a low cost tactile sensor
device for physical Human-Robot Interactions
Ganna Pugach, Viacheslav Khomenko, Artem Melnyk, Alexandre Pitti,
Patrick Henaff, Philippe Gaussier
To cite this version:
Ganna Pugach, Viacheslav Khomenko, Artem Melnyk, Alexandre Pitti, Patrick Henaff, et al..
Elec-tronic hardware design of a low cost tactile sensor device for physical Human-Robot Interactions.
ELNANO 2013 - 33rd IEEE International Scientific Conference Electronics and Nanotechnology, Apr
2013, Kiev, Ukraine. pp.5, �10.1109/ELNANO.2013.6552033�. �hal-00784892�
HAL Id: hal-01673374
https://hal.archives-ouvertes.fr/hal-01673374
Submitted on 29 Dec 2017
HAL is a multi-disciplinary open access
archive for the deposit and dissemination of
sci-entific research documents, whether they are
pub-lished or not. The documents may come from
teaching and research institutions in France or
abroad, or from public or private research centers.
L’archive ouverte pluridisciplinaire HAL, est
destinée au dépôt et à la diffusion de documents
scientifiques de niveau recherche, publiés ou non,
émanant des établissements d’enseignement et de
recherche français ou étrangers, des laboratoires
publics ou privés.
Electronic hardware design of a low cost tactile sensor
device for physical Human-Robot Interactions
Ganna Pugach, Viacheslav Khomenko, Artem Melnyk, Alexandre Pitti,
Patrick Henaff, Philippe Gaussier
To cite this version:
Ganna Pugach, Viacheslav Khomenko, Artem Melnyk, Alexandre Pitti, Patrick Henaff, et al..
Elec-tronic hardware design of a low cost tactile sensor device for physical Human-Robot Interactions.
ELNANO 2012 - IEEE 32nd International Scientific Conference on Electronics and Nanotechnology,
Apr 2012, Kiev, Ukraine. �hal-01673374�
Electronic hardware design of a low cost tactile
sensor device for physical Human-Robot Interactions
Ganna Pugach, Viacheslav Khomenko, Artem Melnyk
Electrical Engineering Department, National Technical University of Donetsk,
Donetsk, Ukraine anna.pougatch@gmail.com slava.khomenko@gmail.com
artemmelnyk@gmail.com
Alexandre Pitti, Patrick Henaff, Philippe Gaussier
ETIS, UMR 8051, CNRS-UCP-ENSEA, University of Cergy-Pontoise,
Cergy-Pontoise, France alexandre.pitti@ensea.fr patrick.henaff@u-cergy.fr
gaussier@ensea.fr
Abstract—This paper proposes a low-cost system, based on the method of Electrical Impedance Tomography (EIT), for data acquisition from soft conductive fabric, for the purposes of designing of robots artificial skin. A simple multiplexer/ demultiplexer circuit is used for retrieving the resistance field from the pair-wised electrodes which inject the electrical current and the electrodes which measure the output voltage from the conductive fabric. A microcontroller governs the injection of current, voltage output patterns and the analog-digital conversion, from the tactile material. After explanation of the EIT method, the electronics corresponding to the data acquisition is presented and the material characteristics are analyzed. The results show that the spatial patterns of the tactile contact can be acquired and localized in real time.
Keywords—tactile sensors, artificial skin, Electrical Impedance Tomography, EIDORS.
INTRODUCTION
With respect to vision and audition modalities, tactile modality is now considered to be an important feature to achieve in robots in order to enable them with intelligent and adaptive behaviors like grasping an object or touching people [1]. This aim in mind, nowadays hardware technology permits the development of new artificial skins devices [2–4]. Combined with the visual and auditory senses and proprioception, artificial skins would provide additional sensory perception to robots and demultiply their capabilities.
Several techniques have been proposed for which most of them are using isolated unitary devices that cover the specified surface and for which each is reacting to a small receptive field [5–8]. Another promising method is the use of large conductive fabric sheets that reacts to electrical variations on its surface. Using inversion methods like the well-known Electrical Impedance Tomography (EIT), it is possible to reconstruct the spatial location on its surface [9]. Compared to more classical methods, this technique is (1) inexpensive in the design, (2) allows to cover large surface portions, (3) allows to be nearest the design of the human-skin. Despite these advantages, fast acquisition and cheap reconstruction algorithms are still a drawback [10, 11].
The paper is organized as follows. The second section describes the current state of art in artificial skins based on imaging reconstruction methods and presents the Electric Impedance Tomography (EIT) method. The third section explains the design and the test results from our robotic tactile feedback device. Finally, in the fourth section, draws a conclusion and our future works.
STATE OF ART IN ARTIFICIAL SKINS BASED ON IMAGING RECONSTRUCTION METHODS
Kato et al. [12], Nagakubo et al. [13] realized a “skin”–like device for robots. They applied the Electrical Impedance Tomography (EIT) method and inverse problem analysis (IPA) to sensitive skin: by injecting currents and measuring voltages from connected electrodes on the borders of a rubberized conductive fabric, they reconstructed the local resistivity changes response from any applied pressure on the material.
The IPA enables to have a non-invasive estimation of the internal state of an object by performing measurements only on the object boundaries. These inverse techniques are implemented in different technologies: Computed tomography (CT) [14] and CT Scan (CTS) for X-rays analysis, Magnetic Resonance Imaging (MRI) [15], Positron Emission Tomography (PET) [16] to detect pairs of gamma rays emitted as a result of the collision between positron-emitting radio-isotope, Electrical Capacitance Tomography (ECT) [17] and Electrical Impedance Tomography (EIT) [18] that estimate the capacitance and impedance distribution inside a conductive material by injecting currents from different locations on the boundary and measuring the resulting electric potential distribution on it.
A. Electrical Impedance Tomography
The EIT aims at reconstructing a 2D or 3D cross-sectional image of the internal spatial distribution of conductivity from electrical measurements by injecting small currents (DC or AC) via electrodes array placed on the surface of the investigated object. The advantages of EIT compared to conventional imaging techniques such as CT or MRI is that (1) it is considered safer by merit of the small alternating currents required; (2) it can be used as a long-term, continuous imaging method; and (3) the system can be constructed at low-cost and in a very portable size [19].
This work is supported by the French/Ukrainian Dnipro Project 24316WA, the French embassy in Ukraine (program “master in partnership”), the INTERACT French project ANR-09-CORD-014.
The EIT method has been applied to many domains. In medicine, it has been used for gastric emptying and pH measurements [20], cancer detection [21] and tissue characterization [22]. In industry, it has been used for the non-destructive testing of polycrystalline diamond [23], 3D malformations detection in industrial pressure filtration systems [24]. In geophysics, it has been used for measuring the polarization properties of soils and sediments [25] and the analysis of gravel-air-seawater mixture [26].
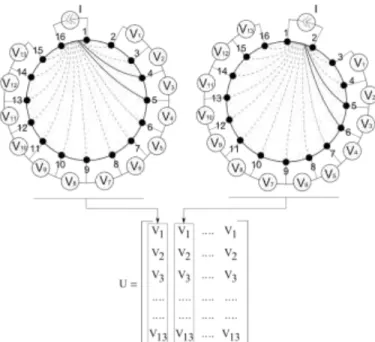
Different EIT reconstruction methods was proposed. The neighboring method [27], applies a current to neighboring electrodes and measures the voltage from the other electrode pairs. Fig. 1 depicts the idea of this method for a cylindrical volume conductor with 16 symmetrically spaced electrodes. The current is applied to electrodes pair 1-2, for which the current density is now highest in the material between them. The current density is decreasing rapidly as a function of distance.
The voltage difference is measured between the other pairs of electrodes, which corresponds to 13 measurements, for reconstructing the impedance between the equipotential lines that intersect the measurement electrodes. At the next round, we inject the current to the electrodes pairs 2-3, and measure the successive set of 13 potential differences, till the end of the sequence.
Another method, named cross method [28] does not have sensitivity in the periphery as good as the neighboring method, but it has better sensitivity over the entire region. The opposite method for the impedance measurement [28] gives more uniform current distribution and has a good sensitivity.
Fig. 1. Neighboring method of data collection show for a cylindrical volume conductor and 16 symmetrically space electrodes.
In order to reconstructed sensorial image from EIT, several methods were proposed such as the back-projection method, the layer-stripping method and various iterative methods [29].
The most popular method for image reconstruction is the Newton’s iterative method [30].
B. Image reconstruction with Newton’s iterative method
The goal of the Newton’s method is to minimize the error between the voltages obtained by forward modeling and those measured from the conductive sensor. The forward model is obtained from the Maxwell’s equation and from a Finite Element Method (FEM) model of the sensor’s body (see [30] for more details):
(1) is the resistance distribution and c the injected current. A Jacobian Matrix represents the effect on the boundary voltages for a slight change in the resistivity of the FEM elements. A resistance distribution allows to calculate the Jacobian Matrix and to use it to estimate accurately the resistance distribution. An iterative process, starting from an initial resistance distribution, converges towards the true resistance distribution. Equation of the ith step of the method are as following:
‖ ‖ ‖ ‖ (2) (3)
(4)
is the gradient of the forward model with respect to the resistance distribution, and ‖ ‖ is a regularization term introduced to stabilize the response. h defines the smoothness of the estimated resistance distribution. R is the Laplace image prior or the unity matrix.
PROPOSED TACTILE SENSOR BASED ON VELOSTAT
Conductive rubbers are conceived with carbon as conductive particles. The rubber material used in this paper is the 3M™ Velostat[31]. The initial resistance of the material is approximately 500 Ohms/m and it is sensitive to both pressure and stretch. Nonetheless, since the material is not extremely deformable, the sensibility towards pressure is quite feeble. Those materials have been applied in tactual sensing during a period of 10-20 years. This is the most common used material when examining EIT-based tactile distribution sensors.
C. Analysis of rubber sensitivity
In the case of most conductive rubber, at the time of load removal, the conductivity of the region overshoots to a peak and then restores to the original value. Especially, fast load removal causes larger hysteresis while a slower load removal causes smaller hysteresis. The dynamic characteristics of conductive rubber with respects to fast or slow pressure removal are less well investigated.
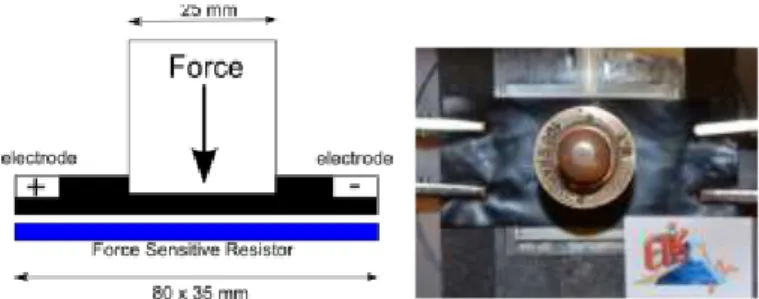
The response of an 80 mm x 25 mm Velostat conductive sheet connected to 4 electrodes is investigated, with one pair for current injection and the other for voltage measurement (Fig. 2).
Fig. 2. Experimental device to measure tissue properties in physical contact with the object.
The force at the center of the material was applied, and it's voltage response was measured. The experiments were performed with conductive weights (Fig. 3) and with non-conductive weights (Fig. 4).
Fig. 3. Properties of the conductive rubber material to various conductive weights. Top: Pressure in [Pa]; Bottom: Resistance in [Ohm].
Fig. 4. Properties of the conductive rubber material to various non-conductive weights. Top: Pressure in [Pa]; Bottom: Resistance in [Ohm].
Various conductive objects of different weights were placed on the conductive material and its resistivity was measured (Fig.3). It was observed that the conductive material responds almost proportionally to the weights (Fig. 5), which permits to discriminate distinctly various resistance profiles.
In comparison to its previous behavior, the conductive rubber weakly for the case of non-conductive objects responds very poorly.Here, its resistance varies only slightly to different pressure values and no clear discrimination is possible (Fig.4). Therefore, it can be concluded that the conductive rubber works in a quasi-linear regime with the possibility to discriminate the pressure applied by conductive objects. For the case of non-conductive objects, conductive rubbers possess a
high hysteresis which does not make them the most suitable material because its resistance does not return back steadily to its initial value.
Fig. 5. Dependence of the resistance on the pressure.
Finally, one conductive layer (for example conductive aluminum laminated fabric) was added between a non-conductive object and rubber, and the same type of the characteristics (Fig.5.) as in the interaction with a conductive object was obtained.
D. Data acquisition principle
Fig. 6 illustrates the components of a basic EIT system. The system typically has 16 electrodes placed on the boundary of the conductive material. The device is used to inject current and measure the voltages. It then sends a data frame to the PC where the resistance distribution of the material is estimated.
Fig. 6. Architectural overview of the proposed wireless impedance analyzer supporting 16 data acquisition channel.
The system developed by our team comprises a base-station and a scan-head. The scan-head has a double demultiplexers circuit used for applying the excitation current between any 2 electrodes and the double multiplexers circuit used for switching between other 13 electrodes of tissue surface for connect to the base-station. If the injected current is a DC current, then the electric potentials are measured on all of the boundary electrode pairs. If the injected current is an AC current, then the voltage amplitude and lag (relative to the AC current) are measured. Also the scan-head has an instrumental amplifier for the current source.
The base-station has a 8-bit micro-controller for data sampling using a 10-bit analog-to-digital converter (ADC). It has also a versatile multiplexor interface with a wireless
impedance analyzer to offer 16 independently addressable channels to which the current can be injected and to which the sensing of the boundary potential can be simultaneously measured.
Although many methods can be used among the different measurement strategies [27, 28], the neighboring method was chosen for its robustness. Our system was originally intended for 35 Hz sampling. Moreover, preliminary studies on the material have shown the feasibility to work with currents from 50 to 200 μA.
Despite its benefits, one of the disadvantage of the neighboring method is that it is impossible to provide a very high sensitivity since the potential difference between the electrodes near the current source is very high (up to 0.5V for a given maximum current of 200 μA), while the potential difference between electrodes which are far from the current source is rather small (20 mV). This drawback limits the maximum rate of the differential amplifier about ten times its sensitivity.
E. Experimental results
The spatial location of the conductive weights and the resistance density distribution was reconstructed with the MATLABTM toolbox EIDORS (Electrical Impedance and Diffused Optical Reconstruction Software) [32]. This software is composed of three software for mesh generation, forward problem and the inverse problem [33].
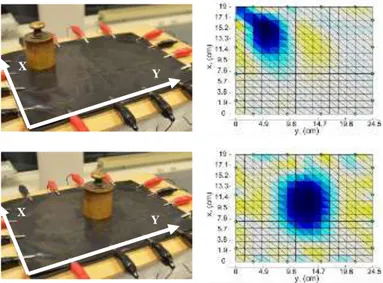
Fig. 7. Image reconstruction with use EIDORS.
The experimental setup for two different locations in the rubber surface in coordinate (X,Y) and the image reconstruction for the top-left corner and the center position are depicted in Fig. 7. This figure shows respectively the boundary effects on the surface and the localization error on the center.
In order to measure the accuracy of the EIT image reconstruction, the relative localization error in centimeters (relative to the X and Y axis) is plotted on Fig. 8. The {green/blue/red} colors indicate the relative errors depending on the weight location and the relative distance to the X or Y axis; resp. 5.5cm/12.5cm/19cm. As one can observe, the
maximum localization error on the fabric is less than 3.5% at the center position, which means that the software EIDORS can reconstruct with high accuracy, with approximately a distance error of 7mm. On the borders, the error diminishes to less than 1mm of error.
Fig. 8. Relative error of the determination of the position of the object on the conductive fabric.
CONCLUSIONS AND PERSPECTIVES
In this paper, a low-cost method of EIT data acquisition from soft conductive fabric for the design of a robotic artificial skin was presented. The electronic designed data allows realizing the neighboring method of impedance tomography. The advantages are following (1) excellent noise characteristics due to the high proportion of the load impedance (10 ohms) to the internal resistance of the multiplexers (not more than 10 Ohm), (2) high performance data, (3) low power consumption, which is a priority for self-contained use of the data, (4) low cost, high reliability and integration.
The classical reconstruction approaches for estimating the resistivity distribution on the tactile sheet were used. Experiments showed some good performances for accurately determining the contact surface with an object. The research done on the conductive rubber VelostatTM characteristics showed that its resistance varies only slightly with a non-conductive object, which requires increasing the material's sensitivity.
In future applications, increased spatial resolution with machine learning methods will be investigated for more spatial accuracy to the material properties. In EIT method, for instance, the reconstruction is analytical, which requires (1) to know exactly the tissue dimension and (2) a compute time costly matrix inversion. Learning algorithms, such as neural networks, will be considered to provide more robustness and more adaptivity to spatial localization (independently on its dimension) and to provide faster response for estimating the resistance distribution on the tissue's surface.
Furthermore, the bandwidth resolution of the acquisition device is limited by the high voltage range retrieved from the electrodes, which is in the interval [10-3 mV, 100 mV]. New electronic devices should investigate how to reduce this range for higher precision.
ACKNOWLEDGMENT
The authors thank to Pr. V. Borissenko, prof. Kovaliev A., National Technical University of Donetsk, Ukraine.
Y X
Y X
REFERENCES
[1] R. Alami, A. Albu-Schaeffer, A. Bicchi, R. Bischoff, R. Chatila, A. De Luca, A. De Santis, G. Giralt, J. Guiochet, G. Hirzinger, F. Ingrand, V. Lippiello, R. Mattone, D. Powell, S. Sen, B. Siciliano, G. Tonietti and L. Villani, ”Safe and Dependable Physical Human-Robot Interaction in Anthropic Domains: State of the Art and Challenges“, Proc. IROS’06 Workshop on pHRI - Physical Human-Robot Interaction in Anthropic Domains, 2006.
[2] H. Alirezaei, A. Nagakubo, and Y. Kuniyoshi, “A tactile distribution sensor which enables stable measurement under high and dynamic stretch,” IEEE Symp. 3D User Interfaces, pp. 87–93, 2009.
[3] M.Inaba, Y.Hoshino, K.Nagasaka, T.Ninomiya, S.Kagami, and H.Inoue, “A full-body tactile sensor suit using electrically conductive fabric and strings,” In Proc. of the RSJ/IEEE Int. Conf. on Intelligent Robots and Systems vol.2, pp. 450- 457, November 1996.
[4] Y.Ohmura, Y.Kuniyoshi and A.Nagakubo, ”Conformable and Scalable Tactile Sensor Skin for Curved Surfaces,” in Proc. of Int. Conf. on Robotics and Automation,vol. 6, pp.1348-1353,May 2006.
[5] H.-K. Lee, S.-Il Chang, and E. Yoon, “A flexible polymer tactile sensor: fabrication and modular expandability for large area deployment,” Jour. Microelectromec. Sys., vol. 15, pp. 1681-1686, Decembre 2006. [6] E. Meister, I. Zilberman, and P. Levi, “Fuzzy Logic Based Sensor Skin
for Robotic Applications,” In Proc. of Intl. Conf. on Artificial Intelligence, Las Vegas, USA, July 2012.
[7] X. Lamy, F. Colledani, F. Geffard, Y. Measson and G. Morel, "Robotic skin structure and performances for industrial robot comanipulation," IEEE/ASME Intern. Conf. Advanc. Intellig. Mechatron., vols.1-3, pp.427-432, July 2009.
[8] G. Cannata, M. Maggiali, G. Metta and G. Sandini, “An embedded artificial skin for humanoid robots,” Proc. of the IEEE Intl. Conf. on Multisensor Fusion and Integration for Intelligent Systems, pp. 434-438, August 2008.
[9] D. S. Tawil, D. Rye and M. Velonaki, “Touch Modality Interpretation for an EIT-Based Sensitive Skin,”in Proc. of the IEEE Intl. Conf. on Robot. and Autom., pp. 3370-3376, August 2008.
[10] T. Miyashita,, T. Tajika,H. Ishiguro,K. Kogure and N. Hagita, “Haptic Communication between Humans and Robots ,” Spring. Tracts in Advanc. Robotics, vol. 28, pp. 525-536, 2007.
[11] P. Maiolino, A. Ascia, L. Natale, G. Cannata, G. Metta, “Large scale capacitive skin for robots,” Smart actu. sens. sys. - Recent advances and future challenges. InTech, Ed. Berselli, G. R Vertechy, G. Vassura, ISBN:979-953-307-990-4, (pp.16), 2012.
[12] Y. Kato, T. Mukai, T. Hayakawa, and T. Shibata, “Tactile Sensor without Wire and Sensing Element in the Tactile Region Based on EIT Method,” IEEE Sensors, pp. 792–795, October 2007.
[13] A. Nagakubo, H. Alirezaei, and Y. Kuniyoshi, “A deformable and deformation sensitive tactile distribution sensor,” in Proc. IEEE Int. Conf. Robotics and Biomimetics, 2007, pp. 1301–1308.
[14] R.M. Lewitt and S. Matej, "Overview of methods for image reconstruction from projections in emission computed tomography," Proc. of the IEEE, vol. 93, pp.1588-1611, October 2003.
[15] Bohare M. D, Cheeran A. N and Sarode V, “Analysis of Breast MRI images using Wavelets for Detection of Cancer” ICEICE 2011, Proceedings published by International Journal of Computer Applications (IJCA).
[16] J. M. Ollinger, and J.A. Fessler, “Positron-emission tomography,” IEEE Signal Processing Magazine, vol. 14, pp. 43-55, January 1997. [17] W. Q. Yang. “Hardware design of electrical capacitance tomography
systems”, Measurement Science Technology, vol. 7, 225, 1996 [18] K. Okazaki, A. Tangoku, T. Morimoto, K. Hattori, R. Kotani, E.
Yasuno, M. Akutagawa, Y. Kinouchi, “Basic study of a new diagnostic modality by non-invasive measurement of the electrical impedance tomography (EIT) on localized tissues,” ICBPE, pp. 1-5, December 2009.
[19] Webster J. G, “Medical Instrumentation Application and Design”, Third edition, Wiley India, 2007.
[20] N. Vaisman, N. Weintrob, A. Blumental, Z. Yosefsberg, and P. Vardi, “Gastric Emptying in Patients with Type I Diabetes Mellitus,” Annals of the New York Academy of Sciences, vol. 873, no. 1, pp. 506–511, 1999. [21] Y. Ultchin, U. Nachaliel, and A. Ori, “Indirect calculation of breast
tissue impedance values,” Physiolog. Meas., vol. 23, pp. 177-182, January 2002.
[22] J. Conway, M. Hawley, Y. Mangnall, H. Amasha, and G. C. van Rhoon, “Experimental assessment of electrical impedance imaging for hyperthermia monitoring,” Clin. Phys. and Physiolog. Meas., vol. A13, pp. 185-189, April 2007.
[23] G. Bogdanov, R. Ludwig, J. Wiggins, and K. Bertagnolli, “Non destructive testing of polycrystalline diamond cutters using dc electrical conductivity imaging,” Meas. Sci. Technol., vol. 20 095707 (10pp) July 2007.h
[24] L. M. Heikkinen, J. Kourunen, T. Savolainen, P. J. Vauhkonen, J. P. Kaipio, and M. Vauhkonen, “Real time three-dimensional electrical impedance tomography applied in multiphase flow imaging,” Meas. Sci. and Technol., vol. 17, pp. 2083-2087, July 2006.
[25] E. Zimmermann, A. Kemna, J. Berwix, W. Glaas, and H. Vereecken, “EIT measurement system with high phase accuracy for the imaging of spectral induced polarization properties of soils and sediments,” Meas. Sci. Technol., vol. 19, 094010 (9pp.), July 2008.
[26] G. Teague, J. Tapson, and Q. Smit, “Neural network reconstruction for tomography of a gravel-air-seawater mixture,” Meas. Sci. Technol., vol. 12, pp. 1102-1108, July 2001.
[27] B.H. Brown and A.D. Seagar, “The Sheffield data collection system,” Clin. Phys. Physiol. Meas., vol. 8A, pp. 91-97, 1987.
[28] P. Hua, “Effect of the measurement method on noise handling and image quality of eit imaging,” Proc. Annu. Int. Conf. Engng Med. and Biol. Soc., vol. 9, pp. 1429–1430, 1987.
[29] W. Lionheart, N. Polydorides, and A. Borsic, “The reconstruction problem,” in Electrical Impedance Tomography: Methods, History and Applications, D. S. Holder, Ed. Bristol and Philadelphia: Institute of Physics Publishing, 2005, pp. 3–63.
[30] H. Alirezaei, A. Nagakubo, and Y. Kuniyoshi, “A highly stretchable tactile distribution sensor for smooth surfaced humanoids,” in Proc. IEEE-RAS International Conference on Humanoid Robots (ICHR ‘07), Pittsburgh, Pennsylvania, November 2007, pp. 167–173.
[31] http://www3.3m.com/catalog/uk/en002/electronics_mfg/static_control_p ackaging/node_JV20CN7XFBbe/root_K3BHNB8005gv/vroot_5KR9K2 C2KZge/gvel_JQGPTT9723gl/theme_uk_staticcontrolpackaging_3_0/c ommand_AbcPageHandler/output_html
[32] A. Adler and W. R. B. Lionheart, “Uses and abuses of EIDORS: an extensible software base for EIT,” Physiological Measurement, vol. 27, no. 5, pp. 25–42, 2006.
[33] Vauhkonen M., Lionheart W.R.B, Heikkinen L.M.,. Vauhkonen P. J and Kaipio J. P,”A MATLAB Package for the EIDORS project to reconstruct two-dimensional EIT images”, ISSN 0788-4672, September 2000.