HAL Id: hal-00296138
https://hal.archives-ouvertes.fr/hal-00296138
Submitted on 9 Feb 2007
HAL is a multi-disciplinary open access
archive for the deposit and dissemination of
sci-entific research documents, whether they are
pub-lished or not. The documents may come from
teaching and research institutions in France or
abroad, or from public or private research centers.
L’archive ouverte pluridisciplinaire HAL, est
destinée au dépôt et à la diffusion de documents
scientifiques de niveau recherche, publiés ou non,
émanant des établissements d’enseignement et de
recherche français ou étrangers, des laboratoires
publics ou privés.
First-year sea-ice contact predicts bromine monoxide
(BrO) levels at Barrow, Alaska better than potential
frost flower contact
W. R. Simpson, D. Carlson, G. Hönninger, T. A. Douglas, M. Sturm, D.
Perovich, U. Platt
To cite this version:
W. R. Simpson, D. Carlson, G. Hönninger, T. A. Douglas, M. Sturm, et al.. First-year sea-ice contact
predicts bromine monoxide (BrO) levels at Barrow, Alaska better than potential frost flower contact.
Atmospheric Chemistry and Physics, European Geosciences Union, 2007, 7 (3), pp.621-627.
�hal-00296138�
www.atmos-chem-phys.net/7/621/2007/ © Author(s) 2007. This work is licensed under a Creative Commons License.
Atmospheric
Chemistry
and Physics
First-year sea-ice contact predicts bromine monoxide (BrO) levels at
Barrow, Alaska better than potential frost flower contact
W. R. Simpson1, D. Carlson1, G. H¨onninger1,2,†, T. A. Douglas3, M. Sturm3, D. Perovich3, and U. Platt2
1Geophysical Institute and Department of Chemistry, University of Alaska Fairbanks, Fairbanks, AK 99775-6160, USA
2Institute for Environmental Physics, University of Heidelberg, Im Neuenheimer Feld 229, 69120 Heidelberg, Germany
3U.S. Army Cold Regions Research and Engineering Laboratory, P.O. Box 35170, Fort Wainwright, AK 99703-0170, USA
†deceased
Received: 23 October 2006 – Published in Atmos. Chem. Phys. Discuss.: 7 November 2006 Revised: 24 January 2007 – Accepted: 6 February 2007 – Published: 9 February 2007
Abstract. Reactive halogens are responsible for
boundary-layer ozone depletion and mercury deposition in Polar Re-gions during springtime. To investigate the source of reac-tive halogens in the air arriving at Barrow, Alaska, we mea-sured BrO, an indicator of reactive halogen chemistry, and correlated its abundance with airmass histories derived from meteorological back trajectories and remotely sensed sea ice properties. The BrO abundance is found to be positively
correlated to first-year sea-ice contact (R2=0.55), and
es-sentially uncorrelated with potential frost flower (PFF)
con-tact (R2=0.04). Assuming that PFF accurately predicts frost
flowers, these data indicate that snow and ice contaminated with sea salts on first-year sea ice is a more probable bromine source than are frost flowers, for airmasses impacting Bar-row, Alaska. Climate-driven changes in Arctic sea ice are likely to alter frost flower and first year sea ice prevalence. An accurate understanding of how these sea ice changes would affect the halogen chemistry of the overlying atmo-sphere depends upon understanding the relative roles of frost flowers and saline snow and ice surfaces as reactive bromine sources.
1 Introduction
During late winter and spring, oxidation chemistry in the Arctic troposphere shifts from being dominated by ozone photochemistry to being dominated by halogen chemistry, especially reactive bromine chemistry. This shift has pro-found influences that range from depletion of tropospheric ozone to deposition of mercury to alteration of the fate and lifetime of organic pollutants (Barrie et al., 1988; Schroeder et al., 1998). The majority of the bromine atoms responsi-ble for ozone depletion and mercury deposition come from
Correspondence to: W. R. Simpson
salts containing bromide (Br−) that originate from the ocean (McConnell et al., 1992) and are oxidized to bromine atomic radicals through an autocatalytic reaction pathway known as the bromine explosion (Fan and Jacob, 1992). The trans-fer mechanism by which the salts become atmospherically accessible is not currently understood, yet this mechanism plays a fundamental role in activating halogens that deposit airborne contaminants (e.g. Hg) to the terrestrial cryosphere. Two hypotheses have been presented for the mechanism of bromide salt transport from the ocean to reactive bromine in the atmosphere. Frost flowers, which are highly saline, have been proposed to provide the surface from which bromine is released (Rankin et al., 2002). Kaleschke et al. (2004) used remotely sensed sea ice data to predict where frost flowers may be forming on sea ice. They introduced a proxy they called potential frost flowers (PFF), which is calculated by a thermodynamic model of sea ice and frost flower growth and found that PFF is correlated with BrO detected by satellite. Jones et al. (2006) found that ozone depletion events detected at Halley Bay, Antarctica were correlated with airmass mo-tions that brought air in contact with a large coastal polynya that often produces frost flowers. Snow and ice surfaces con-taminated with salts, which are prevalent on first-year sea ice, has also been proposed to be the surface from which bromine
is released. Direct mass-spectroscopic evidence of Br2 and
BrCl (precursors of BrO) release from snow (Foster et al.,
2001), and Br− depletions in coastal snow (Simpson et al.,
2005) provide evidence for the saline snow hypothesis. Satel-lite observations (Wagner et al., 2001) and ground-based ob-servations of BrO in Antarctica (Frieß et al., 2004) also point to first-year ice as an important region for bromine activa-tion. These two hypotheses for how sea salt bromide be-comes atmospherically accessible and chemically activated are clearly limiting endpoints of a spectrum of halogen acti-vation mechanisms and the actual process in nature is likely to involve a mixture of both processes.
622 W. R. Simpson et al.: Sea ice, frost flowers and halogen activation
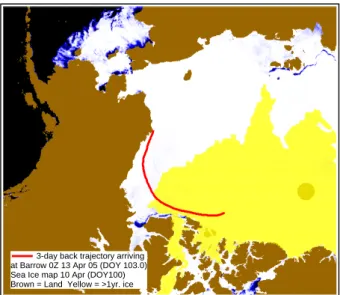
3-day back trajectory arriving at Barrow 0Z 13 Apr 05 (DOY 103.0) Sea Ice map 10 Apr (DOY100) Brown = Land Yellow = >1yr. ice
Fig. 1. An example of a 3-day back trajectory arriving at Barrow, Alaska. The arrival time is 00:00 UTC on 13 April 05 (DOY 103.0). The sea-ice map is shown for 10 April because the main contact of these trajectories with open water occurred on that day. The proper sea-ice map is used for each day of the trajectory calculation. The ice map shows brown for land, a gradation from black to white via blue tones for ice concentration, from AMSR-E data, and yellow for the area identified as multi-year ice from QuikSCAT sea ice age estimations.
concentrated salt solution. Some of this brine is forced to the new ice surface, causing high initial salinities of 50–100 parts per thousand by weight (‰, where Arctic Ocean sea-water salinity ≈30‰). As the ice ages, the salinity decreases to approximately 5–10‰. Snow on sea ice is contaminated by salts when brine wicks up the snow or the wind scours the snow to re-expose saline surfaces or salt aerosols deposit to the snow (Domin´e et al., 2004). Sea ice that survives the summer has a much lower salinity because the brine drains away during summer melting. Therefore, multi-year sea ice (MYI) and land surfaces contain less atmospherically acces-sible salt and are less likely to be reactive halogen sources than first-year sea ice (FYI). Frost flowers form when open leads or polynyas freeze over and small nodules in the form-ing ice act as condensation nuclei for vapor deposition of an-gular ice crystals that look like delicate flowers. The flowers wick brine from the sea-ice surface producing highly saline (≈100‰) crystals (Perovich and Richter-Menge, 1994) with specific surface areas similar to that of depth hoar (Domin´e et al., 2005). The purpose of this paper is to compare ground-based observations of halogen activation to airmass histories where we calculate the contact time of air with first-year sea ice (FYI) and potential frost flowers (PFF). While it is clear that the actual process for activating halogens is very com-plex and includes boundary-layer meteorology, solar radi-ation, and many other factors, we have selected these two
simply calculated properties to see which is better at predict-ing halogen activation in a long time series of atmospheric chemical composition data. Bottenheim and Chan (2006) have very recently carried out a trajectory analysis that ex-amined source regions of ozone-depleted airmasses, which provides an excellent complement to this work and is dis-cussed below. Model calculations indicate that the timescale for depletion of ozone is on the order of a day (Fan and Ja-cob, 1992; McConnell et al., 1992); therefore, ozone deple-tion would be convoluted with transport during our three-day trajectories. For this reason, direct observations of bromine monoxide (BrO) are chosen to quantify halogen activation instead of depletion of ozone.
2 Methods
The contact time of an air parcel with potential frost flow-ers (PFF) or first-year ice (FYI) is calculated by combining back-trajectory analysis and remotely sensed sea-ice data. The trajectory analysis provides air motion and temperature data, while the remote-sensing data provides information on where open water and ice are present. In the PFF calculation, open water is assumed to be freezing over and producing new frost flowers with increasing efficiency as the temperature de-creases (Kaleschke et al., 2004). Figure 1 shows an example of this calculation where a trajectory passes near a coastal polynya in the vicinity of Banks Island, Canada.
We performed many tests where the recently past sea ice conditions (up to 5 days earlier) were considered instead of the current sea-ice conditions. The idea of these tests was to see if frost flowers that may have formed a few days be-fore the trajectory passed over a region were responsible for halogen activation. None of these tests showed significantly better correlation with BrO, and thus we present the results using the formulation used by Kaleschke et al. (2004) be-cause it has been accepted in the literature.
2.1 PFF calculation
For each hour during the winter/spring of 2005, we calculate a 72 h back trajectory at 50 m arrival height using the HYS-PLIT trajectory model (Draxler and Rolph, 2003) that used the National Center for Atmospheric Research (NCAR) fi-nal afi-nalysis from the FNL archive. In the time period shown (day of year, DOY, 80–120), there are 960 total trajectories considered. Other arrival heights (of 100 and 300 m) were explored and shown to have similar results. The open wa-ter fraction, assumed to be 1 – sea ice concentration, comes from the ARTIST sea ice (ASI) algorithm (Kaleschke et al., 2001) sea-ice maps (based upon advanced microwave scan-ning radiometer for EOS, AMSR-E data) at the 6.25 km res-olution (preliminary data from University of Bremen). Air-masses are propagated back along the prescribed trajectory and minutes of contact with open water are calculated on a
pixel-by-pixel basis using the appropriate daily sea-ice map. For example, if the trajectory spends 30 min in a particu-lar pixel, and the sea-ice fraction is 66% in that pixel, then there are (1−0.66) × 30 min =10 min of open water contact for this pixel. We then use the theoretical upper limit PFF parametrization (Kaleschke et al., 2004) based upon the par-cel’s temperature to calculate the percent of open water that could maximally be covered by frost flowers. Continuing the example, say the PFF parameterization indicates 50% PFF coverage. We then multiply the 10 min in this pixel by 0.5 to get 5 min of PFF contact. The PFF contact is then summed over the entire 72 h trajectory to get the total PFF contact for the airmass arriving at Barrow at the arrival time. If the tra-jectory goes over 1 km height, it is assumed to no longer have sea-ice contact. This 1 km height was chosen as a typical height of the convective cloud that would be in the presence of a lead. Airmass dispersion occurs in the atmosphere but is not accounted for in the trajectory calculation. Additionally, inaccurate meteorological fields cause back trajectory errors. Therefore, we added a feature to the calculation where the average sea ice concentration in a circle centered at the tra-jectory’s calculated position is used instead of simply the im-mediate pixel of the calculated position. This circle increases in radius as time is propagated backwards at 2 km/hr. This “diffusion” rate is about 1/10th of the wind speed and results in a radius of ≈140 km three days before arrival. Substitut-ing this algorithm for the simple pixel-by-pixel calculation only had a minor effect on the PFF time series, smoothing some high-frequency noise, and was chosen as more realis-tic. In the example shown in Fig. 1, the PFF contact is with the polynya areas near Banks Island, Canada and arises from the radial averaging algorithm causing overlap of the trajec-tory with the open water shown in that vicinity.
2.2 First-year sea-ice contact calculation
First year ice (FYI) contact is calculated in a similar manner along the same trajectories, following the method of Frieß et al. (2004). Regions of older ice (second year or older) were identified through examination of the QuikSCAT sea ice backscatter coefficient, which is a proxy for sea ice age (Kwok, 2004). The QuikSCAT data were downloaded from http://www.ifremer.fr/. We found that the region of older ice is relatively stationary during the 40-day period of analysis. Therefore, one mask of old sea ice, shown in yellow in Fig. 1, was generated from the observation on DOY 100 (10 April 2005). With this mask, we identify regions of first-year sea ice and sum the ice fraction times the contact time for each pixel along the trajectory. If the trajectory indicates that the parcel is at an altitude over 100 m (twice the 50 m arrival height), we consider the contact with the surface is lost and do not accumulate any first-year sea-ice contact. It is clear that this definition of contact with first-year sea ice is very crude, but as it will be shown, even such a crude definition is capable of explaining a great deal of the variance observed in BrO.
2.3 Chemical measurements
Bromine monoxide (BrO) and ozone were measured
contin-ually at Barrow, Alaska (71.3◦N, 156.7◦W) over the
win-ter and spring of 2005. Bromine monoxide was
mea-sured by multiple-axis differential optical absorption spec-troscopy (MAX-DOAS) (H¨onninger and Platt, 2002). Mea-surements were made at multiple viewing elevations to sep-arate stratospheric BrO from tropospheric BrO and to de-rive vertical profiles of the BrO concentration. Strict in-version of the data to concentration profiles is complicated by radiation transfer issues. Therefore, we chose the dif-ference in slant column density (DSCD) of BrO between a 2-degree elevation angle measurement and a near-coincident zenith measurement to quantify the tropospheric BrO abun-dance. The high degree of correlation shown in this work argues for the accuracy of this simple quantification of BrO.
For clear-sky conditions, 1014molecule cm−2DSCD
corre-sponds to about a 5 pmol/mol mixing ratio in a 1 km thick mixed layer. The peak values shown here are ≈30 pmol/mol, which is similar to values seen at other Arctic locations where halogen activation is prevalent (Hausmann and Platt, 1994; H¨onninger and Platt, 2002; Tuckermann et al., 1997). Hourly in-situ ozone mixing ratios were measured by the National Oceanic and Atmospheric Administration (NOAA) Earth Systems Research Laboratory/Global Monitoring Di-vision (ESRL/GMD).
3 Results
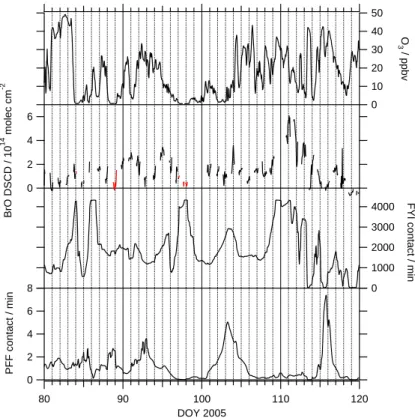
Figure 2 shows time series of ozone, BrO, FYI contact, and PFF contact for Barrow, Alaska. Ozone and BrO are gener-ally anticorrelated, as expected because BrO chemistry de-stroys ozone. Because it requires time for BrO chemistry to destroy ozone, the anticorrelation is not precise, and BrO is considered a better marker of halogen activation. BrO data are only recorded when the sun is up, which causes the BrO data to have gaps each night and appear as a dashed line. A few other data gaps occurred due to computer malfunc-tions. All time is kept in day of year UTC. The time zone for Barrow causes each day’s data to straddle a day bound-ary in UTC time. We refer to the DOY that a day’s obser-vations started on, because this is the DOY of the day in Barrow. The BrO data follow the FYI contact remarkably well, particularly the rapid variations during the period DOY 110 to 119. In contrast, the BrO shows little relationship to PFF. The largest BrO events (DOY 110 to 112) occur after very little PFF contact, while the largest PFF contact event, DOY 115, is correlated with essentially no BrO. Therefore, PFF appears unrelated to BrO. It is interesting to note that PFF is always quite low in these calculations (<8 min of the possible 4320 min in the trajectory). This finding indicates that there is little airmass contact with PFF for airmasses
624 W. R. Simpson et al.: Sea ice, frost flowers and halogen activation 6 4 2 0 BrO DSCD / 10 14 molec cm -2 120 110 100 90 80 DOY 2005 50 40 30 20 10 0 O 3 / ppbv 4000 3000 2000 1000 0
FYI contact / min
8 6 4 2 0 PFF contact / min
Fig. 2. Ozone, Bromine monoxide (BrO), first-year sea-ice contact (FYI), and potential frost flowers contact (PFF) timeseries in the period DOY 80–120. BrO data colored red occurred when ozone <1 nmol/mol.
impacting Barrow and is likely a contributor to the lack of correlation between BrO and PFF.
There are two days where FYI contact is high but BrO is near zero, DOY 88 and 97. Both of these days have ex-tremely low ozone, nearly always <1 nmol/mol, as indicated by the red coloring of all BrO data when O3<1 nmol/mol. At
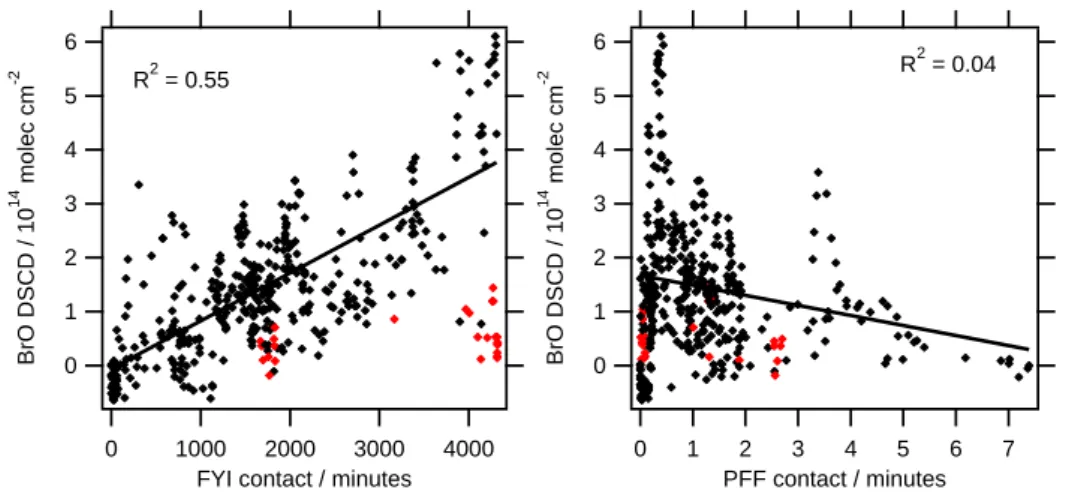
these low ozone levels, reactive bromine (the sum of the con-centrations of Br and BrO) partitions to Br atoms because the ozone necessary to form BrO is absent. Therefore, the absence of BrO on DOY 88 and 97 is expected, and we ex-clude these data from later analysis. At the times when ozone is depleted <1 nmol/mol, FYI is elevated and PFF is low to absent, in agreement with the findings from other airmasses. Figure 3 shows the correlations of BrO with FYI and BrO with PFF contact. BrO is positively correlated with FYI con-tact while BrO is weakly anticorrelated with PFF. Although the functional form of the relationship between BrO and FYI is unknown, a simple linear model appears to fit well and can
explain 55% of the variance in BrO (R2=0.55). This
corre-lation is quite impressive given inaccuracies in the trajectory model and inevitable variations in other important meteoro-logical parameters, such as wind speed and inversion height. On the other hand, a linear model of the dependence of BrO on PFF can explain <5% of the variance (R2=0.04), and the
slope of the correlation is opposite to the expectation that PFF should produce BrO. The intercept of this correlation, which indicates significant BrO in the absence of PFF con-tact also does not make sense. These findings clearly indicate
that contact with first-year sea ice provides the majority of re-active bromine to airmasses that arrive at Barrow during the ozone depletion season.
4 Discussion
The potential frost flower algorithm was chosen for this work because Kaleschke et al. (2004) reported that PFF from large polynya areas spatially matched regions of enhanced BrO de-tected by satellite. In the Kaleschke study, PFF came mostly from large coastal polynyas because those areas are a ma-jor source of open water in the Polar Regions. In our study, we also find that most airmasses with high PFF contacts can be traced to coastal polynyas or leads. Although there is commonly a lead a few kilometers from Barrow, this lead opens when winds drive ice away from the shore, and this lead seldom affects airmasses that blow onshore to the Bar-row site. Therefore, the leads/polynyas that contribute to PFF typically impact the airmass days before arrival at Barrow and the overall PFF contact time is quite low. If the influ-ence of polynyas/leads occurs relatively local to the source, their influence could have diminished before airmasses im-pact Barrow, which might explain the lack of correlation seen here. If it is the case that PFF produces only a local ef-fect, then there must be another source of reactive bromine, associated with sea ice, to explain the high levels of BrO ob-served at Barrow in this study.
6 5 4 3 2 1 0 BrO DSCD / 10 14 molec cm -2 4000 3000 2000 1000 0
FYI contact / minutes R2 = 0.55 6 5 4 3 2 1 0 BrO DSCD / 10 14 molec cm -2 7 6 5 4 3 2 1 0 PFF contact / minutes R2 = 0.04
Fig. 3. Correlation plots of BrO versus first-year sea-ice contact (left) and potential frost flowers contact (right). Data colored in red occurred when ozone <1 nmol/mol and were ignored from the correlation analysis.
In the Jones et al. (2006) study, ozone depletion was ob-served when airmasses passed over a coastal polynya, which they interpreted as being covered by frost flowers and these frost flowers providing reactive bromine to deplete the ozone. The trajectories shown in the Jones et al. (2006) paper also pass across areas of first-year sea ice before traversing the coastal polynya, so it is possible that a sea-ice source of bromine caused their ozone depletions instead of the inter-pretation that frost flowers caused the ozone depletion. In our analysis of data arriving at Barrow, the different mech-anisms of PFF contact and FYI contact allow the PFF and FYI contact time series to be very different and allow sep-aration of the sources. It is unclear from the Jones et al. (2006) analysis whether potential frost flower contact and first-year sea-ice contacts are different in their data. There-fore, we cannot speculate on whether their data uniquely point to frost flowers as the source of reactive bromine, but simply note that their data probably could be alternatively interpreted as due to first-year sea-ice contact. In another Antarctic study, Bargagli et al. (2005) found that mercury deposition was enhanced near a coastal polynya, which can be interpreted as indicating that halogen activation was lo-calized to the polynya environment. However, mercury de-position is a very indirect measure of the location of halo-gen activation, and the high mercury levels observed could be caused by enhanced scavenging in the convective polynya environment (Douglas et al., 2005).
We find strong evidence in Bottenheim and Chan (2006) that ozone depleted airmasses arriving at Barrow correlate well with regions of first year ice (FYI). In their paper, they describe “cold spots”, which are source regions, identified by a back-trajectory analysis, of ozone depleted airmasses that are detected at fixed locations (Alert, Barrow, and Spitzber-gen). The Barrow analysis (Fig. 2b of Bottenheim and Chan (2006)) clearly shows that the sea ice north of Barrow is a stronger source than the polynya areas (the coasts of
Rus-sia and Canada, near Banks island), in agreement with our finding that FYI regions appear to be regions where halogen activation (and ozone depletion) occur. Although our work is specifically about airmasses impacting Barrow, we can look to the Bottenheim and Chan (2006) work to examine other regions of the Arctic. In the Alert analysis (Fig. 2a of Bot-tenheim and Chan (2006)), the sea ice near the Canadian side of the North pole is a weaker “cold spot” for ozone deple-tion than the Russian side. This pattern matches the fact that the Russian side has first year ice, while the Canadian side has multi-year ice. The composite picture of ozone depletion shown in Fig. 2d of Bottenheim and Chan (2006) ignores the source of ozone depleted airmasses impacting Barrow, and thus is not a complete picture of ozone depleted airmasses. Of course, trajectory analysis based upon three receptor lo-cations around the Arctic is not fully complete, but we see no reason to discount the Barrow data from Fig. 2d. If the Bar-row data were included, the source region of ozone depleted airmasses for the Arctic would be a good match to the first year ice areas (essentially the Russian and Alaskan sectors, and less in the Canadian sector). Therefore the Bottenheim and Chan (2006) data appears to provide a match between FYI and ozone depletion.
Our study clearly shows that first-year sea ice is correlated with reactive halogen production near Barrow, but we need to consider what specific property of these geographic areas is responsible for the halogen production. Ice motion, even in the middle of the pack, causes cracks to form such that on the order of a percent of the ice area is open water. Given cold temperatures, these open leads freeze over, forming surface brine. Frost flower formation additionally requires supersat-urated water vapor, which depends on the presence of nearby open leads to source the water vapor (Andreas et al., 2002). Because small leads may be difficult to detect by satellite remote sensing, we cannot preclude the possibility that some frost flowers have formed in the first-year ice even though the
626 W. R. Simpson et al.: Sea ice, frost flowers and halogen activation calculated PFF contact is very small for these trajectories. As
brine and frost-flower covered areas age, on the time scale of a few days, they may be covered by snow or the frost flowers could be blown away by wind (Perovich and Richter-Menge, 1994). Therefore, frost flower formation is temporally tran-sient in addition to being spatially limited. The property of frost flowers thought to make up for these limiting factors is their specific surface area (the ice surface area per mass). However, the specific surface area of frost flowers has re-cently been shown to be similar to that of aged snow (Domin´e et al., 2005), making frost flowers appear less likely as the bromine source. Recent reports also indicate that the pH of frost flowers may be too alkaline to support halogen activa-tion (Kalnajs and Avallone, 2006), although precipitaactiva-tion of carbonate minerals could affect the in-situ pH of the frost flowers or aerosol produced from frost flowers (Sander et al., 2006). Overall, frost flowers that may be present in the first-year ice would only provide a saline surface over small areas and for short periods of time.
Snow contaminated by salts is ubiquitous in the FYI area. Snow on sea ice has a wide distribution of depths and large areas are only covered by shallow snow that can be influ-enced by brine wicking from the sea ice surface. Snow on FYI is also shallower (mean depth 20 cm) and less prevalent than snow on MYI (Sturm et al., 2002). Studies from Antarc-tica have shown snow salinities of 5‰ commonly occur at heights up to 20 cm in the snow pack (Massom et al., 2001), and summertime measurements from the Arctic show highly variable snow salinity with an average of 1‰ that may have been reduced by summer brine drainage (Eicken et al., 2002). Wind pumping of air through snow also increases the depth within the snowpack to which sea salts can become atmo-spherically accessible. Frost flowers could produce aerosols that contaminate the snow surface and this snow could later release bromine, leading to correlation with first-year sea-ice but not PFF. From these observations, we find that saline snow and ice on the first-year sea ice is ubiquitous and con-tains significant quantities of salts necessary for halogen ac-tivation. Therefore, the common source of saline snow ap-pears more likely than the transient and spatially limited frost flowers that may have formed but have been undetected by the PFF method.
This work represents an initial investigation into airmass histories and their effects on halogen activation; however much more work needs to be done to extend this work and to understand the mechanistic underpinnings that cause halogen activation. Specific future work that we suggest includes: In-vestigation of whether these observations, which are specific to Barrow – a region seldom impacted by PFF, is general to the Polar Regions. Improving meteorological analysis to in-clude precipitation scavenging and vertical mixing. Improv-ing measurements of the bromide composition of snow and frost flowers on sea ice to better constrain this bromine reser-voir, and study of the mechanism of halogen activation on ices in the laboratory.
5 Conclusions
Potential frost flower contact time, as calculated by meteoro-logical back trajectories and remotely sensed sea ice features is not well correlated to BrO arriving at Barrow, while first-year sea-ice contact is positively correlated to BrO. These data point to first-year sea-ice areas as the major source re-gion for reactive bromine arriving at Barrow during the ozone depletion season with saline snow/ice apparently being the bromine source mechanism, assuming that PFF accurately calculates frost flower contact. The Arctic has recently seen dramatic reductions in sea ice coverage and increases in air temperatures, with most models predicting further ice losses (Johannessen et al., 1999; Overpeck et al., 2005; Serreze et al., 2003; Stroeve et al., 2005). This marked modification of sea ice coverage is likely to have different effects on for-mation of first-year sea ice and frost flowers. For example, a warmer Arctic with less summer sea ice might have less frost flowers in spring due to warmer temperatures but more saline snow on first-year sea ice. A better mechanistic understand-ing of the relative global importance of these two possible reactive bromine sources is critical for meaningful prediction of future halogen activation, boundary-layer ozone depletion, and mercury deposition in the context of a rapidly changing Arctic.
Acknowledgements. This work was supported by the National
Science Foundation, under grants OPP-0435922 (WRS, DC, and GH) and OPP-0435989 (TAD, MS, and DP). Logistical support from the Barrow Arctic Science Consortium is gratefully acknowl-edged. We also thank U. Frieß for the suggestion to try correlation of BrO with first-year sea-ice contact. We thank NOAA for pro-viding the ozone measurements and the HYSPLIT trajectory model. Edited by: R. Sander
References
Andreas, E. L., Guest, P. S., Persson, P. O. G., Fairall, C. W., Horst, T. W., Moritz, R. E., and Semmer, S. R.: Near-surface water vapor over polar sea ice is always near ice saturation, J. Geophys. Res., 107, SHE 8–1, 2002.
Bargagli, R., Agnorelli, C., Borghini, F., and Monaci, F.: Enhanced deposition and bioaccumulation of mercury in Antarctic terres-trial ecosystems facing a coastal polynya, Env. Sci. and Techn., 39, 8150-8155, doi:10.1021/es0507315, 2005
Barrie, L. A., Bottenheim, J. W., Schnell, R. C., Crutzen, P. J., and Rasmussen, R. A.: Ozone destruction and photochemical reac-tions at polar sunrise in the lower Arctic atmosphere, Nature, 334, 138–141, 1988.
Bottenheim, J. W., and Chan, E.: A trajectory study into the origin of spring time Arctic boundary layer ozone depletion, J. Geo-phys. Res., 111, D19301, doi: 10.1029/2006JD007055, 2006. Domin´e, F., Sparapani, R., Ianniello, A., and Beine, H. J.: The
ori-gin of sea salt in snow on Arctic sea ice and in coastal regions, Atmos. Chem. Phys., 4, 2259–2271, 2004,
http://www.atmos-chem-phys.net/4/2259/2004/.
Domin´e, F., Taillandier, A. S., Simpson, W. R., and Severin, K.: Specific surface area, density and microstructure of frost flowers, Geophys. Res. Lett., 32, L13502, doi:10.1029/2005GL023245, 2005.
Douglas, T. A., Sturm, M., Simpson, W. R., Brooks, S., Lindberg, S., and Perovich, D.: Elevated mercury measured in snow and frost flowers near Arctic sea ice leads, Geophys. Res. Lett., 32, L04502, doi: 10.1029/2004GL022132, 2005.
Draxler, R. and Rolph, G.: HYSPLIT (HYbrid
Single-Particle Lagrangian Integrated Trajectory) Model
access via NOAA ARL READY Website,
url-http://www.arl.noaa.gov/ready/hysplit4.html, 2003.
Eicken, H., Krouse, H. R., Kadko, D., and Perovich, D. K.: Tracer studies of pathways and rates of meltwater transport through Arctic summer sea ice, J. Geophys. Res., 107, 8046, doi:10.1029/2000JC000583, 2002.
Fan, S.-M. and Jacob, D. J.: Surface ozone depletion in Arctic spring sustained by bromine reactions on aerosols, Nature, 359, 522–524, 1992.
Foster, K. L., Plastridge, R. A., Bottenheim, J. W., Shepson, P. B.,
Finlayson-Pitts, B. J., and Spicer, C. W.: The Role of Br2and
BrCl in Surface Ozone Destruction at Polar Sunrise, Science, 291, 471–474, 2001.
Frieß, U., Hollwedel, J., K¨onig-Langlo, G., Wagner, T., and Platt, U.: Dynamics and chemistry of tropospheric bromine explosion events in the Antarctic coastal region, J. Geophys. Res., 109, D06305, doi:10.1029/2003JD004133, 2004.
Hausmann, M. and Platt, U.: Spectroscopic measurement of
bromine oxide and ozone in the high Arctic during Polar Sunrise Experiment 1992, J. Geophys. Res., 99, 25 399–25 413, 1994. H¨onninger, G. and Platt, U.: Observations of BrO and its vertical
distribution during surface ozone depletion at Alert, Atmos. Env., 36, 2481–2490, 2002.
Johannessen, O. M., Shalina, E. V., and Miles, M. W.: Satellite Evidence for an Arctic Sea Ice Cover in Transformation, Science, 286, 1937, doi:10.1126/science.286.5446.1937, 1999.
Jones, A. E., Anderson, P. S., Wolff, E. W., Turner, J., Rankin, A. M., and Colwell, S. R.: A role for newly forming sea ice in springtime polar tropospheric ozone loss? Observational ev-idence from Halley Station, Antarctica, J. Geophys. Res., 111, D08306, doi:10.1029/2005JD006566, 2006.
Kaleschke, L., L¨upkes, C., Vihma, T., Haarpaintner, J., Bochert, A., Hartmann, J., and Heygster, G.: SSM/I Sea Ice Remote Sensing for Mesoscale Ocean-Atmosphere Interaction Analysis, Can. J. Rem. Sens., 27, 526–537, 2001.
Kaleschke, L., Richter, A., Burrows, J., Afe, O., Heygster, G., Nothold, J., Rankin, A. M., Roscoe, H. K., Hollowedel, J., Wag-ner, T., and Jacobi, H.-W.: Frost flowers on sea ice as a source of sea salt and their influence on tropophspheric halogen chemistry, Geophys. Res. Lett., 31, L16114, doi:10.1029/2004GL020655, 2004.
Kalnajs, L. E. and Avallone, L. M.: Frost flower influence
on springtime boundary-layer ozone depletion events and at-mospheric bromine levels, Geophys. Res. Lett., 33, L10810, doi:10.1029/2006GL025809, 2006.
Kwok, R.: Annual cycles of mulityear sea ice coverage of the Arctic Ocean: 1999–2003, J. Geophys. Res., 109, C11004, doi:10.1029/2004JC002238, 2004.
Massom, R. A., Eicken, H., Haas, C., Jeffries, M. O., Drinkwater,
M. R., Sturm, M., Worby, A. P., Wu, X., Lytle, V. I., Ushio, S., Morris, K., Reid, P. A., Warren, S. G., and Allison, I.: Snow on Antarctic sea ice, Rev. Geophys., 39, 413–445, 2001.
McConnell, J. C., Henderson, G. S., Barrie, L., Bottenheim, J., Niki, H., Langford, C. H., and Templeton, E. M. J.: Photochemical bromine production implicated in Arctic boundary-layer ozone depletion, Nature, 355, 150–152, 1992.
Overpeck, J. T., Sturm, M., Francis, J. A., Perovich, D. K., Ser-reze, M. C., Benner, R., Carmack, E. C., III, S. C., Gerlach, S. C., Hamilton, L. C., Hinzman, L. D., Holland, M., Huntington, H. P., Key, J. R., Lloyd, A. H., MacDonald, G. M., McFadden, J., Noone, D., Prowse, T. D., Schlosser, P., and V¨or¨osmarty, C.: Arctic System on Trajectory to New, Seasonally Ice-Free State, Eos Trans. AGU, 86, 309, 2005.
Perovich, D. and Richter-Menge, J. A.: Surface characteristics of lead ice, J. Geophys. Res., 99, 16 341–16 350, 1994.
Rankin, A. M., Wolff, E. W., and Martin, S.: Frost flowers: Impli-cations for tropospheric chemistry and ice core interpretation, J. Geophys. Res., 107, 4683–4694, 2002.
Sander, R., Burrows, J. and Kaleschke, L.: Carbonate precipita-tion in brine - a potential trigger for tropospheric ozone depleprecipita-tion events, Atmos. Chem. Phys., 6, 4653-4658, 2006,
http://www.atmos-chem-phys.net/6/4653/2006/.
Schroeder, W. H., Anlauf, K. G., Barrie, L. A., Lu, J. Y., Steffen, A., Schneeberger, D. R., and Berg, T.: Arctic springtime depletion of mercury, Nature, 394, 331–332, 1998.
Serreze, M. C., Maslanik, J. A., Scambos, T. A., Fetterer, F., Stroeve, J., Knowles, K., Fowler, C., Drobot, S., Barry,
R. G., and Haran, T. M.: A record minimum arctic sea
ice extent and area in 2002, Geophys. Res. Lett., 30, 1110, doi:10.1029/2002GL016406, 2003.
Simpson, W. R., Alvarez-Aviles, L., Douglas, T. A., Sturm,
M., and Domin´e, F.: Halogens in the coastal snow pack
near Barrow, Alaska: Evidence for active bromine air-snow chemistry during springtime, Geophys. Res. Lett., 32, L04811, doi:10.1029/2004GL021748, 2005.
Stroeve, J. C., Serreze, M. C., Fetterer, F., Arbetter, T., Meier, W., Maslanik, J., and Knowles, K.: Tracking the Arctic’s shrinking ice cover: Another extreme September minimum in 2004, Geo-phys. Res. Lett., 32, L04501, doi:10.1029/2004GL021810, 2005. Sturm, M., Holmgren, J., and Perovich, D. K.: The winter snow cover of the sea ice of the Arctic Ocean at SHEBA: Temporal evolution and spatial variability., J. Geophys. Res., 107, 8047, doi:10.1029/2000JC000400, 2002.
Tuckermann, M., Ackermann, R., Golz, C., Lorenzen-Schmidt, H., Senne, T., Stutz, J., Trost, B., Unold, W., and Platt, U.: DOAS-observation of halogen radical-catalysed arctic boundary layer ozone destruction during the ARCTOC campaigns 1995 and
1996 in Ny- ˚Alesund, Spitsbergen, Tellus, 49B, 533–555, 1997.
Wagner, T., Leue, C., Wenig, M., Pfeilsticker, K., and Platt, U.: Spatial and temporal distribution of enhanced boundary layer BrO concentrations measured by the GOME instruments aboard ERS-2, J. Geophys. Res., 106, 24 225–24 235, 2001.