HAL Id: hal-00295283
https://hal.archives-ouvertes.fr/hal-00295283
Submitted on 23 Jun 2003
HAL is a multi-disciplinary open access
archive for the deposit and dissemination of
sci-entific research documents, whether they are
pub-lished or not. The documents may come from
teaching and research institutions in France or
abroad, or from public or private research centers.
L’archive ouverte pluridisciplinaire HAL, est
destinée au dépôt et à la diffusion de documents
scientifiques de niveau recherche, publiés ou non,
émanant des établissements d’enseignement et de
recherche français ou étrangers, des laboratoires
publics ou privés.
Dynamics and chemistry of vortex remnants in late
Arctic spring 1997 and 2000: Simulations with the
Chemical Lagrangian Model of the Stratosphere
(CLaMS)
P. Konopka, J.-U. Grooß, S. Bausch, R. Müller, D. S. Mckenna, O.
Morgenstern, Y. Orsolini
To cite this version:
P. Konopka, J.-U. Grooß, S. Bausch, R. Müller, D. S. Mckenna, et al.. Dynamics and chemistry
of vortex remnants in late Arctic spring 1997 and 2000: Simulations with the Chemical Lagrangian
Model of the Stratosphere (CLaMS). Atmospheric Chemistry and Physics, European Geosciences
Union, 2003, 3 (3), pp.839-849. �hal-00295283�
Atmos. Chem. Phys., 3, 839–849, 2003
www.atmos-chem-phys.org/acp/3/839/
Atmospheric
Chemistry
and Physics
Dynamics and chemistry of vortex remnants in late Arctic spring
1997 and 2000: Simulations with the Chemical Lagrangian Model of
the Stratosphere (CLaMS)
P. Konopka1, J.-U. Grooß1, S. Bausch1, R. M ¨uller1, D. S. McKenna2, O. Morgenstern3, and Y. Orsolini4
1Institute for Stratospheric Chemistry (ICG-I), 52425 J¨ulich, Germany 2National Center for Atmospheric Research, Boulder, CO, USA 3Max-Planck-Institut f¨ur Meteorologie, Hamburg, Germany 4Norwegian Institute for Air Research (NILU), Kjeller, Norway
Received: 30 December 2002 – Published in Atmos. Chem. Phys. Discuss.: 25 February 2003 Revised: 4 June 2003 – Accepted: 16 June 2003 – Published: 23 June 2003
Abstract. High-resolution simulations of the chemical
com-position of the Arctic stratosphere during late spring 1997 and 2000 were performed with the Chemical Lagrangian Model of the Stratosphere (CLaMS). The simulations were performed for the entire northern hemisphere on two isen-tropic levels 450 K (≈18 km) and 585 K (≈24 km).
The spatial distribution and the lifetime of the vortex rem-nants formed after the vortex breakup in May 1997 display different behavior above and below 20 km. Above 20 km, vortex remnants propagate southward (up to 40◦N) and are “frozen in” in the summer circulation without significant mixing. Below 20 km the southward propagation of the rem-nants is bounded by the subtropical jet. Their lifetime is shorter by a factor of 2 than that above 20 km, owing to sig-nificant stirring below this altitude. The behavior of vortex remnants formed in March 2000 is similar but, due to an ear-lier vortex breakup, dominated during the first 6 weeks after the vortex breakup by westerly winds, even above 20 km.
Vortex remnants formed in May 1997 are characterized by large mixing ratios of HCl indicating negligible, halogen-induced ozone loss. In contrast, mid-latitude ozone loss in late boreal spring 2000 is dominated, until mid-April, by halogen-induced ozone destruction within the vortex rem-nants, and subsequent transport of the ozone-depleted polar air masses (dilution) into the mid-latitudes. By varying the intensity of mixing in CLaMS, the impact of mixing on the formation of ClONO2 and ozone depletion is investigated. We find that the photochemical decomposition of HNO3and not mixing with NOx-rich mid-latitude air is the main source of NOxwithin the vortex remnants in March and April 2000. Ozone depletion in the remnants is driven by ClOx photolyt-ically formed from ClONO2. At the end of May 1997, the halogen-induced ozone deficit at 450 K poleward of 30◦N Correspondence to: P. Konopka
(p.konopka@fz-juelich.de)
amounts to ≈12% with ≈10% in the polar vortex and ≈2% in well-isolated vortex remnants after the vortex breakup.
1 Introduction
Long-term ground-based measurements over Europe show that the total column of ozone began to decline in the 1970s. The decrease was greatest in the winter/spring period, with the ozone decline trend in the late 1990s being around 3– 6%/decade. The main contribution is located in the 12–20 km altitude range (WMO, 1998).
One of the widely discussed mechanisms contributing to this trend is the ozone depletion in the Arctic vortex and its impact on the mid-latitudes. During winter and spring, chlorine in the polar vortex is activated on the surface of po-lar stratospheric clouds and causes severe ozone destruction (WMO, 1998). Knudsen and Grooß (2000) estimated from calculations done for 1995 and 1997 that approximately 40% of the observed TOMS total ozone trends result from trans-port of the ozone-depleted vortex air into the mid-latitudes. By applying this method north of 63◦ for the period 1992– 2000, Andersen and Knudsen (2002) deduced that the major part (75%) of the observed Arctic ozone decrease in March and most of the variability may be explained by winter/spring ozone depletion in the polar vortex. On the other hand, using 3-D CTM studies Chipperfield and Jones (1999) showed that during the 1990s the dynamic variations dominated the inter-annual variability of ozone north of 63◦with little evidence of a trend towards more wintertime chemical depletion.
The first studies considering the details of the transport of the vortex air into the mid-latitudes were based on LIMS data (LIMS – Limb Infrared Monitor of the Stratosphere) and GCM simulations. Hess (1991) found that long-lived anomalies of tracers were still observed two months after
c
840 Konopka et al.: Dynamics and chemistry of vortex remnants the breakup of the polar vortex in spring 1979. Using the
PDF technique for 3-D simulations of N2O, Orsolini (2001) identified some long-lived westward-propagating tracer pat-terns in the 1998 summer polar stratosphere above 20 km that resulted from the slow advection of coarsely-mixed vortex remnants. Based on 3-D CTM simulations with a parameter-ized ozone chemistry, Piani et al. (2002) showed that by the end of June, 2000, above 420 K, much of the ozone-depleted air was transported from the polar regions to the subtropics, whereas below 420 K, these air masses remained polarward of ≈55◦N. They suggested that below 420 K the subtropical jet provides an effective transport barrier while stirring after the breakup of the polar vortex is important at upper levels.
Despite these achievements, questions concerning the life-time, the spatial distribution, and the year-to-year variability of such remnants are still open. Also their impact on the total ozone column, in particular over the densely populated re-gions in northern mid-latitudes, needs to be quantified. Fur-thermore, only few studies exist that discuss the effect of stir-ring and mixing on the ozone chemistry in the slowly diluting vortex remnants (Marchand et al., 2003).
Inaccurate representation of mixing in photochemical transport models may influence the predictions of strato-spheric ozone depletion (Edouard et al., 1996; Searle et al., 1998a,b). Satellite observations (Riese et al., 1999), in situ measurements (Tuck, 1989), and dynamical model studies based on such experiments (e.g. Plumb et al., 1994; Waugh et al., 1997; Orsolini et al., 1997; Balluch and Haynes, 1997) demonstrated the existence of filamentary structures on a broad range of spatial scales in stratospheric chemical tracer fields. Chemical transport models that do not resolve fil-amentary structures and do not represent their dissipation times realistically will not simulate non-linear chemical reac-tions accurately. Using a photochemical box model to study the impact of mixing on the deactivation of stratospheric chlorine, Tan et al. (1998) showed that both box models with-out mixing and the currently employed grid-based numerical models can, in certain circumstances, significantly over- and underestimate the observed ozone loss rates. Furthermore, based on idealized isentropic simulations, they concluded that a spatial resolution better than 40 km is necessary to ob-tain a correct description of ozone loss that is not sensitive to the numerical diffusivity of the model.
To study the impact of transport on the spatial distribution, the lifetime, and the ozone chemistry in the vortex remnants in spring/summer 1997 and 2000, we use the high-resolution, isentropic (2-D) version of the Chemical Lagrangian Model of the Stratosphere (CLaMS) (McKenna et al., 2002,a). We chose these two periods because of their completely different characteristics with respect to the lifetime of the Arctic polar vortex: Whereas the vortex in 1997 was extremely long-lived with the final breakup around mid-May (Coy et al., 1997), the vortex decay in mid-March 2000 is more typical for the final warmings observed in the last twenty years (Manney and Sabutis, 2000).
The Lagrangian view of transport allows mixing to be de-scribed in its own way. Mixing in CLaMS is induced by an adaptive regridding of the (isentropic) air parcels (APs) with mean distance to the next neighbors given by r0(model reso-lution). The regridding procedure is applied after each advec-tion time step 1t (6–24 hours) that is conducted in terms of isentropic (2-D) trajectories. The mixing intensity is driven by the horizontal deformations in the flow measured by the finite time Lyapunov exponent λ. Significant mixing occurs only in flow regions where λ exceeds a prescribed critical value λc. In contrast, in the Eulerian approach the numerical diffusion is present always and everywhere due to the high frequency of interpolations of fluid elements on the fixed spa-tial grid (Courant criterion), the contribution of the CLaMS regridding procedure to the transport can be contolled. It can be continuously reduced (e.g. by increasing the critical Lya-punov exponent λc) until tracers are solely transported along trajectories without any mass exchange between the APs. We call this (reversible) part of transport pure advection. The re-gridding procedure is controlled by the critical Lyapunov ex-ponent λc, the model resolution r0, and the length of the ad-vection time step 1t (or the grid adaptation frequency 1/1t). These parameters define the (irreversible) part of transport, i.e. mixing.
The paper is organized as follows. In Sect. 2 we describe the model configuration and justify the isentropic approx-imation by comparing the CLaMS CH4 distributions with HALOE observations. Section 3 discusses the spatial dis-tribution and the lifetime of the vortex remnants observed in spring and summer 1997 and 2000. In Sect. 4, the ozone chemistry occurring in these remnants is considered. The impact of mixing on the chlorine deactivation and the ozone loss is discussed in Sect. 5. Finally, conclusions are drawn in Sect. 6.
2 Simulations with CLaMS
Isentropic CLaMS studies are carried out for two periods: 10.04–31.07 1997 and 10.2-01.06 2000, at the two isentropic levels 450 and 585 K. The meteorological fields are taken from ECMWF data. As a reference case, we employ a (quasi-uniform) distribution of APs over the northern hemisphere with the distance between the neighboring APs r0 =65 km and r0 = 200 km north- and southward of 30◦N, respec-tively. The critical Lyapunov exponent λc and the time step 1t are set to 1.2 day−1 and 24 hours, respectively. In the following, we call this configuration of mixing parameters adjusted or optimal mixing. The optimal mixing leads to the best agreement between the CLaMS simulations and the in situ aircraft measurements of tracers observed at the edge of the northern polar vortex during the SOLVE/THESEO-2000 campaign (Konopka et al., 2003). The combinations of the mixing parameters can be quantified by the so-called effec-tive diffusivity (perpendicular to the wind direction) given as
Konopka et al.: Dynamics and chemistry of vortex remnants 841 D ≈ r02/(41t ) exp(−2λc1t )(McKenna et al. (2002) use the
notation D−c for the effective diffusivity D discussed here). For the optimal mixing D amounts to 1.1 103m2s−1 north-ward of 30◦N.
In addition, to study the influence of mixing on chem-istry, we consider distributions of APs with spatial resolu-tions r0 = 100, 200 and 400 km northward of 30◦N. The strongest impact on mixing can be achieved by varying the spatial resolution due to the quadratic dependence of the ef-fective diffusivity on r0. Thus, the corresponding effective diffusivities are 2.6 103, 1.1 105 and 4.2 105m2s−1. The CLaMS transport scheme resolves horizontal structures up to the order of r0exp(−λc1t ), i.e. for r0 =65 km the smallest resolved scales are approximately 20 km.
The initial distribution of all chemical species on 10.04.1997 is derived from MLS and HALOE observations using trajectory mapping, tracer/tracer and tracer/equivalent latitude correlations. In addition, ER-2, POAM and TRIPLE observations are taken into account for the initialization at 10.02.2000. The remaining species are initialized from a 2-D model climatology. The denitrification in 1997 is derived from the MLS data, whereas a one-month temperature his-tory is used to parameterize the sedimentation of NAT and ice particles and the subsequent effect of HNO3and H2O re-moval (Grooß et al., 2002; Konopka et al., 2003).
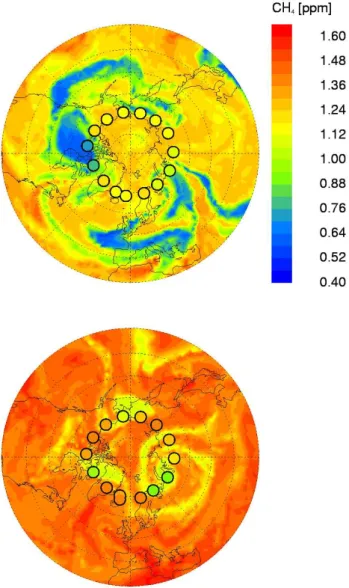
In Fig. 1 the isentropic CLaMS distributions of CH4at 450 and 585 K about 12 days after the vortex breakup in 1997 are shown. For comparison HALOE observations are over-laid (circles). Vortex remnants at 450 K are more strongly bounded around the pole and are mixed more intensively than the remnants at 585 K.
Before we quantify these properties more precisely, some remarks on the validity of the isentropic calculations are nec-essary. The isentropic approximation is motivated by weak diabatic descent of the vortex air at both levels between mid-February and the end of May. Diabatic descent rates derived from the radiation module (Zhong and Haigh, 1995) based on the Morcrette scheme (Morcrette, 1991) show that during the period under consideration, the vortex air masses do not sig-nificantly change their potential temperatures in the θ -range between 400 and 600 K (1θ < 30 K).
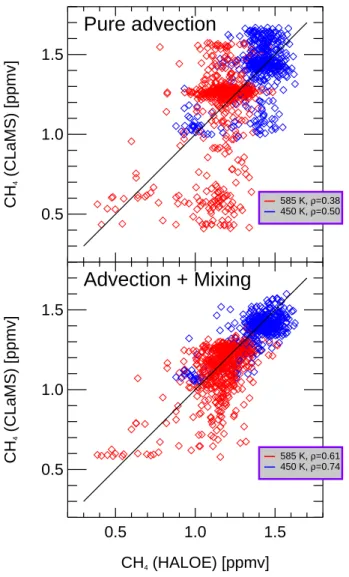
Aditionally, we verify the quality of the CLaMS transport by comparing the simulated distributions of CH4 with the HALOE observations. Figure 2 shows the results of such comparison for two CLaMS configurations: without mix-ing (i.e. transport only in terms of forward trajectories) and with the optimal mixing. The correlation coefficient ρ be-tween the observed and simulated mixing ratios (see legend in Fig. 2) show that the CLaMS simulation with optimal mix-ing reproduces fairly well the CH4 distributions observed by HALOE in spring and summer 1997 northward of 30◦N. Fur-thermore, the CLaMS mixing scheme smoothes out some of the very low CH4 mixing ratios present in the pure advec-tion transport that are not observed by HALOE (in
partic-Konopka et al.: Dynamics and chemistry of vortex remnants
3
In addition, to study the influence of mixing on
chem-istry, we consider distributions of APs with spatial
resolu-tions
r
0= 100, 200 and 400 km northward of 30
0N. The
strongest impact on mixing can be achieved by varying the
spatial resolution due to the quadratic dependence of the
ef-fective diffusivity on
r
0. Thus, the corresponding effective
diffusivities are 2.6 10
3, 1.1 10
5and 4.2 10
5m
2s
−1. The
CLaMS transport scheme resolves horizontal structures up to
the order of
r
0exp(−λ
c∆t), i.e. for r
0=65 km the smallest
resolved scales are approximately 20 km.
The initial distribution of all chemical species at
10.04.1997 is derived from MLS and HALOE observations
using trajectory mapping, tracer/tracer and tracer/equivalent
latitude correlations. In addition, ER-2, POAM and TRIPLE
observations are taken into account for the initialization at
10.02.2000. The remaining species are initialized from a 2D
model climatology. The denitrification in 1997 is derived
from the MLS data, whereas a one month temperature
his-tory is used to parameterize the sedimentation of NAT and
ice particles and the subsequent effect of HNO
3and H
2O
removal (Grooß et al., 2002; Konopka et al., 2003).
In Fig. 1 the isentropic CLaMS distributions of CH
4at
450 and 585 K about 12 days after the vortex breakup in
1997 are shown. For comparison HALOE observations are
overlayed (circles). Vortex remnants at 450 K are stronger
bounded around the pole and are mixed more intensively than
the remnants at 585 K.
Before we quantify these properties more precisely, some
remarks on the validity of the isentropic calculations are
nec-essary. The isentropic approximation is motivated by weak
diabatic descent of the vortex air at both levels between
mid-February and the end of Mai. Diabatic descent rates derived
from the radiation module (Zhong and Haigh, 1995) based
on the Morcrette scheme (Morcrette, 1991) show that during
the considered period, the vortex air masses does not
sig-nificantly change their potential temperatures in the
θ-range
between 400 and 600 K (
∆θ < 30 K).
Aditionally, we verify the quality of the CLaMS
trans-port by comparing the simulated distributions of CH
4with
the HALOE observations. Fig 2 shows the results of such
comparison for two CLaMS configurations: without
mix-ing (i.e. transport only in terms of forward trajectories) and
with the optimal mixing. The correlation coefficient
ρ
be-tween the observed and simulated mixing ratios (see legend
in Fig 2) show that the CLaMS simulation with optimal
mix-ing reproduces fairly well the CH
4-distributions observed by
HALOE in spring and summer 1997 northward of 30
0N.
Fur-thermore, the CLaMS mixing scheme smoothes out some of
the very low CH
4mixing ratios present in the pure
advec-tion transport that are not observed by HALOE (in
partic-ular at 585 K). Consequently, the correlation coefficient
ρ
between the HALOE observations and CLaMS simulations
increases from 0.5 to 0.74 and from 0.38 to 0.64 for
θ = 450
and 585 K, respectively. The deviations still present at 585 K
are mainly caused by the errors of the simulated absolute
po-Fig. 1. CH4 simulated with CLaMS at θ = 585 K (top) and
450 K (bottom) at 22.05.1997, i.e. about 12 days after the vor-tex breakup. The circles denote the HALOE observations (tangent points) mapped to the same synoptic time.
sition of the vortex remnants. This indicates that the quality
of the ECMWF winds is better at 450 than at 585 K.
Thus, using 3d-trajectory calculations and by comparing
CLaMS CH
4-distributions with the HALOE observations,
we conclude that isentropic transport dominated the
propa-gation of the vortex air into the mid-latitudes several weeks
before and after breakup of the vortex in 1997 and 2000.
3
Spatial distribution and lifetime of vortex remnants
in 1997 and 2000
In 1997, the polar vortex was unusually long lived (Coy et al.,
1997). Even at the end of April, the vortex was very
symmet-ric around the pole and stable, and it did not break up until
mid May. On the other hand, the breakup of the vortex in
2000 was around mid March, i.e. during a time period typical
www.atmos-chem-phys.org/0000/0001/
Atmos. Chem. Phys., 0000, 0001–12, 2003
Fig. 1. CH4 simulated with CLaMS at θ = 585 K (top) and 450 K (bottom) at 22.05.1997, i.e. about 12 days after the vor-tex breakup. The circles denote the HALOE observations (tangent points) mapped to the same synoptic time.
ular at 585 K). Consequently, the correlation coefficient ρ between the HALOE observations and CLaMS simulations increases from 0.5 to 0.74 and from 0.38 to 0.64 for θ = 450 and 585 K, respectively. The deviations still present at 585 K are mainly caused by the errors of the simulated absolute po-sition of the vortex remnants. This indicates that the quality of the ECMWF winds is better at 450 than at 585 K.
Thus, using 3-D trajectory calculations and by comparing CLaMS CH4 distributions with the HALOE observations, we conclude that isentropic transport dominated the propa-gation of the vortex air into the mid-latitudes several weeks before and after breakup of the vortex in 1997 and 2000.
842 Konopka et al.: Dynamics and chemistry of vortex remnants
4
Konopka et al.: Dynamics and chemistry of vortex remnants
0.5 1.0 1.5 CH 4 (CLaMS) [ppmv]
Pure advection
585 K, ρ=0.38 450 K, ρ=0.50 585 K, ρ=0.38 450 K, ρ=0.50 0.5 1.0 1.5 CH4 (HALOE) [ppmv] 0.5 1.0 1.5 CH 4 (CLaMS) [ppmv]Advection + Mixing
585 K, ρ=0.61 450 K, ρ=0.74 585 K, ρ=0.61 450 K, ρ=0.74Fig. 2.
CLaMS transport of CH
4versus HALOE observations
northward of 30
0N between April, 10 and June 31 1997 at θ = 450
and θ = 585 K without mixing (upper panel) and with optimal
mixing (lower panel).
for the onset of the final warming in the northern hemisphere
(Manney and Sabutis, 2000).
The zonal distribution of the vortex remnants after the
vor-tex breakup is mainly determined by the isentropic winds. In
Fig. 3 the zonal mean winds at 450 and 585 K are shown for
both considered periods. Owing to the long vortex lifetime
in 1997, the vortex breakup at 585 K is accompanied by a
transition from the winter to the summer circulation with no
influence of the subtropical jet. On the other hand, the
trans-port of vortex remnants at 450 K, is driven by westerly winds
and influenced by the subtropical jet. The zonally averaged
winds in 2000 show a similar structure although a strong
sub-tropical jet is present even in the upper level and the summer
circulation is still not fully developed owing to the earlier
breakup time.
By performing the CLaMS simulations, we investigate
now the meridional distribution of the vortex air and the
in-fluence of mixing (i.e. of the irreversible part of transport)
on a such distribution. CLaMS results for the zonally
aver-aged meridional distribution of the vortex air after the vortex
breakup in 1997 are shown in Fig. 4. Results at 450 K (left)
and 585 K (right) are plotted for tracer transport without
mix-ing (top) and with an excessive mixmix-ing (bottom)
correspond-ing to the mean distance between neighborcorrespond-ing APs
r
0= 200
km. In the model, vortex air is defined as air masses bounded
at the beginning of the simulation by the vortex edge
identi-fied by the strongest PV gradient with respect to equivalent
latitude (Nash et al., 1996). To mark vortex air, an additional,
artificial tracer is used and initialized as 1 and 0 within and
outside of the vortex, respectively. The subsequent transport
(advection + mixing) of this tracer describes the zonal
distri-bution of the vortex air.
The comparison between top and bottom panels of Fig. 4
shows a negligible influence of mixing on the zonal
distri-bution of the vortex air. Even for CLaMS simulations
with-out mixing, the zonal averaging of the (unmixed) air parcels
leads to a similar meridional distribution of the vortex air as
in the case where mixing was exaggerated. Thus, the large
scale meridional transport of vortex air into the mid-latitudes
is dominated by the chaotic advection (induced e.g. by
plan-etary waves) rather than by mixing. The zonally averaged
tracks of vortex remnants (black lines in Figs. 4 and 3) show
at 585 K a stronger southward propagation than at 450 K. In
agreement with the investigations of Piani et al. (2002), this
propagation at 450 K is confined by the subtropical jet to
lat-itudes poleward of 55
◦N. The southward transport of vortex
air at 585 K is more effective and reaches about 40
◦N.
However, mixing may significantly influence the lifetime
of vortex remnants, i.e., the time that is necessary to
homoge-neously mix vortex air with ambient air. The temporally and
spatially inhomogeneous CLaMS mixing is driven by
inte-gral flow deformation that can be quantified in terms of the
finite-time Lyapunov exponent
λ . Thus, CLaMS produces
high mixing intensity only in flow regions with sufficiently
high values of
λ. Fig. 5 shows the zonally averaged
Lya-punov exponents
λ calculated for each CLaMS AP over a
time step
∆t = 12 hours. After the vortex breakup, the
sum-mer circulation at 585 K is characterized by very low values
of
λ. Generally, the summer circulation in the middle
strato-sphere can be understood as a “solid body rotation” with a
negligible amount of local strain between the neighboring
APs (Piani and Norton, 2002). Consequently, the regridding
algorithm in CLaMS that is driven by the local deformation
rates, indicates very weak mixing at this level that is in
agree-ment with the diagnostic of atmospheric transport in terms of
the effective diffusivity ite[]Haynes2000a.
To quantify the effect of mixing on the lifetime of
vor-tex remnants the PDFs (probability density function)
calcu-lated for CLaMS CH4
distributions are shown in Fig. 6. The
PDF is proportional to the area occupied by tracer values in
a given range of mixing ratios (for details see e.g. Sparling,
2000). Here, the black lines denote the vortex edge
trans-formed from the PV to CH4
-field. Thus, the PDF of the
CH
4-values below these lines describe the contribution of
vortex air to all air masses poleward of 30
◦N. The results
Atmos. Chem. Phys., 0000, 0001–12, 2003
www.atmos-chem-phys.org/0000/0001/
Fig. 2. CLaMS transport of CH4 versus HALOE observations northward of 30◦N between 10 April and 31 June 1997 at θ = 450 and θ = 585 K without mixing (upper panel) and with optimal mix-ing (lower panel).
3 Spatial distribution and lifetime of vortex remnants in 1997 and 2000
In 1997, the polar vortex was unusually long-lived (Coy et al., 1997). Even at the end of April, the vortex was very symmetrical around the pole and stable, and it did not break up until mid-May. On the other hand, the breakup of the vortex in 2000 was around mid-March, i.e. during a time pe-riod typical for the onset of the final warming in the northern hemisphere (Manney and Sabutis, 2000).
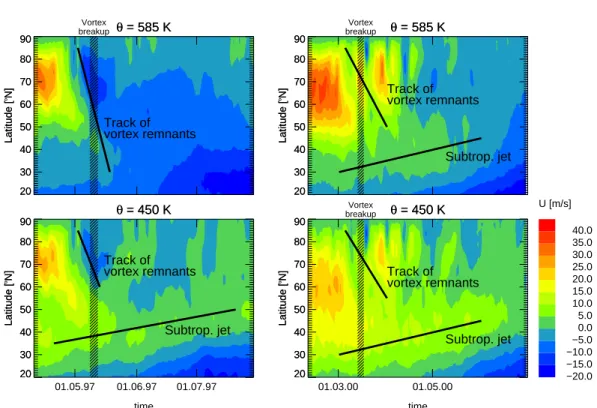
The zonal distribution of the vortex remnants after the vor-tex breakup is mainly determined by the isentropic winds. In Fig. 3 the zonal mean winds at 450 and 585 K are shown for both periods considered. Owing to the long vortex lifetime in 1997, the vortex breakup at 585 K is accompanied by a transition from the winter to the summer circulation with no
influence of the subtropical jet. On the other hand, the trans-port of vortex remnants at 450 K is driven by westerly winds and influenced by the subtropical jet. The zonally averaged winds in 2000 show a similar structure although a strong sub-tropical jet is present even in the upper level and the summer circulation is still not fully developed owing to the earlier breakup time.
By performing the CLaMS simulations, we now investi-gate the meridional distribution of the vortex air and the in-fluence of mixing (i.e. of the irreversible part of transport) on such a distribution. CLaMS results for the zonally aver-aged meridional distribution of the vortex air after the vortex breakup in 1997 are shown in Fig. 4. Results at 450 K (left) and 585 K (right) are plotted for tracer transport without mix-ing (top) and with excessive mixmix-ing (bottom) correspondmix-ing to the mean distance between neighboring APs r0=200 km. In the model, vortex air is defined as air masses bounded at the beginning of the simulation by the vortex edge identified by the strongest PV gradient with respect to equivalent lati-tude (Nash et al., 1996). To mark vortex air, an additional, artificial tracer is used and initialized as 1 and 0 within and outside of the vortex, respectively. The subsequent transport (advection + mixing) of this tracer describes the zonal distri-bution of the vortex air.
The comparison between top and bottom panels of Fig. 4 shows a negligible influence of mixing on the zonal distri-bution of the vortex air. Even for CLaMS simulations with-out mixing, the zonal averaging of the (unmixed) air parcels leads to a similar meridional distribution of the vortex air as in the case where mixing was exaggerated. Thus, the large-scale meridional transport of vortex air into the mid-latitudes is dominated by the chaotic advection (induced e.g. by plan-etary waves) rather than by mixing. The zonally averaged tracks of vortex remnants (black lines in Figs. 4 and 3) show a stronger southward propagation at 585 K than at 450 K. In agreement with the investigations of Piani et al. (2002), this propagation at 450 K is confined by the subtropical jet to lat-itudes poleward of 55◦N. The southward transport of vortex air at 585 K is more effective and reaches about 40◦N.
However, mixing may significantly influence the lifetime of vortex remnants, i.e., the time that is necessary to homoge-neously mix vortex air with ambient air. The temporally and spatially inhomogeneous CLaMS mixing is driven by inte-gral flow deformation that can be quantified in terms of the finite-time Lyapunov exponent λ.
Thus, CLaMS produces high mixing intensity only in flow regions with sufficiently high values of λ. Figure 5 shows the zonally averaged Lyapunov exponents λ calculated for each CLaMS AP over a time step 1t = 12 hours. After the vortex breakup, the summer circulation at 585 K is char-acterized by very low values of λ. Generally, the summer circulation in the middle stratosphere can be understood as a “solid body rotation” with a negligible amount of local strain between the neighboring APs (Piani and Norton, 2002). Con-sequently, the regridding algorithm in CLaMS that is driven
Konopka et al.: Dynamics and chemistry of vortex remnantsKonopka et al.: Dynamics and chemistry of vortex remnants 5 843 1997 20 30 40 50 60 70 80 90 Latitude [ oN] θ = 585 K θ = 585 K 20 30 40 50 60 70 80 90 Latitude [ oN] Vortex breakup Track of vortex remnants 20 30 40 50 60 70 80 90 Latitude [ oN] θ = 450 K θ = 450 K 20 30 40 50 60 70 80 90 Latitude [ oN] 01.05.97 01.06.97 01.07.97 time Track of vortex remnants Subtrop. jet 2000 20 30 40 50 60 70 80 90 Latitude [ oN] θ = 585 K θ = 585 K 20 30 40 50 60 70 80 90 Latitude [ oN] Vortex breakup Subtrop. jet Track of vortex remnants 20 30 40 50 60 70 80 90 Latitude [ oN] θ = 450 K θ = 450 K 20 30 40 50 60 70 80 90 Latitude [ oN] 01.03.00 01.05.00 time −20.0 −20.0 −15.0 −10.0 −5.0 0.0 5.0 10.0 15.0 20.0 25.0 30.0 35.0 40.0 U [m/s] Vortex breakup Subtrop. jet Track of vortex remnants
Fig. 3. Zonal mean ECMWF winds at θ = 450 (bottom panels) and 585 K (top panels) for the 1997 (left) and 2000 (right) period. The
southward propagation of the vortex remnants is bounded by the subtropical jet. Their meridional tracks are derived from zonally averaged distribution of the vortex air (see Fig. 4).
show that the vortex remnants disappear significantly faster at 450 than at 585 K. The greater Lyapunov exponents in the lower level cause more stirring, greater local deforma-tion rates, and, consequently, more mixing. The lifetime of the vortex remnants at 450 and 585 K is of the order 5 and 10 weeks, respectively. The behavior of vortex remnants formed in March 2000 is similar but, due to an earlier vortex breakup, dominated until mid May by westerly winds, even at 585 K.
It should be emphasized that isentropic simulations may overestimate the lifetime of the vortex remnants, especially in the last phase of their existence when the remnants are los-ing their vertical coherence. Here, the vortex fragments may form elongated and slanted sheets of air, the so-called lam-inae (see e.g. Orsolini et al., 1995) with a very complicated contact surface separating the vortex from the mid latitude air (Haynes and Anglade, 1997). Thus, although the isentropic 2d simulations underestimate such contact surfaces and, con-sequently, overestimate the lifetime of the vortex remnants,
the ratio of their lifetimes is a rather reliable quantity. We conclude that the lifetime of the remnants at 585 K is by a factor of 2 longer than at 450 K.
4 Ozone chemistry in vortex remnants
In the previous section, we have shown that the vortex air trapped in the long-lived vortex remnants is well-isolated from the mid-latitudes. Here, we discuss some properties of the O3-chemistry observed and simulated in such remnants
in spring/summer 1997 and 2000. It is a well-established fact that the polar O3 loss is due to halogen-catalyzed ozone
loss with primary contributions of the reactive chlorine and bromine species which are activated heterogeneously on the surface of the polar stratospheric cloud particles, a primary component of which is nitric acid (HNO3) (Solomon, 1999).
Under Arctic conditions, the ozone loss terminates in spring, as chlorine is deactivated through the formation of ClONO2
www.atmos-chem-phys.org/0000/0001/ Atmos. Chem. Phys., 0000, 0001–12, 2003
Fig. 3. Zonal mean ECMWF winds at θ = 450 (bottom panels) and 585 K (top panels) for the 1997 (left) and 2000 (right) period. The southward propagation of the vortex remnants is bounded by the subtropical jet. Their meridional tracks are derived from zonally averaged distribution of the vortex air (see Fig. 4).
6 Konopka et al.: Dynamics and chemistry of vortex remnants
pure advection mixing too large 20 30 40 50 60 70 80 Latitude [°N] θ = 450 K θ = 450 K 20 30 40 50 60 70 80 Latitude [°N] Vortex breakup Track of vortex remnants Subtrop. jet 20 30 40 50 60 70 80 Latitude [°N] 20 30 40 50 60 70 80 Latitude [°N] 01.05.97 01.06.97 01.07.97 time Track of vortex remnants Subtrop. jet 20 30 40 50 60 70 80 Latitude [°N] θ = 585 K θ = 585 K 20 30 40 50 60 70 80 Latitude [°N] Vortex breakup Track of vortex remnants 20 30 40 50 60 70 80 Latitude [°N] 20 30 40 50 60 70 80 Latitude [°N] 01.05.97 01.06.97 01.07.97 time 100. 0. 20. 40. 60. 80. 100. Part [%] Track of vortex remnants
Fig. 4. Meridional (zonally averaged) contribution of vortex air at θ = 450 (left) and 585 K (right) for CLaMS simulation without (top) and
with excessive (bottom) mixing. The colors denote the zonally averaged percentage the vortex air changing from 100% (pure vortex air) to 0% (pure extra vortex air). The black lines denote the tracks of the vortex air masses during their transport into the mid latitudes (see also Fig. 3)
and a subsequent transformation to HCl (Douglass et al., 1995). The main source of NOx that is controlling the
de-activation of ClOx is either the photolysis of HNO3, its
re-action with OH, or its flux from mid-latitudes. During the period when ClONO2 is converted into HCl, the
photolyti-cally or heterogenously induced reactivation of ClOx from
ClONO2 is still possible.
Thus on the one hand, the formation of HCl in the vor-tex air determines when the chlorine-induced O3-destruction
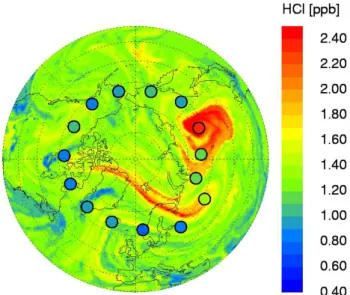
is terminated. On the other hand, the breakup of the vor-tex defines when chaotic advection and intense mixing dom-inate the transport of vortex air into the mid-latitudes. Fig. 7 shows the simulated HCl distributions (using the optimal mixing) two days after the vortex breakup in 1997 and 2000. The black circles denote the corresponding HALOE obser-vations that in the vortex remnants agree fairly well with the CLaMS calculations. The high HCl mixing ratios that were observed in May 1997 indicate a completed chlorine deacti-vation whereas this process is still under way in March 2000. As can be seen in Fig. 8, first at the end of April (i.e. 44
days after the vortex breakup) significantly enhenced mix-ing ratios of HCl become apparent in the simulated vortex remnants that were also observed by HALOE (M¨uller et al., 2002).
A more quantitative description of the deactivation process is given in Fig. 9 where the mean O3-loss rate (per day)
av-eraged over the vortex air together with the partitioning of O3-loss into different chemical destruction cycles are shown.
To distinguish the vortex from the mid-latitude air, we use the transported (i.e. advected and mixed) PV fields. Then, the vortex air is defined as air masses with PV values larger than PV at the vortex edge (Nash et al., 1996) at the begin-ning of the simulation.
A comparison of the mean net O3-loss rate at 450 K
dur-ing the time periods around the vortex breakup in 1997 and 2000 shows in March 2000 significantly faster O3-depletion
than in May 1997. In particular, between the time of the vortex breakup around mid-March and mid-April 2000, the O3 destruction in the vortex remnants was still dominated
by the halogen cycles (green line). By contrast, in mid-May
Atmos. Chem. Phys., 0000, 0001–12, 2003 www.atmos-chem-phys.org/0000/0001/ Fig. 4. Meridional (zonally averaged) contribution of vortex air at θ = 450 (left) and 585 K (right) for CLaMS simulation without (top) and with excessive (bottom) mixing. The colors denote the zonally averaged percentage of the vortex air changing from 100% (pure vortex air) to 0% (pure extra vortex air). The black lines denote the tracks of the vortex air masses during their transport into the mid-latitudes (see also Fig. 3)
844 Konopka et al.: Dynamics and chemistry of vortex remnants
Konopka et al.: Dynamics and chemistry of vortex remnants
7
20 30 40 50 60 70 80 Latitude [ oN] θ = 585 K θ = 585 K 20 30 40 50 60 70 80 Latitude [ oN] Vortex breakup 20 30 40 50 60 70 80 Latitude [ oN] θ = 450 K θ = 450 K 20 30 40 50 60 70 80 Latitude [ oN] 01.05.97 01.06.97 01.07.97 time 1.0 0.0 0.1 0.3 0.4 0.6 0.7 0.9 1.0 mean λ [day−1 ]
Fig. 5. Zonally averaged Lyapunov exponent λ during the 1997
period calculated over a time step ∆t = 12 hours at θ = 450 and 585 K. Note that the summer circulation at 585 K is characterized by very low values of λ.
0.4 0.6 0.8 1.0 1.2 1.4 1.6 1.8 CH 4 [ppmv] θ = 585 K θ = 585 K 0.4 0.6 0.8 1.0 1.2 1.4 1.6 1.8 CH 4 [ppmv] Vortex edge Vortex breakup 0.4 0.6 0.8 1.0 1.2 1.4 1.6 1.8 CH 4 [ppmv] θ = 450 K θ = 450 K 0.4 0.6 0.8 1.0 1.2 1.4 1.6 1.8 CH 4 [ppmv] 01.05.97 01.06.97 01.07.97 time −10.0 −10.0 −8.9 −7.7 −6.6 −5.4 −4.3 −3.1 −2.0 log(PDF)
Fig. 6. PDF of CH4 at θ = 450 and 585 K calculated during the
1997 period. The black lines denote the mean CH4 at the vortex
edge at the beginning of the simulation. The vortex edge was deter-mined by using the Nash criterion (Nash et al., 1996).
Fig. 7. HCl simulated with CLaMS at θ = 450 K 2 days after
the vortex breakup at 12.05.1997 (top) and 17.03.2000 (bottom). High values of HCl indicate a completed chlorine deactivation. The circles denote the HALOE observations
1997, these cycles are negligible, even shortly before the
vor-tex breakup. As already mentioned, these differences can be
explained by the fact that the chlorine deactivation due to
for-mation of HCl is completed before the final vortex breakup
in May 1997, whereas the formation of HCl in spring 2000
is finished in the vortex remnants in mid-April.
At 450 K the contribution of HO
x(HO
x=HO
2+OH)
out-weights the NO
x-induced ozone destruction and is
domi-nated by the direct reaction of HO
xwith ozone. Here, the
ozone destruction driven by NO
xthat was formed by
pho-tolytical decomposition of ClONO
2(Toumi et al., 1993) is
classified as NO
x-induced ozone destruction and contributes
up to 45% to the NO
x-cycles around mid April (not shown
in Fig. 9).
A similar analysis of the O
3-chemistry in the long-lived
vortex remnants at 585 K in 1997 shows that the most
impor-www.atmos-chem-phys.org/0000/0001/
Atmos. Chem. Phys., 0000, 0001–12, 2003
Fig. 5. Zonally averaged Lyapunov exponent λ during the 1997 period calculated over a time step 1t = 12 hours at θ = 450 and 585 K. Note that the summer circulation at 585 K is characterized by very low values of λ.
by the local deformation rates, indicates very weak mixing at this level that is in agreement with the diagnostic of atmo-spheric transport in terms of the effective diffusivity (Haynes and Shuckburgh, 1999).
To quantify the effect of mixing on the lifetime of vor-tex remnants the PDFs (probability density function) calcu-lated for CLaMS CH4 distributions are shown in Fig. 6. The PDF is proportional to the area occupied by tracer values in a given range of mixing ratios (for details see e.g. Sparling, 2000). Here, the black lines denote the vortex edge trans-formed from the PV to CH4 field. Thus, the PDFs of the CH4 values below these lines describe the contribution of vortex air to all air masses poleward of 30◦N. The results show that the vortex remnants disappear significantly faster at 450 than at 585 K. The greater Lyapunov exponents in the lower level cause more stirring, greater local deforma-tion rates, and, consequently, more mixing. The lifetime of the vortex remnants at 450 and 585 K is of the order 5 and 10 weeks, respectively. The behavior of vortex remnants formed in March 2000 is similar but, due to an earlier vortex breakup, dominated until mid-May by westerly winds, even at 585 K. It should be emphasized that isentropic simulations may overestimate the lifetime of the vortex remnants, especially in the last phase of their existence when the remnants are
los-Konopka et al.: Dynamics and chemistry of vortex remnants
7
20 30 40 50 60 70 80 Latitude [ oN] θ = 585 K θ = 585 K 20 30 40 50 60 70 80 Latitude [ oN] Vortex breakup 20 30 40 50 60 70 80 Latitude [ oN] θ = 450 K θ = 450 K 20 30 40 50 60 70 80 Latitude [ oN] 01.05.97 01.06.97 01.07.97 time 1.0 0.0 0.1 0.3 0.4 0.6 0.7 0.9 1.0 mean λ [day−1 ]
Fig. 5. Zonally averaged Lyapunov exponent λ during the 1997 period calculated over a time step ∆t = 12 hours at θ = 450 and 585 K. Note that the summer circulation at 585 K is characterized by very low values of λ.
0.4 0.6 0.8 1.0 1.2 1.4 1.6 1.8 CH 4 [ppmv] θ = 585 K θ = 585 K 0.4 0.6 0.8 1.0 1.2 1.4 1.6 1.8 CH 4 [ppmv] Vortex edge Vortex breakup 0.4 0.6 0.8 1.0 1.2 1.4 1.6 1.8 CH 4 [ppmv] θ = 450 K θ = 450 K 0.4 0.6 0.8 1.0 1.2 1.4 1.6 1.8 CH 4 [ppmv] 01.05.97 01.06.97 01.07.97 time −10.0 −10.0 −8.9 −7.7 −6.6 −5.4 −4.3 −3.1 −2.0 log(PDF)
Fig. 6. PDF of CH4 at θ = 450 and 585 K calculated during the
1997 period. The black lines denote the mean CH4 at the vortex
edge at the beginning of the simulation. The vortex edge was deter-mined by using the Nash criterion (Nash et al., 1996).
Fig. 7. HCl simulated with CLaMS at θ = 450 K 2 days after the vortex breakup at 12.05.1997 (top) and 17.03.2000 (bottom). High values of HCl indicate a completed chlorine deactivation. The circles denote the HALOE observations
1997, these cycles are negligible, even shortly before the
vor-tex breakup. As already mentioned, these differences can be
explained by the fact that the chlorine deactivation due to
for-mation of HCl is completed before the final vortex breakup
in May 1997, whereas the formation of HCl in spring 2000
is finished in the vortex remnants in mid-April.
At 450 K the contribution of HO
x(HO
x=HO
2+OH)
out-weights the NO
x-induced ozone destruction and is
domi-nated by the direct reaction of HO
xwith ozone. Here, the
ozone destruction driven by NO
xthat was formed by
pho-tolytical decomposition of ClONO
2(Toumi et al., 1993) is
classified as NO
x-induced ozone destruction and contributes
up to 45% to the NO
x-cycles around mid April (not shown
in Fig. 9).
A similar analysis of the O
3-chemistry in the long-lived
vortex remnants at 585 K in 1997 shows that the most
impor-www.atmos-chem-phys.org/0000/0001/
Atmos. Chem. Phys., 0000, 0001–12, 2003
Fig. 6. PDF of CH4 at θ = 450 and 585 K calculated during the 1997 period. The black lines denote the mean CH4 at the vortex edge at the beginning of the simulation. The vortex edge was deter-mined by using the Nash criterion (Nash et al., 1996).
ing their vertical coherence. Here, the vortex fragments may form elongated and slanted sheets of air, the so-called lam-inae (see e.g. Orsolini et al., 1995) with a very complicated contact surface separating the vortex from the mid-latitude air (Haynes and Anglade, 1997). Thus, although the isen-tropic 2-D simulations underestimate such contact surfaces and, consequently, overestimate the lifetime of the vortex remnants, the ratio of their lifetimes is a rather reliable quan-tity. We conclude that the lifetime of the remnants at 585 K is longer than at 450 K by a factor of 2.
4 Ozone chemistry in vortex remnants
In the previous section, we showed that the vortex air trapped in the long-lived vortex remnants is well-isolated from the mid-latitudes. Here, we discuss some properties of the O3 chemistry observed and simulated in such remnants in spring/summer 1997 and 2000. It is a well-established fact that the polar O3 loss is due to halogen-catalyzed ozone loss with primary contributions of the reactive chlorine and bromine species which are activated heterogeneously on the surface of the polar stratospheric cloud particles, a primary component of which is nitric acid (HNO3) (Solomon, 1999).
Konopka et al.: Dynamics and chemistry of vortex remnants 845
Konopka et al.: Dynamics and chemistry of vortex remnants
7
20 30 40 50 60 70 80 Latitude [ oN] θ = 585 K θ = 585 K 20 30 40 50 60 70 80 Latitude [ oN] Vortex breakup 20 30 40 50 60 70 80 Latitude [ oN] θ = 450 K θ = 450 K 20 30 40 50 60 70 80 Latitude [ oN] 01.05.97 01.06.97 01.07.97 time 1.0 0.0 0.1 0.3 0.4 0.6 0.7 0.9 1.0 mean λ [day−1 ]
Fig. 5. Zonally averaged Lyapunov exponent λ during the 1997
period calculated over a time step ∆t = 12 hours at θ = 450 and 585 K. Note that the summer circulation at 585 K is characterized by very low values of λ.
0.4 0.6 0.8 1.0 1.2 1.4 1.6 1.8 CH 4 [ppmv] θ = 585 K θ = 585 K 0.4 0.6 0.8 1.0 1.2 1.4 1.6 1.8 CH 4 [ppmv] Vortex edge Vortex breakup 0.4 0.6 0.8 1.0 1.2 1.4 1.6 1.8 CH 4 [ppmv] θ = 450 K θ = 450 K 0.4 0.6 0.8 1.0 1.2 1.4 1.6 1.8 CH 4 [ppmv] 01.05.97 01.06.97 01.07.97 time −10.0 −10.0 −8.9 −7.7 −6.6 −5.4 −4.3 −3.1 −2.0 log(PDF)
Fig. 6. PDF of CH4 at θ = 450 and 585 K calculated during the
1997 period. The black lines denote the mean CH4 at the vortex
edge at the beginning of the simulation. The vortex edge was deter-mined by using the Nash criterion (Nash et al., 1996).
Fig. 7. HCl simulated with CLaMS at θ = 450 K 2 days after
the vortex breakup at 12.05.1997 (top) and 17.03.2000 (bottom). High values of HCl indicate a completed chlorine deactivation. The circles denote the HALOE observations
1997, these cycles are negligible, even shortly before the
vor-tex breakup. As already mentioned, these differences can be
explained by the fact that the chlorine deactivation due to
for-mation of HCl is completed before the final vortex breakup
in May 1997, whereas the formation of HCl in spring 2000
is finished in the vortex remnants in mid-April.
At 450 K the contribution of HO
x(HO
x=HO
2+OH)
out-weights the NO
x-induced ozone destruction and is
domi-nated by the direct reaction of HO
xwith ozone. Here, the
ozone destruction driven by NO
xthat was formed by
pho-tolytical decomposition of ClONO
2(Toumi et al., 1993) is
classified as NO
x-induced ozone destruction and contributes
up to 45% to the NO
x-cycles around mid April (not shown
in Fig. 9).
A similar analysis of the O
3-chemistry in the long-lived
vortex remnants at 585 K in 1997 shows that the most
impor-www.atmos-chem-phys.org/0000/0001/
Atmos. Chem. Phys., 0000, 0001–12, 2003
Fig. 7. HCl simulated with CLaMS at θ = 450 K 2 days after the vortex breakup at 12.05.1997 (top) and 17.03.2000 (bottom). High values of HCl indicate a completed chlorine deactivation. The circles denote the HALOE observations
Under Arctic conditions, the ozone loss terminates in spring, as chlorine is deactivated through the formation of ClONO2 and a subsequent transformation to HCl (Douglass et al., 1995). The main source of NOx which controls the deacti-vation of ClOx is either the photolysis of HNO3, its reaction with OH, or its flux from mid-latitudes. During the period when ClONO2 is converted into HCl, the photolytically or heterogenously induced reactivation of ClOx from ClONO2 is still possible.
Thus on the one hand, the formation of HCl in the vortex air determines when the chlorine-induced O3 destruction is terminated. On the other hand, the breakup of the vortex de-fines when chaotic advection and intense mixing dominate the transport of vortex air into the mid-latitudes. Figure 7 shows the simulated HCl distributions (using the optimal mixing) two days after the vortex breakup in 1997 and 2000.
8
Konopka et al.: Dynamics and chemistry of vortex remnants
Fig. 8. HCl simulated with CLaMS at θ = 450 K on 29.04.2000, i.e. 44 days after the vortex breakup.
tant destruction cycle is the “summertime” NO
x-chemistry
(Hansen and Chipperfield, 1999; Fahey and Ravishankara,
1999). Furthermore, the fractional contribution of the
dif-ferent cycles to the O
3-loss in the vortex remnants does not
significantly differ from the O
3-loss partitioning calculated
for extra-vortex air masses northward of 60
0N (not shown).
So although the chemical composition of the coarsely-mixed
vortex remnants still differs from the composition of the
am-bient air, the contribution of the O
3-loss cycles to the total
O
3-depletion is very similar in both types of air.
The fact that the deactivation process in spring 1997 was
still completed in a well-isolated vortex indicates that at least
in this year, the chlorine deactivation was decoupled from
mixing and mainly driven by the in situ chemical
produc-tion of NO
x. On the other side, the incomplete deactivation
shortly before the vortex breakup in March 2000 offers the
possibility to study the influence of mixing on this process
during the final vortex decay.
5
The impact of mixing
Using different values of the mixing parameters, we now
study the influence of mixing on the accumulated ozone loss
in the mid and high latitudes after the vortex breakup around
mid March 2000 at the isentropic surface 450 K. The
accu-mulated ozone loss is defined as the difference between the
passively transported and chemically changed ozone. Here,
this difference is determined for the time period between
10.02 and 31.05.2000 and averaged over all air masses
pole-ward of 30
0N. The results calculated for the optimal mixing
are shown in Fig. 10 (red line).
In order to study the influence of halogen chemistry on
the O
3-loss, the black line describes the accumulated ozone
loss calculated from a chemistry run without halogen
cy-cles (Cl
y=Br
y=0). The yellow curve describes the
accumu-lated ozone loss for a scenario with a strong denitrification as
would be expected for Antarctic conditions (HNO
3≈2ppbv
in the vortex). The remaining curves describe the sensitivity
of the reference simulation (red) on the intensity of mixing
with effective diffusivity varying between 1.1 10
3and 4.2
10
5m
2s
−1Thus, the halogen-induced mid-latitude ozone deficit in
spring 2000, defined here as the difference between the red
and black curves, can be divided into 3 phases (see dashed
red and black lines in Fig. 10): Until mid-March ozone
de-struction due to halogen chemistry occurs in a well-isolated
Arctic vortex. From March (vortex breakup) until
mid-April the ozone-depleted air masses are transported into the
mid-latitudes. By comparing the slopes of the red and black
lines during this period, we conclude that the chlorine and
bromine chemistry still destroy ozone in vortex remnants
(see Fig. 9), albeit with a smaller intensity than in February
and in early March. Here, the main source of active chlorine
is the photolysis of ClONO
2. Between mid-April and end of
May, the slopes of the dashed black and red lines are
compa-rable and, consequently, the halogen-induced ozone
destruc-tion is negligible during this period. Thus, compared with the
ozone distribution in a halogen-free stratosphere (black line),
the mid-latitude ozone deficit at the isentropic level 450 K
can be determined. Thus, the halogen-induced ozone deficit
at the end of May amounts to about 12%. The contribution
of the vortex remnants formed after the vortex breakup can
be quantified to about 2%.
The sensitivity studies with respect to mixing show that the
accumulated ozone loss does not change as long as the
effec-tive diffusivity in the model is smaller than
3×10
4m
2/s. This
value corresponds to a spatial resolution of the order 100 km.
Also, the deactivation of ClO
xvia formation of ClONO
2is
mainly due to photochemical decomposition of HNO
3rather
than due to chemistry induced by mixing of the activated
vor-tex air with NO
x-rich mid-latitude air. Only for the diffusion
being greater than an unrealistically large critical value of
10
5m
2/s (corresponding to a spatial resolution of the order
200 km) mixing of mid-latitude air has a significant impact
on ClONO
2formation in vortex remnants.
Using an Eulerian model, Tan et al. (1998) postulated
a much stronger influence of the numerical mixing on the
chlorine deactivation. They concluded that Eulerian grid
resolution better than 40 km is necessary to correctly
de-scribe the deactivation process. Assuming that the
numer-ical diffusivity is proportional to
r
20
/∆t, the discussed
La-grangian critical resolution
r
0L= r
0≈
100 km can be
trans-formed to an equivalent Eulerian resolution
r
0Eby
r
0E=
r
0Lp∆t
E/∆t
Lwhere
∆t
L≈
24 hours and ∆t
E≈
15
min are the typical Lagrangian and Eulerian time steps.
Us-ing this crude estimate, we obtain
r
0E≈
10 km that
prob-Atmos. Chem. Phys., 0000, 0001–12, 2003
www.atmos-chem-phys.org/0000/0001/
Fig. 8. HCl simulated with CLaMS at θ = 450 K on 29.04.2000, i.e. 44 days after the vortex breakup.
The black circles denote the corresponding HALOE obser-vations that in the vortex remnants agree fairly well with the CLaMS calculations. The high HCl mixing ratios that were observed in May 1997 indicate a completed chlorine deacti-vation whereas this process is still under way in March 2000. As can be seen in Fig. 8, first at the end of April (i.e. 44 days after the vortex breakup) significantly enhanced mix-ing ratios of HCl become apparent in the simulated vortex remnants that were also observed by HALOE (M¨uller et al., 2002).
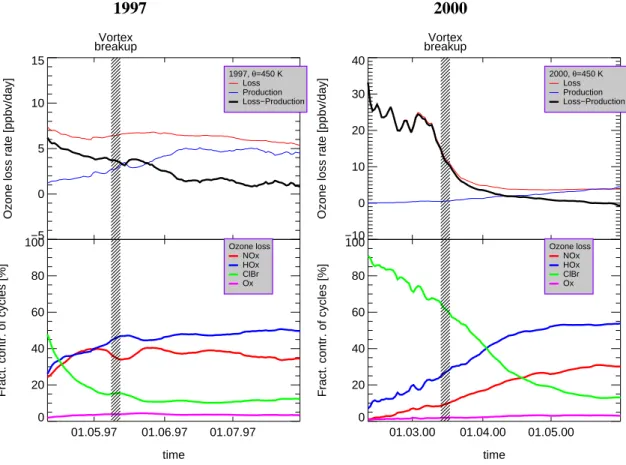
A more quantitative description of the deactivation process is given in Fig. 9 where the mean O3 loss rate (per day) aver-aged over the vortex air together with the partitioning of O3 loss into different chemical destruction cycles are shown. To distinguish the vortex from the mid-latitude air, we use the transported (i.e. advected and mixed) PV fields. Then, the vortex air is defined as air masses with PV values larger than PV at the vortex edge (Nash et al., 1996) at the beginning of the simulation.
A comparison of the mean net O3 loss rate at 450 K dur-ing the time periods around the vortex breakup in 1997 and 2000 shows significantly faster O3 depletion in March 2000 than in May 1997. In particular, between the time of the vortex breakup around mid-March and mid-April 2000, the O3 destruction in the vortex remnants was still dominated by the halogen cycles (green line). By contrast, in mid-May 1997, these cycles are negligible, even shortly before the vor-tex breakup. As already mentioned, these differences can be explained by the fact that the chlorine deactivation due to for-mation of HCl is completed before the final vortex breakup in May 1997, whereas the formation of HCl in spring 2000 is finished in the vortex remnants in mid-April.
846 Konopka et al.: Dynamics and chemistry of vortex remnants Konopka et al.: Dynamics and chemistry of vortex remnants9
1997
−5 0 5 10 15Ozone loss rate [ppbv/day]
Vortex breakup
1997, θ =450 K Loss Production Loss−Production
1997, θ=450 K Loss Production Loss−Production 01.05.97 01.06.97 01.07.97 time 0 20 40 60 80 100
Fract. contr. of cycles [%]
Ozone loss NOx HOx ClBr Ox Ozone loss NOx HOx ClBr Ox
2000
−10 0 10 20 30 40Ozone loss rate [ppbv/day]
Vortex breakup
2000, θ =450 K Loss Production Loss−Production
2000, θ=450 K Loss Production Loss−Production 01.03.00 01.04.00 01.05.00 time 0 20 40 60 80 100
Fract. contr. of cycles [%]
Ozone loss NOx HOx ClBr Ox Ozone loss NOx HOx ClBr Ox
Fig. 9. Top: Mean ozone loss rate (per day) in the vortex air (i.e. air masses with transported PV larger than vortex edge PV at the beginnig
of the simulation). Bottom: Contribution of different chemical destruction cycles at 450 K in 1997 (left) and 2000 (right).
ably underestimates the critical resolution of the Eulerian schemes discussed by Tan et al. (1998) (the difference be-tween the 10 and 40 km is probably due to the weak diffusiv-ity of the Prather scheme). Nevertheless, the small numeri-cal diffusion of the Lagrangian transport allows to study the mixing-sensitive processes by using model resolutions that are coarser than the corresponding Eulerian studies.
In addition, our studies show that mixing may influence chemistry in some small-scale filaments during their final dissipation. For budget studies (e.g. impact of mixing on the mid-latitude ozone deficit) such small-scale structures are negligible if compared with large, coherent vortex frag-ments where the bulk contribution outweights the effect of the mixing-sensitive surface. Thus, even after the vortex breakup in mid-March 2000, the averaged deactivation pro-cess is dominated by in situ chemistry rather than mixing. Furthermore, the results of pure advection studies (i.e. in terms of the photochemical box model) do not significantly differ from the simulations with the optimal mixing. One rea-son for this weak impact of mixing on the O3-chemistry may
be the fact that shortly before the vortex breakup a significant
amount of active chlorine was transformed into ClONO2. If
strong intrusions of the mid-latitude air occur into a vortex with chlorine fully activated (as discussed e.g. in Plumb et al. (1994)), the importance of mixing on the deactivation pro-cess may be higher.
6 Conclusions
Full chemistry simulations were carried out with the Chemi-cal Lagrangian Model of the Stratosphere (CLaMS) to study the spatial distribution, lifetime and O3-chemistry of the
vor-tex remnants created after the vorvor-tex breakup in spring and summer 1997 and 2000. Isentropic 2d simulations on two isentropic levels 450 K (≈ 18 km) and 585 K (≈ 24 km) have been conducted with a very high spatial resolution (up to 20 km) in order to resolve the filamentary structure of slowly dissipating vortex remnants. The isentropic approximation was justified by the comparison with the HALOE tracer mea-surements and radiation calculations.
In agreement with the investigations of Orsolini (2001) and Piani et al. (2002), the zonal distribution of the vortex air
www.atmos-chem-phys.org/0000/0001/ Atmos. Chem. Phys., 0000, 0001–12, 2003
Fig. 9. Top: Mean ozone loss rate (per day) in the vortex air (i.e. air masses with transported PV larger than vortex edge PV at the beginning of the simulation). Bottom: Contribution of different chemical destruction cycles at 450 K in 1997 (left) and 2000 (right).
At 450 K the contribution of HOx (HOx=HO2+OH) out-weighs the NOx-induced ozone destruction and is dominated by the direct reaction of HOx with ozone. Here, the ozone destruction driven by NOx formed by the photolytical de-composition of ClONO2 (Toumi et al., 1993) is classified as NOx-induced ozone destruction and contributes up to 45% to the NOx-cycles around mid-April (not shown in Fig. 9).
A similar analysis of the O3 chemistry in the long-lived vortex remnants at 585 K in 1997 shows that the most impor-tant destruction cycle is the “summertime” NOx chemistry (Hansen and Chipperfield, 1999; Fahey and Ravishankara, 1999). Furthermore, the fractional contribution of the differ-ent cycles to the O3 loss in the vortex remnants does not sig-nificantly differ from the O3 loss partitioning calculated for extra-vortex air masses northward of 60◦N (not shown). Al-though the chemical composition of the coarsely-mixed vor-tex remnants still differs from the composition of the ambient air, the contribution of the O3 loss cycles to the total O3 de-pletion is very similar in both types of air.
The fact that the deactivation process in spring 1997 was still completed in a well-isolated vortex indicates that, at least in this year, the chlorine deactivation was decoupled from mixing and mainly driven by the in situ chemical produc-tion of NOx. On the other hand, the incomplete deactivation
shortly before the vortex breakup in March 2000 offers the possibility of studying the influence of mixing on this pro-cess during the final vortex decay.
5 The impact of mixing
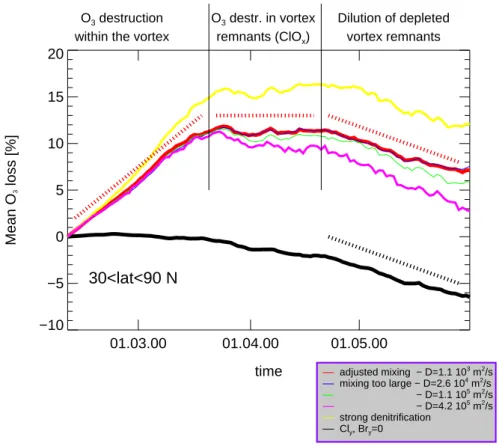
Using different values of the mixing parameters, we now study the influence of mixing on the accumulated ozone loss in the mid and high latitudes after the vortex breakup around mid-March 2000 at the isentropic surface 450 K. The accu-mulated ozone loss is defined as the difference between the passively transported and chemically changed ozone. Here, this difference is determined for the time period between 10.02 and 31.05.2000 and averaged over all air masses pole-ward of 30◦N. The results calculated for the optimal mixing are shown in Fig. 10 (red line).
In order to study the influence of halogen chemistry on the O3 loss, the black line describes the accumulated ozone loss calculated from a chemistry run without halogen cy-cles (Cly=Bry=0). The yellow curve describes the accumu-lated ozone loss for a scenario with a strong denitrification as would be expected for Antarctic conditions (HNO3≈2ppbv in the vortex). The remaining curves describe the sensitivity
Konopka et al.: Dynamics and chemistry of vortex remnants10 Konopka et al.: Dynamics and chemistry of vortex remnants 847 01.03.00 01.04.00 01.05.00 time −10 −5 0 5 10 15 20 Mean O 3 loss [%] O3 destruction
within the vortex
O3 destr. in vortex remnants (ClOx) Dilution of depleted vortex remnants
30<lat<90 N
adjusted mixing − D=1.1 10 3 m 2/s /s 22 m m 54 mixing too large − D=2.6 10 − D=1.1 10 /s 2 m 5 − D=4.2 10
/s =0 y , Br y strong denitrification Cl
adjusted mixing − D=1.1 103 m2/s
mixing too large − D=2.6 104 m2/s
− D=1.1 105 m2/s
− D=4.2 105 m2/s
strong denitrification Cly, Bry=0
Fig. 10. Accumulated ozone loss poleward of 30◦N at 450 K (red line). The black line describes the accumulated ozone loss calculated
from a chemistry run without halogen cycles (Cly=Bry=0). The remaining solid lines are explained in the text. The dashed lines define 3
periods with respect to the following effects in the ozone chemistry: O3 destruction within the vortex, O3destruction in vortex remnants
and dilution of depleted vortex remnats. During the last period, the reference run (red) and the halogen-free atmosphere (black) show the same mean ozone loss.
after the vortex breakup shows different patterns above and belove 20 km. Especially in summer 1997 the differences are evident with long-lived vortex remnants above 20 km, which are trapped in the “solid body” summer circulation with very weak mixing, and, below 20 km, with a significant stirring and mixing caused by the influence of the subtropi-cal jet. The subtropisubtropi-cal jet bounds the southward propagation of the remnants up to 550
N below 20 km whereas above 20 km the weakly mixed vortex air may reach 400
N. Although the meridional distribution of such remnants is mainly de-termined by the chaotic advection, their lifetime, in contrast, strongly depends on mixing and above 20 km it is approxi-mately twice as long as below 20 km. The isentropic sim-ulations may underestimate mixing and, consequently, the absolute lifetimes of the vortex remnants, in particular dur-ing the phase when the vortex remnants loose their vertical coherence.
The different times of vortex breakup in 1997 and 2000 are responsible for different chemical signatures in vortex remnants simulated with CLaMS and observed by HALOE. The O3-chemistry in the vortex remnants strongly depends
on the partitioning between active and reservoir compounds within the Clyand Bryfamilies. If shortly before the vortex
breakup, most of the chlorine is contained in HCl (as in 1997) then small ozone loss rates have to be expected in the vor-tex remnants, which are mainly driven by the HOx (450 K)
and NOx (585 K) destruction cycles. If, on the other hand,
ClONO2 and partially ClOx are the main reservoirs of the
chlorine shortly before the vortex breakup (as in 2000), then a chlorine-induced ozone destruction within the vortex rem-nants can be expected mainly due the photolytical decompo-sition of ClONO2. The impact of mixing is negligible due to
a negligible flux of NOx into the (coherent) vortex remnants.
Here, the more important source of NOx is the photolytical
Atmos. Chem. Phys., 0000, 0001–12, 2003 www.atmos-chem-phys.org/0000/0001/
Fig. 10. Accumulated ozone loss poleward of 30◦N at 450 K (red line). The black line describes the accumulated ozone loss calculated from a chemistry run without halogen cycles (Cly=Bry=0). The remaining solid lines are explained in the text. The dashed lines define 3 periods with respect to the following effects in the ozone chemistry: O3 destruction within the vortex, O3 destruction in vortex remnants and dilution of depleted vortex remnants. During the last period, the reference run (red) and the halogen-free atmosphere (black) show the same mean ozone loss.
of the reference simulation (red) on the intensity of mixing with effective diffusivity varying between 1.1 103 and 4.2 105m2s−1
Thus, the halogen-induced mid-latitude ozone deficit in spring 2000, defined here as the difference between the red and black curves, can be divided into 3 phases (see dashed red and black lines in Fig. 10). Until mid-March ozone de-struction due to halogen chemistry occurs in a well-isolated Arctic vortex. From March (vortex breakup) until mid-April the ozone-depleted air masses are transported into the mid-latitudes. By comparing the slopes of the red and black lines during this period, we conclude that the chlorine and bromine chemistry still destroy ozone in vortex remnants (see Fig. 9), albeit with a smaller intensity than in February and in early March. Here, the main source of active chlorine is the photolysis of ClONO2. Between mid-April and end of May, the slopes of the dashed black and red lines are compa-rable and, consequently, the halogen-induced ozone destruc-tion is negligible during this period. Thus, compared with the ozone distribution in a halogen-free stratosphere (black line), the mid-latitude ozone deficit at the isentropic level 450 K can be determined. Thus, the halogen-induced ozone deficit at the end of May amounts to about 12%. The contribution
of the vortex remnants formed after the vortex breakup can be quantified to about 2%.
The sensitivity studies with respect to mixing show that the accumulated ozone loss does not change as long as the effective diffusivity in the model is smaller than 3 × 10⁴ m2/s. This value corresponds to a spatial resolution of the order 100 km. Also, the deactivation of ClOx via formation of ClONO2 is mainly due to photochemical decomposition of HNO3 rather than to chemistry induced by mixing of the activated vortex air with NOx-rich mid-latitude air. Only if diffusion is greater than an unrealistically large critical value of 105m2/s (corresponding to a spatial resolution of the order 200 km) mixing of mid-latitude air has a significant impact on ClONO2 formation in vortex remnants.
Using an Eulerian model, Tan et al. (1998) postulated a much stronger influence of the numerical mixing on the chlo-rine deactivation. They concluded that Eulerian grid resolu-tion better than 40 km is necessary to correctly describe the deactivation process. Assuming that the numerical diffusiv-ity is proportional to r02/1t, the discussed Lagrangian criti-cal resolution r0L=r0 ≈100 km can be transformed to an equivalent Eulerian resolution r0E by r0E =r0L
√
1tE/1tL where 1tL ≈ 24 hours and 1tE ≈ 15 min are the typical