HAL Id: hal-00295792
https://hal.archives-ouvertes.fr/hal-00295792
Submitted on 23 Nov 2005
HAL is a multi-disciplinary open access
archive for the deposit and dissemination of
sci-entific research documents, whether they are
pub-lished or not. The documents may come from
teaching and research institutions in France or
abroad, or from public or private research centers.
L’archive ouverte pluridisciplinaire HAL, est
destinée au dépôt et à la diffusion de documents
scientifiques de niveau recherche, publiés ou non,
émanant des établissements d’enseignement et de
recherche français ou étrangers, des laboratoires
publics ou privés.
Impact of mixing and chemical change on ozone-tracer
relations in the polar vortex
R. Müller, S. Tilmes, P. Konopka, J.-U. Grooß, H.-J. Jost
To cite this version:
R. Müller, S. Tilmes, P. Konopka, J.-U. Grooß, H.-J. Jost. Impact of mixing and chemical change on
ozone-tracer relations in the polar vortex. Atmospheric Chemistry and Physics, European Geosciences
Union, 2005, 5 (11), pp.3139-3151. �hal-00295792�
Atmos. Chem. Phys., 5, 3139–3151, 2005 www.atmos-chem-phys.org/acp/5/3139/ SRef-ID: 1680-7324/acp/2005-5-3139 European Geosciences Union
Atmospheric
Chemistry
and Physics
Impact of mixing and chemical change on ozone-tracer relations in
the polar vortex
R. M ¨uller1, S. Tilmes1,*, P. Konopka1, J.-U. Grooß1, and H.-J. Jost2
1ICG I, Forschungszentrum J¨ulich, 52425 J¨ulich, Germany 2Bay Area Environmental Research Institute, Sonoma, CA, USA *now at: ACD, NCAR, Boulder, CO, USA
Received: 8 June 2005 – Published in Atmos. Chem. Phys. Discuss.: 10 August 2005 Revised: 4 November 2005 – Accepted: 7 November 2005 – Published: 23 November 2005
Abstract. Tracer-tracer relations have been used for a
long time to separate physico-chemical change from change caused by transport processes. In particular, for more than a decade, ozone-tracer relations have been used to quantify chemical ozone loss in the polar vortex. The application of ozone-tracer relations for quantifying ozone loss relies on two hypotheses: that a compact ozone-tracer relation is es-tablished in the ‘early’ polar vortex and that any change of the ozone-tracer relation in the vortex over the course of win-ter is caused predominantly by chemical ozone loss. Here, we revisit this issue by analysing various sets of measure-ments and the results from several models. We find that mix-ing across the polar vortex edge impacts ozone-tracer rela-tions in a way that may solely lead to an ‘underestimation’ of chemical ozone loss and not to an overestimation. Fur-ther, differential descent in the vortex and internal mixing has only a negligible impact on ozone loss estimates. More-over, the representation of mixing in three-dimensional atmo-spheric models can have a substantial impact on the develop-ment of tracer relations in the model. Rather compact ozone-tracer relations develop – in agreement with observations – in the vortex of a Lagrangian model (CLaMS) where mix-ing is anisotropic and driven by the deformation of the flow. We conclude that, if a reliable ‘early vortex’ reference can be obtained and if vortex measurements are separated from mid-latitude measurements, ozone-tracer relations constitute a reliable tool for the quantitative determination of chemical ozone loss in the polar vortex.
1 Introduction
In the stratosphere, compact relations are expected between tracers for which quasi-horizontal mixing along isentropes
Correspondence to: R. M¨uller
is fast compared to their local chemical lifetimes (Plumb and Ko, 1992). This fact has been exploited in a variety of studies addressing a wide range of stratospheric research issues (e.g., Roach, 1962; Fahey et al., 1990; Volk et al., 1996; Sankey and Shepherd, 2003, and references therein). Further, it has been suggested that observed tracer-tracer relations can be used as a tool for the validation of chemistry climate models (Proffitt et al., 2003; Khosrawi et al., 2004) since the results of such models are otherwise difficult to compare with ob-servations.
As long as a strong polar vortex exists, compact relations are also expected for the air mass inside the polar vortex. In particular, as (in the absence of halogen-catalysed chemi-cal loss) ozone in the winter polar vortex can be considered long-lived (e.g., Proffitt et al., 1992; Sankey and Shepherd, 2003), compact ozone-tracer relations are expected for the polar vortex (e.g., Proffitt et al., 1993; M¨uller et al., 2001; Tilmes et al., 2004).
Therefore, tracer-tracer correlations (TRAC) have been used, for more than a decade now, to quantify chemical ozone loss in the polar vortices. Measurements from aircraft (Prof-fitt et al., 1990, 1993; Richard et al., 2001; Ross et al., 2004; Ulanovskii et al., 2004), satellites (M¨uller et al., 1996; Tilmes et al., 2003b, 2004), balloons (M¨uller et al., 2001; Salawitch et al., 2002; Vogel et al., 2003; Robinson et al., 2005), and from the Space Shuttle (Michelsen et al., 1998) were used for such analyses.
The TRAC methodology has been described in detail else-where (e.g., Proffitt et al., 1990; M¨uller et al., 1996, 2001; Salawitch et al., 2002; Tilmes, 2004; Tilmes et al., 2004). Briefly, an ozone-tracer relation that is established in the ‘early’ polar vortex will be unaltered (‘frozen in’) through-out the existence of the polar vortex in the absence of mixing and chemical ozone loss. In particular, diabatic descent in-side the vortex alone cannot change an ozone-tracer relation. Considering the change of ozone-tracer relations within the vortex for quantifying chemical ozone loss in the polar
3140 R. M¨uller et al.: Ozone/tracer relations in the polar vortex
2 R. M¨uller: Ozone/tracer relations in the polar vortex
ozone-tracer relation is established in the ‘early’ polar vor-tex, i.e., before the onset of chemical ozone loss. Second, that any change of the ozone-tracer relation in the vortex over the course of winter is caused predominantly by chemical ozone loss. r rrrrrrrrrrrrrrrrrrrrrrrrrrrr rrrrrrrrrrrrrrrrrrrrrrrrrrrrr rrrrrrrrrrrrrrrrrrrrrrrrrrrrr r r rrrrrrrrrrrrrrrrrrrrrrrrrrr r r rrrrrrrrrrrrrrrrrrrrrrrrrrr r rrrrrrrrrrrrrrrrrrrrrrrrrrrr r rrrrrrrrrrrrrrrrrrrrrrrrrrrr r rrrrrrrrrrrrrrrrrrrrrrrrrrrr rrrrrrrrrrrrrrrrrrrrrrrrrrrrr rrrrrrrrrrrrrrrrrrrrrrrrrrrrr r r rrrrrrrrrrrrrrrrrrrrrrrrrrr r r rrrrrrrrrrrrrrrrrrrrrrrrrrr rr r rr rr r rr rr rr r rr rr r rr rr r rr rr r rr r rrrrrrrrr rrr rrr rrr rrrrrrrrr rrrr rrrrrrrrrrrrrrrrrrrrrrrrrrrrrrrrrrrrrrrrrrrrrrrrrrrrrrrrrrrrrrrrrrrrrrrrrrrrrrrrrrrrrrrrrrrrrrrrrrrrrrrrrrrrrrrrrrrrrrrrrrrrrrrrrrrrrrrrrrrrrrrrrrrrrrrrrrrrrrrrrrrrrrrrrrrrrrrrrrrrrrrrrrrrrrrrrrrrrrrrrrrrrrrrrrrrrrrrrrrrrrrrrrrrrrrrrrrrrrrrrrrrrrrrrrrrrrrrrrrrrrrrrrrrrrrrrrrrrrrrrrrrrrrrrrrrrrrrrrrrrrrrrrrrrrrrrrrrrrrrrrrrrrrrrrrrrrrrrrrrrrrrrrrrrrrrrrrrrrrrrrrrrrrrrrrrrrrrrrrrrrrrrrrrrrrrrrrrrrrrrrrrrrrrrrrrrrrrrrrrrrrrrrrrrrrrrrrrrrrrrrrrrrrrrrrrrrrrrrrrrrrrrrrrrrrrrrrrrrrrrrrrrrrrrrrrrrrrrrrrrrrrrrrrrrrrrrrrrrrrrrrrrrrrrrrrrrrrrrrrrrrrrrrrrrrrrrrrrrrrrrrrrrrrrrrrrrrrrrrrrrrrrrrrrrrrrrrrrrrrrrrrrrrrrrrrrrrrrrrrrrrrrrrrrrrrrrrrrrrrrrrrrrrrrrrrrrrrrrrrrrrrrrrrrrrrrrrrrrrrrrrrrrrrrrrrrrrrrrrrrrrrrrrrrrrrrrrrrrrrrrrrrrrrrrrrrrrrrrrrrrrrrrrrrrrrrrrrrrrrrrrrrrrrr r rrr rrrrrrrrrrrrrrrrrrrrrrrrrrrrrrrrrrrrrrrrrrrrrrrrrrrrrrrrrrrrrrrrrrrrrrrrrrrrrrrrrrrrrrrrrrrrrrrrrrrrrrrrrrrrrrrrrrrrrrrrrrrrrrrrrrrrrrrrrrrrrrrrrrrrrrrrrrrrrrrrrrrrrrrrrrrrrrrrrrrrrrrrrrrrrrrrrrrrrrrrrrrrrrrrrrrrrrrrrrrrrrrrrrrrrrrrrrrrrrrrrrrrrrrrrrrrrrrrrrrrrrrrrrrrrrrrrrrrrrrrrrrrrrrrrrrrrrrrrrrrrrrrrrrrrrrrrrrrrrrrrrrrrrrrrrrrrrrrrrrrrrrrrrrrrrrrrrrrrrrrrrrrrrrrrrrrrrrrrrrrrrrrrrrrrrrrrrrrrrrrrrrrrrrrrrrrrrrrrrrrrrrrrrrrrrrrrrrrrrrrrrrrrrrrrrrrrrrrrrrrrrrrrrrrrrrrrrrrrrrrrrrrrrrrrrrrrrrrrrrrrrrrrrrrrrrrrrrrrrrrrrrrrrrrrrrrrrrrrrrrrrrrrrrrrrrrrrrrrrrrrrrrrrrrrrrrrrrrrrrrrrrrrrrrrrrrrrrrrrrrrrrrrrrrrrrrrrrrrrrrrrrrrrrrrrrrrrrrrrrrrrrrrrrrrrrrrrrrrrrrrrrrrrrrrrrrrrrrrrrrrrrrrrrrrrrrrrrrrrrrrrrrrrrrrrrrrrrrrrrrrrrrrrrrrrrrrrrrrrrrrrrrrrrrrrrrrrrrrrrrrrrrrrrrrrrr
Ozone
Ozone
Tracer
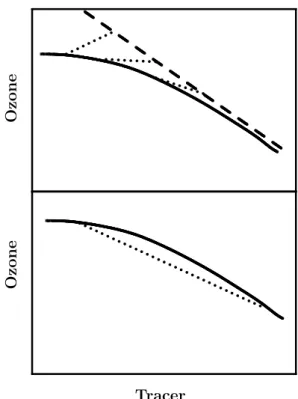
Fig. 1. Schematic view of the impact of mixing on high-latitude
tracer relationships. The solid line indicates a vortex ozone-tracer relation, the dashed line a mid-latitude ozone-ozone-tracer relation, the dotted lines show possible mixing lines. Top panel shows the conditions for mixing across the vortex edge on isentropes. Note that there is a substantial difference in tracer mixing ratio between vortex and mid-latitude air masses on the same potential tempera-ture level caused by the descent in the polar vortex. Bottom panel shows the conditions for mixing between two air parcels charac-terised by the same ozone-tracer relation.
The validity of these hypotheses has been debated and the question was raised whether mixing across the vortex edge changes the ozone-tracer relation in a way that leads to an overestimate or an underestimate of ozone loss (e.g., Michelsen et al., 1998; Plumb et al., 2000; M¨uller et al., 2001; Salawitch et al., 2002; Rex et al., 2002; Sankey and Shepherd, 2003; Tilmes et al., 2003b, 2004). Indeed, the im-pact of mixing on tracer-tracer relationships was neglected in early studies using the TRAC methodology (e.g., M¨uller et al., 1996, 1997). However, over the course of winter and spring, the vortex air mass will be influenced to a certain
ex-tent by mixing-in of air from outside the vortex. Inside and outside vortex air is characterised by different ozone-tracer relationships, with the outside vortex relationships showing greater ozone mixing ratios (and a stronger variability) for equal values of the tracer than inside relationships (e.g., Prof-fitt et al., 1990; M¨uller et al., 1999, 2002; Jost et al., 2002; Tilmes et al., 2003b). Therefore, if mixing occurs between air masses inside and outside of the vortex, it will lead to points lying along the dotted mixing lines and thus above the original ozone-tracer relation in the vortex (Fig.1, top panel). In contrast, mixing between two air masses that correspond to different points on the same non-linear, compact ozone-tracer relation, results in points that fall below the compact relation (Fig.1, bottom panel).
Moreover, differential descent with subsequent mixing within the vortex impacts tracer-tracer relations. Although Ray et al. (2002) and Salawitch et al. (2002) conclude that the effect of differential descent increased the uncertainty of col-umn ozone loss estimates by not more than ≈3-4% in Arctic winter 1999-2000, this mechanism could potentially have an influence on ozone loss estimates deduced using tracer-tracer relations.
Here, we revisit the question of the validity of the two ma-jor hypotheses that the TRAC methodology is based on. We consider the question of the compactness of the ozone-tracer relation in the ‘early’ polar vortex. Further, we discuss the impact of mixing across polar vortex edge on ozone loss es-timates deduced using tracer-tracer relations and extend the discussion to the related issue of differential descent within the vortex. Finally, we examine the representation of ozone-tracer relations in a variety of models. We conclude that, if applied with care, ozone-tracer relations constitute a reliable tool for the quantitative determination of chemical ozone loss in the polar vortex.
2 Reference ozone-tracer relations in the ‘early’ polar vortex
2.1 Reference relations constructed from mixing lines Michelsen et al. (1998) analysed ATMOS observations of ozone and N2O in the Arctic in March/April 1993. By considering the O3/N2O relationship they find that, on the same N2O level, much lower (≈50-60%) ozone mixing ra-tios are observed inside compared to outside of the polar vor-tex. Michelsen et al. (1998) interpret this difference between the out-of-vortex reference (blue line in Fig. 2) and the mea-surements inside the vortex as a signature of chemical ozone loss, but emphasise that chemical effects are unlikely to ac-count for the entire difference. They also construct an al-ternative reference for the O3/N2O relation (the yellow line in their plate 4a, also shown in Fig. 2). This reference rela-tion is constructed as a mixing line for a single mixing event (Fig. 1, bottom panel) and is derived considering mixing in
Atmos. Chem. Phys., 0000, 0001–15, 2005 www.atmos-chem-phys.org/acp/0000/0001/
Fig. 1. Schematic view of the impact of mixing on high-latitude tracer relationships. The solid line indicates a vortex ozone-tracer relation, the dashed line a mid-latitude ozone-ozone-tracer relation, the dotted lines show possible mixing lines. Top panel shows the conditions for mixing across the vortex edge on isentropes. Note that there is a substantial difference in tracer mixing ratio between vortex and mid-latitude air masses on the same potential tempera-ture level caused by the descent in the polar vortex. Bottom panel shows the conditions for mixing between two air parcels charac-terised by the same ozone-tracer relation.
vortex hinges on two hypotheses: First, that a compact ozone-tracer relation is established in the ‘early’ polar vor-tex, i.e., before the onset of chemical ozone loss. Second, that any change of the ozone-tracer relation in the vortex over the course of winter is caused predominantly by chemical ozone loss.
The validity of these hypotheses has been debated and the question was raised whether mixing across the vortex edge changes the ozone-tracer relation in a way that leads to an overestimate or an underestimate of ozone loss (e.g., Michelsen et al., 1998; Plumb et al., 2000; M¨uller et al., 2001; Salawitch et al., 2002; Rex et al., 2002; Sankey and Shepherd, 2003; Tilmes et al., 2003b, 2004). Indeed, the im-pact of mixing on tracer-tracer relationships was neglected in early studies using the TRAC methodology (e.g., M¨uller et al., 1996, 1997). However, over the course of winter and spring, the vortex air mass will be influenced to a certain ex-tent by mixing in of air from outside the vortex. Inside and outside vortex air is characterised by different ozone-tracer relationships, with the outside vortex relationships showing
greater ozone mixing ratios (and a stronger variability) for the same values of the tracer than inside relationships (e.g., Proffitt et al., 1990; M¨uller et al., 1999, 2002; Jost et al., 2002; Tilmes et al., 2003b). Therefore, if mixing occurs be-tween air masses inside and outside the vortex, it will lead to points lying along the dotted mixing lines and thus above the original ozone-tracer relation in the vortex (Fig. 1, top panel). In contrast, mixing between two air masses that correspond to different points on the same non-linear, compact ozone-tracer relation results in points that fall below the compact relation (Fig. 1, bottom panel).
Moreover, differential descent with subsequent mixing within the vortex impacts tracer-tracer relations. Although Ray et al. (2002) and Salawitch et al. (2002) conclude that the effect of differential descent increases the uncertainty of col-umn ozone loss estimates by no more than ≈3–4% in Arctic winter 1999–2000, this mechanism could potentially have an influence on ozone loss estimates deduced using tracer-tracer relations.
Here, we revisit the question of the validity of the two ma-jor hypotheses on which the TRAC methodology is based. We consider the question of the compactness of the ozone-tracer relation in the ‘early’ polar vortex. Further, we discuss the impact of mixing across the polar vortex edge on ozone loss estimates deduced using tracer-tracer relations and ex-tend the discussion to the related issue of differential descent within the vortex. Finally, we examine the representation of ozone-tracer relations in a variety of models. We conclude that, if applied with care, ozone-tracer relations constitute a reliable tool for the quantitative determination of chemical ozone loss in the polar vortex.
2 Reference ozone-tracer relations in the ‘early’ polar
vortex
2.1 Reference relations constructed from mixing lines
Michelsen et al. (1998) analysed ATMOS observations of ozone and N2O in the Arctic in March/April 1993. By considering the O3/N2O relationship they find that, on the same N2O level, much lower (≈50–60%) ozone mixing ra-tios are observed inside compared to outside the polar vor-tex. Michelsen et al. (1998) interpret this difference between the out-of-vortex reference (blue line in Fig. 2) and the mea-surements inside the vortex as a signature of chemical ozone loss, but emphasise that chemical effects are unlikely to ac-count for the entire difference. They also construct an al-ternative reference for the O3/N2O relation (the yellow line in their plate 4a, also shown in Fig. 2). This reference rela-tion is constructed as a mixing line for a single mixing event (Fig. 1, bottom panel) and is derived by considering mixing in the N2O/CH4 tracer space. However, it is unlikely that mixing of air between the two end-points of a mixing line that are separated by ≈25 km in altitude for an out-of-vortex
R. M¨uller et al.: Ozone/tracer relations in the polar vortex 3141
profile (Michelsen et al., 1998, Plate 3) occurred in reality. Thus, this line should only be seen as an approximation to a reference relation that would develop by continuous mixing. Comparing this reference with the March/April 1993 vor-tex observations from ATMOS, Michelsen et al. (1998) es-timate only half of the ozone deficit that they deduce from an out-of-vortex reference. This finding is sometimes erro-neously generalised to cases (e.g., M¨uller et al., 1996; Salaw-itch et al., 2002; Tilmes et al., 2004) where ozone-tracer rela-tionships in the late vortex are compared with an ‘early vor-tex’ reference (that is, a reference derived from observations made inside the vortex at a time before chemical ozone loss occurs) to deduce chemical ozone loss. Out-of-vortex ozone-tracer relations are characterised by greater ozone mixing ratios for a given tracer value than vortex relations (Proffitt et al., 1993; M¨uller et al., 2001; Tilmes et al., 2004). There-fore, it is incorrect to interpret the finding of Michelsen et al. (1998) as ‘mixing could produce about half the changes in the O3/N2O relation’ (Plumb et al., 2000).
In Fig. 2, we compare the out-of-vortex measurements from ATMOS in April 1993 (blue line), the Michelsen et al. (1998) ‘mixing reference’ (the yellow line in their plate 4a shown here again as a yellow line) and the early vor-tex reference derived from HALOE early vorvor-tex measure-ments in 1992 (Tilmes et al., 2004, black line). Obviously, the latter reference and the best reference (yellow line) sug-gested by Michelsen et al. (1998) are in reasonable agree-ment. Certainly, they are closer to each other than any of the lines to the out-of-vortex ATMOS measurements. There-fore, ozone loss estimates deduced from these two references will be rather similar. Using the early vortex reference from Tilmes et al. (2004) yields an ozone loss of 117±17 DU for April 1993 in the altitude range 380–550 K (corresponding to 1.4 ppm<CH4<0.5 ppm), whereas employing the ‘mixing line reference’ from Michelsen et al. (1998) yields an ozone loss of 98 DU, that is, only 16% less ozone loss than ob-tained from the Tilmes et al. (2004) reference. Nonetheless, long-range (in tracer space) mixing lines can only yield an approximation to the atmospheric conditions. Therefore, if used as reference relations for ozone loss estimates, mixing line references will be associated with a greater uncertainty than an early vortex reference deduced from measurements.
2.2 Representation of ozone-tracer reference relations in models
While classical two-dimensional models have been used in the past to study tracer-tracer relations (Plumb and Ko, 1992; Proffitt et al., 1992), today three-dimensional models are available for the simulation of transport and chemistry in the stratosphere. A particular advantage of three-dimensional models is that transport barriers in the stratosphere can be better represented than in two-dimensional models. The most important stratospheric transport barriers, the polar vortex edge and the subtropical barrier, are essential for the
forma-R. M¨uller: Ozone/tracer relations in the polar vortex 3
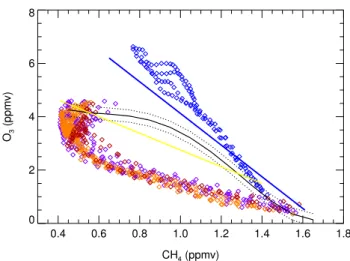
Fig. 2. Reference relations for the ozone-methane relation in the early vortex in winter 1992/93 from HALOE (Russell et al., 1993) and
ATMOS (Michelsen et al., 1998). The black line shows the reference relation deduced from HALOE measurements in November 1992 in the early vortex, the dotted lines give the range of uncertainty (Tilmes et al., 2004). The yellow line shows the ‘mixing line’ reference estimated
by Michelsen et al. (1998) based on ATMOS measurements, the solid blue line shows the out-of-vortex, high latitude (63◦N-69◦N), reference
based on ATMOS measurements from 8.-16. 4. 1993 (Michelsen et al., 1998). The ATMOS relations were converted from a N2O/O3relation
to a CH4/O3relation using the reported ATMOS CH4/N2O relation (Michelsen et al., 1998). Further shown are HALOE measurements
inside the vortex in late March (purple diamonds), early April (orange diamonds), and late April 1993 (red diamonds). The blue diamonds indicate HALOE measurements in April 1993 in high latitudes outside the vortex.
the N2O/CH4tracer space. However, it is unlikely that mix-ing of air between the two end-points of a mixmix-ing line that are separated by ≈25 km in altitude for an out-of-vortex profile (Michelsen et al., 1998, Plate 3) occurred in reality. Thus, this line should only be seen as an approximation to a refer-ence relation that would develop by continuous mixing.
Comparing this reference with the March/April 1993 vor-tex observations from ATMOS, Michelsen et al. (1998) de-duce only half of the ozone deficit that they dede-duce from an out-of-vortex reference. This finding is sometimes erro-neously generalised to cases (e.g., M¨uller et al., 1996; Salaw-itch et al., 2002; Tilmes et al., 2004) where ozone-tracer re-lationships in the late vortex are compared with an early vor-tex reference (that is, a reference derived from observations made inside the vortex, at a time before chemical ozone loss occurs) to deduce chemical ozone loss. Out-of-vortex ozone-tracer relations are characterised by greater ozone mixing ratios for a given tracer value than vortex relations (Proffitt
et al., 1993; M¨uller et al., 2001; Tilmes et al., 2004). There-fore, it is incorrect to interpret the finding of Michelsen et al. (1998) as “mixing could produce about half the changes in the O3/N2O relation” (Plumb et al., 2000).
In Fig. 2, we compare the out-of-vortex measurements from ATMOS in April 1993 (blue line), the Michelsen et al. (1998) ‘mixing reference’ (the yellow line in their plate 4a shown here again as a yellow line) and the early vortex ref-erence derived from HALOE early vortex measurements in 1992 (Tilmes et al., 2004, black line). Obviously, the latter reference and the best reference (yellow line) suggested by Michelsen et al. (1998) are in reasonable agreement. Cer-tainly, they are closer to each other than any of them to the out-of-vortex ATMOS measurements. Therefore, ozone loss estimates deduced from these two references will be rather similar. Using the early vortex reference from Tilmes et al. (2004) yields an ozone loss of 117 ± 17 DU for April 1993 in the altitude range 380-550 K (corresponding to 1.4 ppm <
www.atmos-chem-phys.org/acp/0000/0001/ Atmos. Chem. Phys., 0000, 0001–15, 2005 Fig. 2. Reference relations for the ozone-methane relation in the early vortex in winter 1992/93 from HALOE (Russell et al., 1993) and ATMOS (Michelsen et al., 1998). The black line shows the ref-erence relation deduced from HALOE measurements in November 1992 in the early vortex, the dotted lines give the range of uncer-tainty (Tilmes et al., 2004). The yellow line shows the ‘mixing line’ reference estimated by Michelsen et al. (1998) based on ATMOS measurements, the solid blue line shows the out-of-vortex, high-latitude (63◦N–69◦N), reference based on ATMOS measurements from 8–16 April 1993 (Michelsen et al., 1998). The ATMOS rela-tions were converted from a N2O/O3relation to a CH4/O3relation
using the reported ATMOS CH4/N2O relation (Michelsen et al., 1998). Further shown are HALOE measurements inside the vortex in late March (purple diamonds), early April (orange diamonds), and late April 1993 (red diamonds). The blue diamonds indicate HALOE measurements in April 1993 in high latitudes outside the vortex.
tion of different compact tracer-tracer relations in the strato-sphere (e.g., Michelsen et al., 1998; Plumb, 2002; Proffitt et al., 2003).
Nevertheless, even state-of-the-art three-dimensional models will misrepresent transport, and thus tracer-tracer re-lations, in some way. Depending on the numerical advection scheme employed, transport errors are introduced through numerical diffusion and dispersion (e.g., Rood, 1987; M¨uller, 1992). Dispersion errors that arise particularly strongly in centred difference and in spectral schemes, may lead to spuri-ous scatter in simulations of nonlinear tracer-tracer relation-ships (Thuburn and McIntyre, 1997).
2.2.1 Three-dimensional Chemistry Climate Models
Recently, Sankey and Shepherd (2003) presented a thorough investigation of tracer relations in the stratosphere using the Canadian Middle Atmosphere Model (CMAM); they used a number of observed tracer-tracer relations to validate the model results. The model uses a (T32) spectral transport scheme with 50 layers in the vertical and a ≈3 km vertical resolution in the middle atmosphere. The vertical diffusion
3142 R. M¨uller et al.: Ozone/tracer relations in the polar vortex
R. M¨uller: Ozone/tracer relations in the polar vortex 5
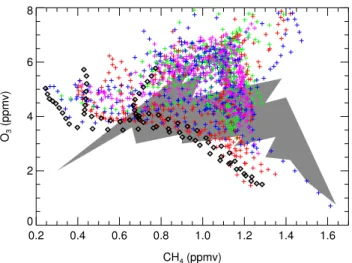
Fig. 3. The ozone-methane relation in the Northern hemisphere in January 1992. Shown are HALOE observations for the altitude range
10-100 hPa for the period 10 to 14 January 1992. The observations were made at equivalent latitudes of 25◦-40◦N (purple symbols), 40◦
-50◦N (green symbols), 50◦-60◦N (blue symbols), 60◦-65◦N (red symbols). The black diamonds are observations inside the polar vortex
according to the potential vorticity criterion of Tilmes (2004). The grey shaded area shows the range of CMAM model results for the vortex in a simulated January (Sankey and Shepherd, 2003). (The vortex is defined for the model results as potential vorticity greater than 400 PVU at 10 hPa).
we consider the actual HALOE measurements in mid Jan-uary 1992 (Fig. 3) colour-coded according to equivalent lati-tude. Based on the selection criteria of Tilmes et al. (2004), three HALOE measurements (black symbols in Fig. 3) are located in the polar vortex in January 1992. These profiles show a rather compact O3/CH4relation, clearly more com-pact than the CMAM relation at the location of the HALOE measurements. Solely, the HALOE measurements at top al-titudes show characteristics of outside vortex air. The ob-served O3/CH4relation for outside vortex, mid-latitude air shows considerable scatter, but always greater ozone values for a given tracer mixing ratio than the vortex air.
Further, measurements of the ILAS instrument (Sasano et al., 1999) which provides a good coverage of the polar area in winter 1996-97 demonstrate that a compact ozone-tracer relation develops in the Arctic vortex which is clearly sepa-rated from the out-of-vortex relation (Tilmes et al., 2003b). The ILAS Arctic vortex measurements show no indication of a variability of the ozone-tracer relation resembling that in the CMAM model vortex. Also, HALOE measurements
of the early spring vortex in years when HALOE provides a good coverage of the polar area (e.g., early April 1992, 1995, 1996) show compact relations of both HCl and ozone with long-lived tracers (M¨uller et al., 1996; Tilmes et al., 2004).
In summary, the lack of a compact O3/CH4relationship in the CMAM1Arctic vortex could be leading to the conclu-sion that apparently compact correlations in the vortex may result from insufficient sampling of the vortex air-mass when in reality no compact relation exits (Sankey and Shepherd, 2003). However, there is no evidence from measurements in the polar regions that such a problem occurs in reality.
www.atmos-chem-phys.org/acp/0000/0001/ Atmos. Chem. Phys., 0000, 0001–15, 2005 Fig. 3. The ozone-methane relation in the Northern hemisphere in January 1992. Shown are HALOE observations for the altitude range 10–100 hPa for the period 10 to 14 January 1992. The ob-servations were made at equivalent latitudes of 25◦–40◦N (purple symbols), 40◦–50◦N (green symbols), 50◦–60◦N (blue symbols), 60◦–65◦N (red symbols). The black diamonds are observations in-side the polar vortex according to the potential vorticity criterion of Tilmes (2004). The grey shaded area shows the range of CMAM model results for the vortex in a simulated January (Sankey and Shepherd, 2003). (The vortex is defined for the model results as potential vorticity greater than 400 PVU at 10 hPa).
coefficient Kzzis set to 1 m2s−1. In the model simulations,
distinct tracer-tracer relations develop in the tropics, the mid-latitude surf zone, and in the Antarctic winter vortex in ac-cordance with observations (e.g., Michelsen et al., 1998; Ray et al., 2002; Proffitt et al., 2003) and with the theoretical ar-guments of Plumb (2002).
However, the model is incapable of producing a strong po-lar vortex in the Arctic: ‘there is virtually no barrier at all in the CMAM Arctic vortex’ (Sankey and Shepherd, 2003). A transport barrier at the Arctic vortex edge (together with rapid mixing within the vortex) is the reason why compact tracer-tracer relations develop inside the polar vortex that are distinct from the tracer-tracer relations outside the vor-tex (e.g., Plumb, 2002). The segregation between compact tracer-tracer relationships inside and outside the vortex has been observed on many occasions (e.g., Proffitt et al., 1993; Michelsen et al., 1998; M¨uller et al., 1999; Ray et al., 2002; Tilmes et al., 2003b).
The formation of such a segregation of tracer-tracer rela-tionships and the existence of a transport barrier at the edge of the Arctic vortex are the central assumptions for applying tracer-tracer relations to deduce chemical ozone loss inside the vortex (e.g., M¨uller et al., 1996; Tilmes, 2004). In the CMAM model, for Arctic conditions, these assumptions are not valid due to the the lack of a transport barrier at the edge of the Arctic vortex in CMAM. Consequently, by means of tracer-tracer relations it is not possible to deduce chemical
ozone loss in the Arctic using CMAM results (Sankey and Shepherd, 2003). In the CMAM Antarctic vortex, for which a transport barrier is simulated, a compact ozone-tracer rela-tion develops in the model. In CMAM it takes months for the compact correlation to develop; a truly compact correlation is established in August. A recent analysis of ILAS II measure-ments in Antarctic winter 2003 indicates that a compact rela-tion had developed by the end of June (Tilmes et al., 2005b) (Tilmes et al., 2005a1). The fact that the simulated ozone-tracer relation in the Antarctic vortex in CMAM does not resemble measurements by HALOE, ATMOS, and ILAS II (M¨uller et al., 1996; Michelsen et al., 1998; Tilmes et al., 2005b) is most likely due to an underestimate of halogen-catalysed ozone depletion in the CMAM Antarctic vortex.
Sankey and Shepherd (2003) raised the question whether, given limited observations at a particular latitude, one could be under the false impression that a compact ozone-tracer re-lation exists, when in reality this is not the case. To illustrate their point, they consider (their Fig. 19) CMAM data for the O3/CH4relation inside the polar vortex for 1 January. (The vortex being defined as a column of air with potential vortic-ity greater than 400 PVU at 10 hPa, D. Sankey, pers. comm.). The CMAM model vortex is then sampled at the actual lo-cations of HALOE measurements in January 1992. Due to the HALOE measurement geometry, these measurement locations rarely intercept the CMAM vortex. The CMAM O3/CH4values at the HALOE measurement locations form a compact relation for CH4 lower than ≈1.3 ppm; for CH4 greater than ≈1.3 ppm, the CMAM O3values at the HALOE measurement locations show some scatter, albeit less scatter than all the CMAM vortex model points (Sankey and Shep-herd, 2003). That is, if the real atmosphere were as simulated by CMAM, and had HALOE observed that model atmo-sphere during January 1992 the apparent correlation would have been the result of insufficient sampling. This thought experiment indicates the possible existence of a problem (Sankey and Shepherd, 2003).
To address the question whether such a problem might ex-ist for conditions in the early polar vortex in the Arctic, we consider the actual HALOE measurements in mid-January 1992 (Fig. 3) colour-coded according to equivalent latitude. Based on the selection criteria of Tilmes et al. (2004), three HALOE measurements (black symbols in Fig. 3) are lo-cated in the polar vortex in January 1992. These profiles show a rather compact O3/CH4relation, clearly more com-pact than the CMAM relation at the location of the HALOE measurements. Solely the HALOE measurements at top al-titudes show characteristics of outside-vortex air. The ob-served O3/CH4 relation for outside-vortex, mid-latitude air
1Tilmes, S., M¨uller, R., Grooß, J.-U., Nakajima, H., and Sasano,
Y.: Development of tracer relations and chemical ozone loss during the setup phase of the polar vortex, J. Geophys. Res., submitted, 2005a.
R. M¨uller et al.: Ozone/tracer relations in the polar vortex 3143
shows considerable scatter, but always greater ozone values for a given tracer mixing ratio than the vortex air.
Further, measurements of the ILAS instrument (Sasano et al., 1999), which provides good coverage of the polar area in winter 1996–1997, demonstrate that a compact ozone-tracer relation develops in the Arctic vortex which is clearly separated from the out-of-vortex relation (Tilmes et al., 2003b). The ILAS Arctic vortex measurements show no in-dication of a variability of the ozone-tracer relation resem-bling that in the CMAM model vortex. Also, HALOE mea-surements of the early spring vortex in years when HALOE provides good coverage of the polar area (e.g., early April 1992, 1995, 1996) show compact relations of both HCl and ozone with long-lived tracers (M¨uller et al., 1996; Tilmes et al., 2004).
In summary, the lack of a compact O3/CH4relationship in the CMAM2Arctic vortex could lead to the conclusion that compact correlations in the vortex may be deluded by insuffi-cient sampling of the vortex air mass when in reality no such compact relation exits (Sankey and Shepherd, 2003). How-ever, there is no evidence from measurements in the polar regions that such a problem occurs in reality.
2.2.2 Three-dimensional chemistry transport models
In the Chemical Lagrangian Model of the Stratosphere (CLaMS), advection and mixing are represented in a way that is very different from the transport schemes employed in Eulerian models. The mixing intensity in CLaMS can be controlled and is anisotropic in space and time (McKenna et al., 2002b; Konopka et al., 2004, 2005b). Due to these fea-tures, transport barriers can be represented particularly well in CLaMS.
For Arctic winter 2002/2003, Konopka et al. (2005c)3 cal-culated the development over the course of the winter of pas-sive ozone (Opass3 ) and CH4, both treated as purely transport quantities. The probability distribution function (PDF) for Opass3 and CH4on 11 January 2003 shows that a clear sepa-ration between mid-latitude and vortex air masses develops in the model (Fig. 4). The figure shows all CLaMS model points poleward of an equivalent latitude of 40◦N between the 350 K and 700 K isentropes.
2Here shortcomings of the CMAM model are discussed that
be-come apparent when the CMAM model results are compared in de-tail with measurements. The aim of this discussion is not to point to any particular weakness of the CMAM model; rather Sankey and Shepherd (2003) should be commended for conducting such a de-tailed comparison of results from a general circulation model with measurements.
3Konopka, P., Engel, A., Funke, B., M¨uller, R., Grooß, J.-U.,
G¨unther, G., Wetter, T., Stiller, G., von Clarmann, T., Oelhaf, N. G. H., Wetzel, G., L´opez-Puertas, M., Pirre, M., Huret, N., and Riese, M.: Ozone loss driven by nitrogen oxides and triggered by stratospheric warmings may outweigh the effect of halogens, Geo-phys. Res. Lett., submitted, 2005c.
6 R. M¨uller: Ozone/tracer relations in the polar vortex
0.4 0.6 0.8 1.0 1.2 1.4 1.6 1.8 CH4 (ppmv) 0 2 4 6 8 O3 (ppmv) 0.4 0.6 0.8 1.0 1.2 1.4 1.6 1.8 CH4 (ppmv) 0 2 4 6 8 O3 (ppmv) 3.00 0.01 0.03 0.05 0.07 0.10 0.30 0.50 0.70 1.00 3.00 PDF (%) 450 K 500 K 550 K 600 K 650 K 700 K 11.01.2003
Fig. 4. The relation of passive ozone (Opass
3 ) and CH4on 11 January 2003 from model simulations (Konopka et al., 2005a) of the Chemical
Lagrangian Model of the Stratosphere (CLaMS). Shown are all CLaMS model points poleward of an equivalent latitude of 40◦N between
the 350 K and 700 K isentropes. The colour scale shows the probability distribution function (PDF) of Opass
3 and CH4; reference relations for vortex air and midlatitude air are shown as thick grey lines. For comparison, an early vortex reference relation (Tilmes et al., 2003a) deduced from MkIV measurements on 16 December 2002 is also shown (black dashed-dotted line). Also shown are approximate isolines of selected potential temperature levels. PDFs and potential temperature isolines were calculated for Opass
3 and CH4bin sizes of 0.05 ppmv and 0.25
ppmv, respectively.
2.2.2 Three-dimensional chemistry transport models
In the Chemical Lagrangian Model of the Stratosphere (CLaMS), advection and mixing are represented in a way that is very different from the transport schemes employed in Eu-lerian models. The mixing intensity in CLaMS can be con-trolled and is anisotropic in space and time (McKenna et al., 2002b; Konopka et al., 2004, 2005c). Owing to these
fea-1Here several shortcomings of the CMAM model are being
dis-cussed that become apparent, when the CMAM model results are compared in detail with measurements. The aim of this discussion is not to point to any particular weakness of the CMAM model; rather Sankey and Shepherd (2003) should be commended for con-ducting such a rather detailed comparison of results from a general circulation model with measurements.
tures, transport barriers can be represented particularly well in CLaMS.
For Arctic winter 2002/2003, Konopka et al. (2005a) cal-culated the development over the course of the winter of
pas-sive ozone (Opass3 ) and CH4, both treated as pure transport
quantities. The probability distribution function (PDF) for
Opass
3 and CH4on 11 January 2003 shows that a clear
sepa-ration between mid-latitude and vortex air masses develops in the model (Fig. 4); shown are all CLaMS model points
poleward of an equivalent latitude of 40◦N between the 350
K and 700 K isentropes.
These CLaMS results suggest that in early January a trans-port barrier has formed in the model at the edge of the po-lar vortex leading to a separation between inside and outside tracer relations. Further, by that time, mixing within the
vor-Atmos. Chem. Phys., 0000, 0001–15, 2005 www.atmos-chem-phys.org/acp/0000/0001/
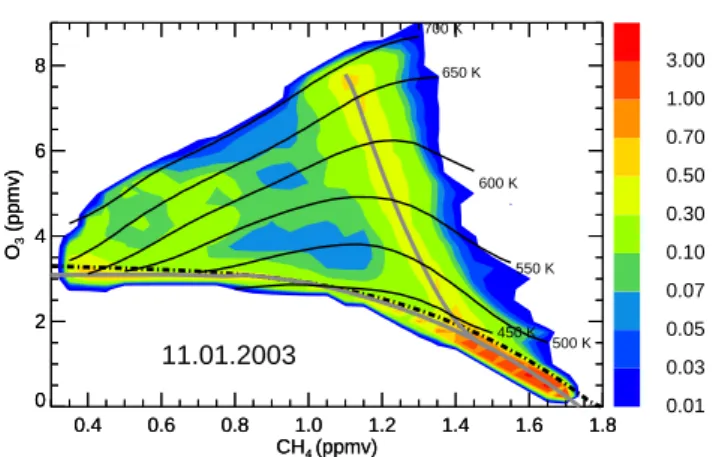
Fig. 4. The relation of passive ozone (Opass3 ) and CH4on 11
Jan-uary 2003 from model simulations (Konopka et al., 2005c3) of the Chemical Lagrangian Model of the Stratosphere (CLaMS). Shown are all CLaMS model points poleward of an equivalent latitude of 40◦N between the 350 K and 700 K isentropes. The colour scale shows the probability distribution function (PDF) of Opass3 and CH4; reference relations for vortex air and midlatitude air are shown
as thick grey lines. For comparison, an early vortex reference rela-tion (Tilmes et al., 2003a) deduced from MkIV measurements on 16 December 2002 is also shown (black dashed-dotted line). Also shown are approximate isolines of selected potential temperature levels. PDFs and potential temperature isolines were calculated for Opass3 and CH4bin sizes of 0.05 ppmv and 0.25 ppmv, respectively.
These CLaMS results suggest that in early January a trans-port barrier has formed in the model at the edge of the po-lar vortex leading to a separation between inside and outside tracer relations. Further, by that time, mixing within the vor-tex has homogenised the vorvor-tex air mass resulting in a com-pact ozone-tracer relation in the vortex.
The ozone-tracer relation in Eulerian chemical transport models has not been studied extensively. However, its has been shown that compact tracer-tracer relations can be sim-ulated for the polar vortex by Eulerian chemical transport models (Plumb et al., 2000). Recently (Robinson et al., 2005) reported simulations with the SLIMCAT model, showing compact ozone/CFC-11 relations in agreement with balloon-borne measurements.
3 Impact of mixing on ozone-tracer relationships in the
polar vortex
3.1 Impact of differential descent on tracer relations
Differential descent of air masses within an otherwise iso-lated polar vortex may impact non-linear tracer-tracer rela-tions for the vortex (Ray et al., 2002; Salawitch et al., 2002). Potentially, this mechanism could have an influence on ozone loss estimates deduced using tracer-tracer relations.
3144 R. M¨uller et al.: Ozone/tracer relations in the polar vortex
R. M¨uller: Ozone/tracer relations in the polar vortex 7
tex has homogenised the vortex air mass resulting in a com-pact ozone-tracer relation in the vortex.
The ozone-tracer relation in Eulerian chemical transport models has not been studied extensively. However, its has been shown that compact tracer-tracer relations can be sim-ulated for the polar vortex by Eulerian chemical transport models (Plumb et al., 2000). Recently (Robinson et al., 2005) reported simulations with the SLIMCAT model, showing compact ozone/CFC-11 relations in agreement with balloon-borne measurements.
3 The impact of mixing on ozone-tracer relationships in
the polar vortex
3.1 Impact of differential descent on tracer relations
Differential descent of air-masses within an otherwise iso-lated polar vortex may impact non-linear tracer-tracer rela-tions for the vortex (Ray et al., 2002; Salawitch et al., 2002). Potentially, this mechanism could have an influence on ozone loss estimates deduced using tracer-tracer relations.
Initial Correlation 0 100 200 300 400 N2O (ppb) 0 1 2 3 4 Ozone (ppm)
Time Loop Plot
0 50 100 150 200 250 N2O (ppb) 1.0 1.5 2.0 2.5 3.0 3.5 4.0 4.5 Ozone (ppm)
Fig. 5. The impact of differential descent on the O3/N2O relation in the vortex from an idealised calculation. The black solid line shows the initial O3/N2O relation, the red line the O3/N2O relation after 20 iterations of differential descent. It is assumed that one third of the vortex air mass is descending twice as much as the rest of the vortex air mass, followed by instantaneous horizontal mixing (see text for details). The green dotted lines show the gradual change of the O3/N2O relation with each timestep.
Here, we conduct a rather simple calculation to assess the impact of differential descent on ozone-tracer relationships in the polar vortex. We consider idealised conditions: the vortex is described by a single column of air; the vertical co-ordinate being potential temperature θ . In a given timestep
∆t the main vortex air mass is descending by∆θ , with a
frac-tion α of the vortex air mass assumed to be descending
(un-mixed) by δ∆θ with δ > 1. The vortex airmass is then
as-sumed to be immediately homogenised by horizontal mixing. This procedure is repeated n times with the intention to ap-proximately describe the development of the vortex over a winter season.
For the vortex air mass typical vertical profiles of ozone and N2O are prescribed as initial conditions, resulting in an
initial O3/N2O relation in the polar vortex (black solid line
in Fig. 5). The change of this initial O3/N2O relation due
to the action of differential descent and subsequent mixing in the vortex can then be followed. In Fig. 5, this change is shown for a rather extreme case, where∆θ = 5 K, α = 0.33, δ = 2 (that is, one third of the vortex air mass is descending
twice as much as the remaining two thirds) and the number of timesteps n = 20. Obviously, even for such conditions, the O3/N2O relation is affected rather little by the effect of
differential descent.
Ozone-tracer relations were used for calculating a proxy ozone profile from a tracer profile in late winter, early spring. If the two relations shown in Fig. 5 are used to deduce proxy ozone profiles from a late winter vortex tracer profile charac-terised by vertical descent, the column ozone corresponding to these profiles differs by only ≈ 2.5 DU. In a scenario that is perhaps a bit more realistic, where∆θ = 2 K, α = 0.33, δ = 1.5 and the number of timesteps n = 50, the
correspond-ing difference in column ozone is less than 1 DU; the maxi-mum change of ozone for a given tracer value due to differ-ential descent and subsequent mixing under these conditions is ≈ 50 ppb.
This means that the contribution of the effect of differen-tial descent to the overall uncertainty in the deduced chemical loss will be small. Given the magnitude of other sources of uncertainty, the contribution from differential descent is very likely to be insignificant. This finding corroborates conclu-sions of Ray et al. (2002) and Salawitch et al. (2002) who report, based on balloon measurements in winter 1999-2000, that the effect of differential descent increased the uncer-tainty of column ozone loss estimates by ≈3-4%.
3.2 Impact of cross vortex edge mixing on ozone-tracer re-lations in the polar vortex
Mixing across the vortex edge is usually non-local in tracer-tracer space and thus has the potential to alter tracer-tracer-tracer-tracer re-lations. The ozone-tracer relation shows greater ozone mix-ing ratios outside of the vortex than inside (e.g., Proffitt et al., 1993; M¨uller et al., 2001; Rex et al., 2002; Jost et al., 2002; Tilmes et al., 2004), mixing lines connecting inside and out-side vortex air masses are thus expected to lie between the inside and the outside vortex ozone-tracer relation (Fig. 1, top panel).
www.atmos-chem-phys.org/acp/0000/0001/ Atmos. Chem. Phys., 0000, 0001–15, 2005 Fig. 5. The impact of differential descent on the O3/N2O relation in
the vortex from an idealised calculation. The black solid line shows the initial O3/N2O relation, the red line the O3/N2O relation after
20 iterations of differential descent. It is assumed that one third of the vortex air mass descends twice as much as the rest of the vortex air mass, followed by instantaneous horizontal mixing (see text for details). The green dotted lines show the gradual change of the O3/N2O relation with each timestep.
Here, we conduct a rather simple calculation to assess the impact of differential descent on ozone-tracer relationships in the polar vortex. We consider idealised conditions: the vortex is described by a single column of air and the vertical coordinate is the potential temperature θ . In a given timestep
1tthe main vortex air mass descends by 1θ , with a fraction
αof the vortex air mass assumed to be descending (unmixed) by δ1θ with δ>1. The vortex air mass is then assumed to be immediately homogenised by horizontal mixing. This proce-dure is repeated n times with the intention of approximately describing the development of the vortex over a winter sea-son.
For the vortex air mass typical vertical profiles of ozone and N2O are prescribed as initial conditions, resulting in an initial O3/N2O relation in the polar vortex (solid black line in Fig. 5). The change of this initial O3/N2O relation due to the action of differential descent and subsequent mixing in the vortex can then be followed. In Fig. 5, this change is shown for a rather extreme case, where 1θ =5 K, α=0.33, δ=2 (that is, one third of the vortex air mass descends twice as much as the remaining two thirds) and the number of timesteps n=20. Obviously, even for such conditions, the O3/N2O relation is little affected by the effect of differential descent.
Ozone-tracer relations are used for calculating a proxy ozone profile from a tracer profile in late winter/early spring. If the two relations shown in Fig. 5 are used to deduce proxy ozone profiles from a late winter vortex tracer profile char-acterised by vertical descent, the column ozone correspond-ing to these profiles differs by only ≈2.5 DU. In a scenario
8 R. M¨uller: Ozone/tracer relations in the polar vortex
50 100 150 200 250 N2O (ppb) 1.0 1.5 2.0 2.5 3.0 3.5 O3 (ppm)
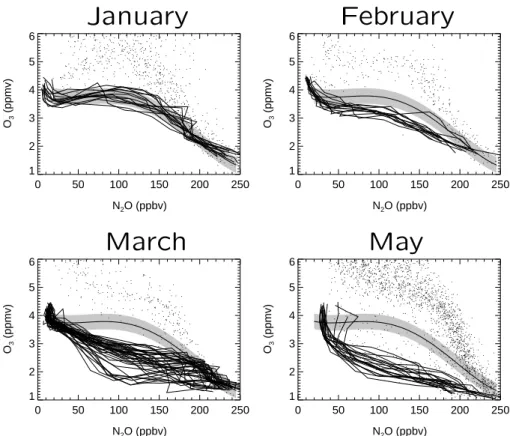
Fig. 6. The O3/N2O relation from measurements during winter 1999/2000. The large black squares show measurements of the MkIV instrument (Toon et al., 1999) on 3 December 1999. The coloured symbols show measurements of the NASA-ER2 aircraft on 23 January 2000 (green), 7 March 2000 (blue), and 11 March 2000 (red). Ozone measurements were made with a UV-photometer (Proffitt and McLaughlin, 1983), the N2O measurements with the ALIAS (Webster et al., 1994, 23. 1.) and ARGUS (Loewenstein et al., 2002, 3. and 11. 3.) TDL instruments. Overplotted for comparison is the O3/N2O relation (small black symbols) based on N2O measurements by an in-situ gas chromatograph (Elkins et al., 1996) with a lesser temporal resolution.
3.2.1 Observations of mixing across the vortex edge
Rex et al. (2002) and Jost et al. (2002), based on high altitude aircraft measurements in the Arctic in early 2000, demon-strated that mixing across the vortex edge leads to an increase
in the mixing ratio of ozone for a given value of N2O.
Fur-ther, Rex et al. (2002) and Ray et al. (2002) emphasise that although in this winter mixing lines were observed, entrain-ment of extra-vortex air did not significantly alter the com-position of the vortex air between January and March 2000. Figure 6 shows an example of measurements of such mix-ing lines between vortex air, depleted in ozone, and outside-vortex air. The outside-vortex air is characterised on 23 January 2000 by ozone mixing ratios up to about 2.5 ppm (green symbols), on 7 March 2000 by ozone mixing ratios up to about 1.7 ppm (blue symbols), and on 11 March 2000 by ozone mixing ra-tios of about 1.2 ppm. Clearly noticeable are the mixing lines
towards air with greater ozone and greater N2O mixing
ra-tios, that is air of mid-latitude characteristics. Clearly, there is no evidence from the measurements of mixing lines on the
‘low ozone’ side of the O3/N2O relations.
When the transport barrier at the edge of the vortex is weak, mixing is expected to noticeably influence the
ozone-tracer relation inside the vortex. According to the arguments above, one expects ozone to increase for a given tracer mix-ing ratio. This effect was indeed observed by the ILAS in-strument in winter 1996-1997 (Tilmes et al., 2003b). In this winter, the vortex was perturbed by a stratospheric warming in early winter and therefore the vortex edge was permeable until late December. ILAS provided a good coverage of the Arctic polar region in winter 1996-1997 covering a latitude
range between 55◦-77◦N and measuring about fourteen
pro-files per day. These measurements show (see Fig. 7 in Tilmes et al., 2003b) that inside the vortex ozone increased at a given
N2O level in December (when the vortex was still relatively
weak) and that a compact O3/N2O relation was established
by early January (when a strong vortex had formed). In cases when a comprehensive set of tracer measurements is available, further insight on mixing under weak vortex con-ditions can be obtained. Considering relations of two long-lived tracers that are curved could be used to identify mixing. If both tracers are chosen so that they are not subject to chem-ical change over the timescale in question, as it is the case e.g.
for CFC-11/N2O, chemical change will not interfere with the
diagnosis of mixing.
Atmos. Chem. Phys., 0000, 0001–15, 2005 www.atmos-chem-phys.org/acp/0000/0001/
Fig. 6. The O3/N2O relation from measurements during winter 1999/2000. The large black squares show measurements of the MkIV instrument (Toon et al., 1999) on 3 December 1999. The coloured symbols show measurements of the NASA-ER2 aircraft on 23 January 2000 (green), 7 March 2000 (blue), and 11 March 2000 (red). Ozone measurements were made with a UV photometer (Proffitt and McLaughlin, 1983), the N2O measurements with the
ALIAS (Webster et al., 1994, 23 January) and ARGUS (Loewen-stein et al., 2002, 3 and 11 March) TDL instruments. Overplotted for comparison is the O3/N2O relation (small black symbols) based
on N2O measurements by an in-situ gas chromatograph (Elkins
et al., 1996) with a lower temporal resolution.
that is perhaps a bit more realistic, where 1θ =2 K, α=0.33,
δ=1.5 and the number of timesteps n=50, the correspond-ing difference in column ozone is less than 1 DU; the maxi-mum change of ozone for a given tracer value due to differ-ential descent and subsequent mixing under these conditions is ≈50 ppb.
This means that the contribution of the effect of differen-tial descent to the overall uncertainty in the deduced chemi-cal loss will be small. Given the magnitude of other sources of uncertainty, the contribution from differential descent is likely to be insignificant. This finding corroborates the con-clusions of Ray et al. (2002) and Salawitch et al. (2002), who report, based on balloon measurements in winter 1999– 2000, that the effect of differential descent increased the un-certainty of column ozone loss estimates by ≈3–4%.
3.2 Impact of cross-vortex-edge mixing on ozone-tracer re-lations in the polar vortex
Mixing across the vortex edge is usually non-local in tracer-tracer space and thus has the potential to alter tracer-tracer-tracer-tracer re-lations. The ozone-tracer relation shows greater ozone mix-ing ratios outside the vortex than inside (e.g., Proffitt et al., 1993; M¨uller et al., 2001; Rex et al., 2002; Jost et al., 2002; Tilmes et al., 2004). Mixing lines connecting inside- and outside-vortex air masses are thus expected to lie between
R. M¨uller et al.: Ozone/tracer relations in the polar vortex 3145
10 R. M¨uller: Ozone/tracer relations in the polar vortex
January
February
1−Jan−1997 to 8−Jan−1997 0 50 100 150 200 250 N2O (ppbv) 1 2 3 4 5 6 O3 (ppmv) Wed Nov 17 12:06:18 2004 /private/walter/hda6/simone/JUELICH/ILASV5/haloe_intern_set_plot.pro N2O_SCATTER/ilas_jan1_n2o_in_out_folien.ps 17−Feb−1997 to 21−Feb−1997 0 50 100 150 200 250 N2O (ppbv) 1 2 3 4 5 6 O3 (ppmv) Wed Nov 17 12:06:28 2004 /private/walter/hda6/simone/JUELICH/ILASV5/haloe_intern_set_plot.pro N2O_SCATTER/ilas_feb3_n2o_in_out_folien.psMarch
May
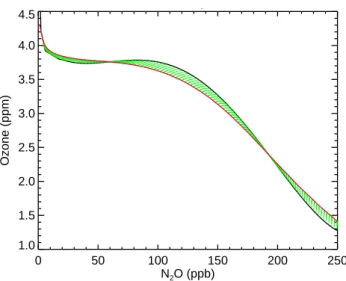
21−Mar−1997 to 31−Mar−1997 0 50 100 150 200 250 N2O (ppbv) 1 2 3 4 5 6 O3 (ppmv) Wed Nov 17 12:06:36 2004 /private/walter/hda6/simone/JUELICH/ILASV5/haloe_intern_set_plot.pro N2O_SCATTER/ilas_mar3_n2o_in_out_folien.ps 1−May−1997 to 15−May−1997 0 50 100 150 200 250 N2O (ppbv) 1 2 3 4 5 6 O3 (ppmv) Wed Nov 17 12:06:42 2004 /private/walter/hda6/simone/JUELICH/ILASV5/haloe_intern_set_plot.pro N2O_SCATTER/ilas_may1_n2o_in_out_folien.psFig. 7. The development of the O3/N2O relation in the Arctic in winter 1996/1997 based on ILAS measurements (Tilmes et al., 2003b).
Shown are four different time periods (January 1-15, February 17-21, March 21-31, May 1-15, 1997). Black lines indicate profiles measured inside the polar vortex core, defined using the Nash et al. (1996) criterion. Small black dots indicate measurements outside the polar vortex. Also shown is the early vortex reference relation (thick black line, Tilmes et al., 2003b) and its uncertainty (grey shaded area). The reference is deduced from the early January ILAS measurements.
Atmos. Chem. Phys., 0000, 0001–15, 2005 www.atmos-chem-phys.org/acp/0000/0001/ Fig. 7. The development of the O3/N2O relation in the Arctic in winter 1996/1997 based on ILAS measurements (Tilmes et al., 2003b).
Shown are four different time periods (1–15 January, 17–21 February, 21–31 March, 1–15 May 1997). Black lines indicate profiles measured inside the polar vortex core, defined using the Nash et al. (1996) criterion. Small black dots indicate measurements outside the polar vortex. Also shown is the early vortex reference relation (thick black line, Tilmes et al., 2003b) and its uncertainty (grey shaded area). The reference is deduced from the early January ILAS measurements.
the inside and the outside vortex ozone-tracer relation (Fig. 1, top panel).
3.2.1 Observations of mixing across the vortex edge
Based on high altitude aircraft measurements in the Arctic in early 2000, Rex et al. (2002) and Jost et al. (2002) demon-strated that mixing across the vortex edge leads to an increase in the mixing ratio of ozone for a given value of N2O. Fur-ther, Rex et al. (2002) and Ray et al. (2002) emphasise that although in this winter mixing lines were observed, entrain-ment of extra-vortex air did not significantly alter the com-position of the vortex air between January and March 2000. Figure 6 shows an example of measurements of such mix-ing lines between vortex air, depleted in ozone, and outside-vortex air. The outside-vortex air is characterised on 23 January 2000 by ozone mixing ratios up to about 2.5 ppm (green symbols), on 7 March 2000 by ozone mixing ratios up to about 1.7 ppm (blue symbols), and on 11 March 2000 by ozone mixing ra-tios of about 1.2 ppm. Clearly noticeable are the mixing lines towards air with greater ozone and greater N2O mixing ra-tios, that is air of mid-latitude characteristics. Clearly, there
is no evidence from the measurements of mixing lines on the ‘low ozone’ side of the O3/N2O relations.
When the transport barrier at the edge of the vortex is weak, mixing is expected to noticeably influence the ozone-tracer relation inside the vortex. According to the arguments above, one expects ozone to increase for a given tracer mix-ing ratio. This effect was indeed observed by the ILAS in-strument in winter 1996–1997 (Tilmes et al., 2003b). In this winter, the vortex was perturbed by a stratospheric warming in early winter and therefore the vortex edge was permeable until late December. ILAS provided good coverage of the Arctic polar region in winter 1996–1997 covering a latitude range between 55◦–77◦N and measuring about fourteen pro-files per day. These measurements show (see Fig. 7 in Tilmes et al., 2003b) that inside the vortex ozone increased at a given N2O level in December (when the vortex was still relatively weak) and that a compact O3/N2O relation was established by early January (when a strong vortex had formed).
In cases where a comprehensive set of tracer measure-ments is available, further insight on mixing under weak vor-tex conditions can be obtained. Considering relations of two long-lived tracers that are curved could be used to identify
3146 R. M¨uller et al.: Ozone/tracer relations in the polar vortex
mixing. If both tracers are chosen so that they are not subject to chemical change over the timescale in question as is the case for example with CFC-11/N2O, chemical change will not interfere with the diagnosis of mixing.
Mixing across the vortex edge is likewise important for es-tablishing the ozone tracer relation in the very early, incipient vortex. The air in high latitudes in autumn from which the polar vortex is formed, is characterised by low ozone mixing ratios, a remainder of summertime ozone loss. Because the transport barrier of the incipient vortex, while established, is still somewhat permeable, ozone-rich, mid-latitude air is mixed into the vortex. In this way, the ozone-tracer relation in the vortex recovers from summertime ozone loss. This process was first noted by Proffitt et al. (1992) and recently analysed in detail based on ILAS II measurements in the high latitudes of both hemispheres (Tilmes et al., 2005a1).
3.2.2 Cross-vortex-edge mixing in conceptual models
Plumb et al. (2000) presented a conceptual model, a sim-ple advective diffusive model in cylindrical geometry, to de-scribe the impact of mixing on tracer-tracer relations. Their model simulates the effect of mixing on the relationship of two artificial tracers χ1and χ2that are designed to resemble N2O and NOy. The relation of χ1and χ2is the same on both sides of a transport barrier that represents the vortex edge in the model. The typical time scale T for the model is the life-time of the vortex, say four months or ≈107s, and the typical horizontal length scale R is from the pole to the subtropical transport barrier, say ≈7·106m. The dimensionless diffu-sivity in the vortex edge region is chosen to be K=0.05 by Plumb et al. (2000). If this dimensionless diffusivity is con-verted to a dimensioned diffusivity D, where D=(K·R2)/T, one obtains D≈3·105m2s−1.
This value may be compared with effective atmo-spheric diffusivities deduced from aircraft measurements
Deff=5·103m2 s−1 (Waugh et al., 1997) or diffusivities (D=1.1·103m2 s−1) employed in the chemical transport model CLaMS for reproducing observed filamentary tracer structures at the polar vortex edge (Konopka et al., 2003a, 2005b). The diffusivities in the CLaMS model are the same for studies addressing rather different problems such as re-producing observed filamentary tracer structures (e.g., Khos-rawi et al., 2005; Konopka et al., 2005b) or simulating the stratospheric warming in the Antarctic in September 2002 (Konopka et al., 2005a). Note that the Eulerian parametrisa-tion of mixing in the model by Plumb et al. (2000) is different from the Lagrangian concept used in CLaMS, where the mix-ing intensity is proportional to the gradient of the wind rather than to the wind itself as is the case in Eulerian models.
That means, the cross vortex edge diffusivity is likely to be substantially greater in the Plumb et al. (2000) conceptual model than in the stratosphere. Therefore, conclusions based on the results of this conceptual model do not carry over di-rectly to stratospheric conditions. A further caveat for the
application of conclusions from this conceptual model to the behaviour of ozone-tracer relations in the stratospheric polar vortex is that Plumb et al. (2000) assume the same tracer-tracer relation inside and outside the vortex; an assumption that is not valid for the ozone-tracer relation in the polar re-gion (M¨uller et al., 2001, see also discussion below).
3.2.3 Cross-vortex mixing in a Lagrangian chemical trans-port model
Konopka et al. (2004, 2005c3) have shown that in the La-grangian model CLaMS rather little exchange occurs across the polar vortex edge as long as a stable vortex exists. If exchange occurs, air masses will mix approximately along isentropic surfaces leading to an increase of ozone mixing ratios with respect to the vortex reference relation (Fig. 4). However, the lower the potential temperature level at which the mixing occurs, the less is the deviation of the isentropic surfaces from the vortex reference relation in ozone-tracer space (Fig. 4). That means, the lower down in the vortex mixing occurs, the smaller the impact of mixing events is on the ozone tracer relation (see Lemmen et al., 20054for a more detailed discussion of this issue).
4 Discussion
We have discussed here the validity of the two major hy-potheses on which the use of ozone-tracer relations for de-ducing chemical ozone loss in the polar vortex is based, namely that a compact ozone-tracer relation is established in the ‘early’ polar vortex before the onset of chemical ozone loss and that any change of the ozone-tracer relation in the vortex over the course of winter is mainly caused by chemi-cal ozone loss.
Based on both measurements in the polar stratosphere and model results, we argue that a compact ozone-tracer rela-tion develops within the polar vortex. Model results (Sankey and Shepherd, 2003) showing no compact ozone-tracer re-lation in the Arctic vortex and a rather slow development of compactness of the ozone-tracer relation in the Antarctic vor-tex are likely caused by an insufficient representation of the transport barrier at the vortex edge in the model employed.
Recently, Konopka et al. (2004) analysed the development of ozone-tracer relations in simulations of the Lagrangian model CLaMS (McKenna et al., 2002b), a model in which a strong transport barrier develops at the edge of the polar vor-tex (e.g. Konopka et al., 2003b, 2004; Steinhorst et al., 2005). Compact ozone-tracer relations are found in the CLaMS re-sults between simulated tracer (CH4) and passive ozone mix-ing ratios in the Antarctic vortex for September to November
4Lemmen, C., M¨uller, R., Konopka, P., and Dameris, M.:
Tracer-tracer relations as a tool for analyzing polar chemical ozone loss in chemistry-climate models, J. Geophys. Res., submitted, 2005.
R. M¨uller et al.: Ozone/tracer relations in the polar vortex 3147
2002 (Konopka et al., 2004). Compact correlations are like-wise found for the ozone-tracer relation, when ozone is de-duced from POAM satellite measurements interpolated to the CLaMS model grid points. Similarly, CLaMS model simula-tions for the mid-winter Arctic vortex (Fig. 4, Konopka et al., 2005c3) show both a clear separation between mid-latitude and vortex air masses and a compact ozone-tracer relation within the vortex.
Indeed, HALOE measurements in the Arctic vortex in Jan-uary 1992 show a compact ozone-tracer relation (Fig. 3). The same is true for ILAS measurements in the Arctic vortex in January 1997 which provide a better coverage of the vortex (Fig. 7, see also Tilmes et al., 2003b).
Reference relations for deducing ozone loss that are de-rived from mixing lines (Michelsen et al., 1998) yield results for the deduced chemical ozone loss comparable to those ob-tained by using an ‘early vortex’ relation from within the vor-tex. Nonetheless, we consider an ‘early vortex’ relation as a more reliable reference than one derived from mixing lines.
Inside- and outside-vortex air is characterised by different ozone-tracer relationships, with the outside-vortex relation-ships showing greater ozone mixing ratios (and a stronger variability) for equal values of the tracer than inside relation-ships (e.g., Proffitt et al., 1990; M¨uller et al., 1999, 2002; Tilmes et al., 2003b). Consequently, mixing between air masses inside and outside the vortex should lead to points lying above the original ozone-tracer relation in the vortex (Fig. 1, top panel), as has been indeed observed in Arctic winter 2000 (Rex et al., 2002; Jost et al., 2002, see also Fig. 6).
Therefore, mixing across the vortex edge, if it occurs dur-ing the period of chemical ozone loss, should lead to an ‘un-derestimation’ of ozone loss. This finding is in contrast to the conclusions of Plumb et al. (2000), who state that ‘estimates of ozone depletion inferred from ozone-tracer relations are likely to be overestimates’. We argue here that this different conclusion is reached by Plumb et al. (2000) because they assume the same tracer-tracer relation inside and outside the vortex and use a rather high diffusivity at the vortex edge in their conceptual model.
Simulations with the Lagrangian model CLaMS (Konopka et al., 2004, 2005c3; Lemmen et al., 20054) indicate that if exchange across the transport barrier at the vortex edge oc-curs, it will lead to an increase of ozone mixing ratios in the vortex. Further, as air masses will mix approximately along isentropic surfaces crossing the vortex edge, mixing will have an increasingly smaller impact on the ozone tracer relation in the vortex, the lower down a mixing event oc-curs (Fig. 4). Indeed, Jost et al. (2002) report a case where mixing across the vortex edge occurred at ≈380 K in early March of Arctic winter 2000 that did not noticeably change the O3/N2O relation.
Esler and Waugh (2002) proposed to construct an artificial reference tracer from a linear combination of several long-lived tracers so that a linear relation of a chemically active
tracer with the artificial reference tracer would result. In this way, the impact of a mixing event of the type shown in Fig. 1, bottom panel, can be removed from the analysis since linear tracer-tracer relationships are unaffected by such mixing events. However, since inside- and outside-vortex air is characterised by different ozone-tracer relationships, the construction of an artificial reference tracer as suggested by Esler and Waugh (2002) (for estimating denitrification) would not help to eliminate the impact of mixing between inside- and outside-vortex air masses on ozone-tracer rela-tions inside the polar vortex.
Differential descent within the vortex with subsequent hor-izontal mixing results in mixing events of the type shown in Fig. 1, bottom panel. We have shown here that over the lifetime of the polar vortex this mechanism can only have a minor impact on ozone-tracer relations within the vortex (Fig. 5), corroborating conclusions based on measurements in winter 1999/2000 (Ray et al., 2002; Salawitch et al., 2002). In any event, if chemical ozone loss in the polar vortex occurs, it will reduce ozone mixing ratios in the vortex and thus it will alter the reference ozone-tracer relation. In winter 1996/97 (Fig. 7), the beginning ozone depletion is clearly no-ticeable as a moderate deviation of the ozone-tracer relation from the reference relation. In late March, after substantial ozone loss, a strong deviation from the reference relation is obvious. The ozone-tracer relation in March is ‘not’ compact because of a chemical reason, namely substantially differ-ent chemical ozone loss in differdiffer-ent parts of the polar vortex (McKenna et al., 2002a; Tilmes et al., 2003b). In early May 1997, compact ozone-tracer relations were again observed in the remaining vortex, consistent with the view that mixing in the vortex had, by that time, homogenised the vortex air mass again.
The chemical ozone loss deduced using the TRAC method has been compared with the results of other methods (Harris et al., 2002; Tilmes et al., 2004). The results deduced us-ing tracer-tracer relations are in general agreement with those obtained by other methods; however, the very strong ozone loss deduced from SAOZ measurements for January in some winters (e.g., Goutail et al., 1999) cannot be identified with TRAC.
5 Conclusions
Ozone-tracer relations have been used for more than a decade to quantify chemical ozone loss in the polar vortex. An issue neglected in the early studies is that it is necessary to assess the impact of mixing processes on tracer-tracer relationships in the polar vortex for a reliable quantification of ozone loss. Recently, also the question of the behaviour of ozone-tracer correlations in the results of model simulations has attracted interest.
Analysing various sets of measurements and the results from several models we find here that mixing across the