HAL Id: hal-01436273
https://hal.sorbonne-universite.fr/hal-01436273
Submitted on 16 Jan 2017
HAL is a multi-disciplinary open access
archive for the deposit and dissemination of sci-entific research documents, whether they are pub-lished or not. The documents may come from teaching and research institutions in France or abroad, or from public or private research centers.
L’archive ouverte pluridisciplinaire HAL, est destinée au dépôt et à la diffusion de documents scientifiques de niveau recherche, publiés ou non, émanant des établissements d’enseignement et de recherche français ou étrangers, des laboratoires publics ou privés.
L. Maugendre, C. Guieu, Jean-Pierre Gattuso, Frédéric Gazeau
To cite this version:
L. Maugendre, C. Guieu, Jean-Pierre Gattuso, Frédéric Gazeau. Ocean acidification in the Mediter-ranean Sea: pelagic mesocosm experiments. A synthesis. Estuarine, Coastal and Shelf Science, Elsevier, 2017, �10.1016/j.ecss.2017.01.006�. �hal-01436273�
M
AN
US
CR
IP
T
AC
CE
PT
ED
1Ocean acidification in the Mediterranean Sea: pelagic mesocosm experiments. A
1
synthesis.
2 3
L. Maugendre1,2, C. Guieu1,2, J.-P. Gattuso1,2,3 and F. Gazeau1,2,* 4
5
[1] Sorbonne Universités, UPMC Univ Paris 06, UMR 7093, LOV, Observatoire 6
Océanologique de Villefranche, 06230, Villefranche-sur-Mer, France 7
[2] CNRS-INSU, Laboratoire d’Océanographie de Villefranche, 06230 Villefranche-sur-Mer, 8
France 9
[3] Institute for Sustainable Development and International Relations (IDDRI), Sciences Po, 10
27 rue Saint Guillaume, F-75007 Paris, France 11
12
*
Corresponding author: [email protected] 13
14
Key words: ocean acidification; plankton communities; mesocosm experiments;
15
Mediterranean Sea. 16
M
AN
US
CR
IP
T
AC
CE
PT
ED
1. Introduction 17Planet Earth has entered a new geological era, the Anthropocene, in which geologically 18
significant conditions and processes are profoundly altered by human activities (Waters et al., 19
2016). Among many impacts, human activities have released excessive amounts of carbon 20
dioxide (CO2) in the atmosphere leading to warming and ocean acidification: a decrease in pH
21
and CO32- concentration and an increase in CO2 and HCO3- concentrations (Gattuso and
22
Hansson, 2011). On average, at the global scale, surface ocean pH has decreased by 0.1 units 23
since the beginning of the industrial era, equivalent to an increased acidity of 26% (Ciais et 24
al., 2013). An additional decrease of pH is expected by 2100, ranging from 0.07 to 0.33, 25
depending on the CO2 emission scenario considered (Gattuso et al., 2015).
26
Whilst the chemistry of ocean acidification is understood with a very high level of 27
confidence, its impacts on ocean biology and biogeochemistry are known with much lower 28
confidence levels. In the last 20 years or so, ocean acidification research has clearly made the 29
greatest progress on the physiological responses of single species or strains (e.g. Andersson et 30
al., 2011; Riebesell and Tortell, 2011). There is, however, a clear lack of knowledge regarding 31
the response of communities or ecosystems (Riebesell and Gattuso, 2015). 32
Among the poorly known impacts is the effect of ocean acidification on the efficiency of 33
the biological pump, the transport of organic matter from the surface to the deep sea and, in 34
turn, on the global carbon cycle and climate regulation. About 50% of the global primary 35
production occurs in the ocean (Field et al., 1998). Primary production converts CO2 to
36
organic matter through photosynthesis. As all organisms remineralise this organic matter 37
through respiration in the surface mixed-layer, consuming O2 and releasing CO2 to seawater,
38
only about 30% of the organic matter produced is exported to the deep sea (Falkowski et al., 39
1998) where it is partially remineralised by bacteria and 1 to 3% is buried in sediments (De 40
La Rocha and Passow, 2007). 41
M
AN
US
CR
IP
T
AC
CE
PT
ED
As changes in the efficiency of this biological pump have the capacity to alter the capacity 42
of the ocean to store anthropogenic CO2, there is therefore a great need in projecting its future
43
evolution. Ocean acidification experiments focussing on single plankton species do not allow 44
assessing the impacts of ocean acidification on the CO2 uptake capacity of the ocean. Since
45
2000, a significant number of perturbation experiments have been performed to fill this 46
knowledge gap by focusing on communities rather than on isolated species (Figure 1 and 47
Table 1). Most have been performed in the northern hemisphere with a focus on coastal meso- 48
and eutrophic sites, or following nutrient addition at the start or during the experiments. 49
However, ocean provinces are very diverse (Longhurst et al., 1995) but around 60% of the 50
ocean is oligotrophic, an area that is expected to expand in the future (Polovina et al., 2008; 51
Irwin and Oliver, 2009). Yet, the impacts of ocean acidification on these regions are almost 52
unknown. Past community perturbation experiments were performed using various 53
approaches, from small bottle incubations (≤ 1 L) to large mesocosms (> 50,000 L), and over 54
different time scales (a few days to a few weeks). Mesocosms allow for the maintenance of 55
natural communities under close-to-natural conditions and the collection of sinking organic 56
matter (Riebesell et al., 2008; Riebesell et al., 2013). They therefore are attractive tools to 57
study the impact of ocean acidification on plankton community structure and functioning as 58
well as on organic matter export. 59
The European MedSeA project (http://medsea-project.eu) was launched in 2011 with 60
the objective to focus on the impacts of ocean acidification and warming in the Mediterranean 61
Sea. In this semi-enclosed sea, pH has decreased by 0.055 to 0.156 units from pre-industrial 62
to 2013, depending on the location (Hassoun et al., 2015). A further decrease of 0.24 to 0.46 63
units is projected for the end of the century (Goyet et al., 2016). The Mediterranean Sea is 64
characterised by low concentrations of nutrients and chlorophyll (The Mermex group, 2011). 65
Based on satellite-derived estimates, chlorophyll a concentrations exhibit low values (less 66
M
AN
US
CR
IP
T
AC
CE
PT
ED
than 0.2 µg L-1) over most of the Mediterranean Sea, except for the Liguro-Provençal region 67
where relatively large blooms can be observed in late winter-early spring (e.g. Mayot et al., 68
2016). These features make this region of Mediterranean Sea a perfect natural laboratory to 69
study the effects of nutrient availability (oligotrophy vs. mesotrophy) on the response of 70
plankton community to CO2 enrichment.
71
Two experiments were performed in the framework of the MedSeA project to 72
investigate the effects of ocean acidification on plankton communities in the NW 73
Mediterranean Sea during two seasons with contrasted environmental conditions (i.e. summer 74
oligotrophic stratified waters vs. winter mesotrophic well-mixed waters). These experiments 75
were performed using large mesocosms deployed in the field and using an interdisciplinary 76
approach to study a large number of parameters and processes. This manuscript aims to 77
briefly present the experiments and its main findings. It also highlights some issues while 78
performing these experiments in the Mediterranean Sea and provides perspectives for future 79
plankton community research in low-nutrient, low-chlorophyll areas. 80
M
AN
US
CR
IP
T
AC
CE
PT
ED
2. Overview of the experimental set-up
81
Two experiments were conducted in the Northwestern Mediterranean Sea: the first 82
one, in the Bay of Calvi (Corsica, France; Fig. 2) in summer (June-July 2012), and the second 83
one in the Bay of Villefranche (France; Fig. 2) in winter (February-March 2013). The 84
experimental set-up and mesocosm characteristics are described in Gazeau et al. (this issue-a). 85
Briefly, for each experiment, nine 50 m3 mesocosms (2.3 m in diameter and 15 m deep; Fig. 86
3A) were deployed for 20 and 12 d in the Bay of Calvi and the Bay of Villefranche, 87
respectively. Once the bottom of the mesocosms was closed, CO2 saturated seawater was
88
added to generate a pCO2 gradient across mesocosms ranging from ambient level to 1,250
89
µatm, with three control mesocosms (C1, C2 and C3) and six mesocosms with increasing 90
pCO2 (P1 to P6). In the Bay of Calvi, the six pCO2 levels were P1: 550, P2: 650, P3: 750, P4:
91
850, P5: 1000 and P6: 1250 µatm. In the Bay of Villefranche, the levels were P1: 450, P2: 92
550, P3: 750, P4: 850, P5: 1000 and P6: 1250 µatm. Mesocosms were grouped in clusters of 93
three with each cluster containing a control, a medium and a high pCO2 level (cluster 1: C1,
94
P1, P4; cluster 2: C2, P2, P5 and cluster 3: C3, P3, P6; Fig. 3B). Acidification of the 95
mesocosms was performed over 4 d by addition of various volumes of CO2-saturated
96
seawater. Once the target pCO2 levels were reached, the experiments started (day 0; 24 June
97
2012 and 22 February 2013 for the Bay of Calvi and the Bay of Villefranche, respectively). 98
No further CO2 addition was performed and pCO2 levels evolved in mesocosms driven by
air-99
sea fluxes, temperature changes and net community production. Weather permitting, 100
conductivity-temperature-depth (CTD) casts were performed every day in each mesocosm as 101
well as in the ambient environment with a Sea-Bird Electronics (SBE) 19plusV2. Depth-102
integrated (0-10 m) samplings from the mesocosms and from the ambient environment were 103
performed daily using integrating water samplers, IWS (HYDRO-BIOS©). Sediment traps 104
located at the bottom end of the mesocosms were collected by SCUBA diving (daily in the 105
M
AN
US
CR
IP
T
AC
CE
PT
ED
Bay of Calvi and every 2-3 d in the Bay of Villefranche) and a zooplankton net haul (200 µm 106
mesh size) was performed in each mesocosm at the end of the experiment, only in the Bay of 107
Calvi. While in the Bay of Calvi, the experiment lasted 20 d as scheduled, a storm irreversibly 108
damaged the bags on March 7th in the Bay of Villefranche, and the experiment had to be 109
interrupted after 12 d. All data collected during the two experiments are openly available on 110
Pangaea, Bay of Calvi: http://doi.pangaea.de/10.1594/PANGAEA.810331 and Bay of 111
Villefranche: http://doi.pangaea.de/10.1594/PANGAEA.835117. 112
M
AN
US
CR
IP
T
AC
CE
PT
ED
3. Main results 113At both locations, the target pCO2 levels were successfully reached at the start of the
114
experiments (Fig. 3C). As no further CO2 addition was performed to maintain CO2 levels at
115
the target values, high pCO2 levels gradually declined. While the decrease was limited in
116
summer, pCO2 dropped at a much larger rate in winter as a consequence of strong wind and a
117
second CO2 addition would have been necessary (Gazeau et al., this issue-a) but was
118
prevented by the storm which damaged almost all mesocosms. 119
The objective of our study was to conduct two experiments under contrasted 120
conditions in terms of nutrient concentration and community composition. The summer 121
experiment was performed in warm waters with very low concentrations of chlorophyll a and 122
nutrients (Table 2). The molar ratio of inorganic N:P increased from 1.7 at the beginning of 123
the experiment to ~4 on day 20, a value that is much lower than theoretical plankton 124
requirements, suggesting, together with very low concentrations of these elements, a strong 125
nitrate and phosphate co-limitation (Louis et al., this issue). The hydrological and weather 126
conditions of the Bay of Villefranche were typical of winter conditions in the Northwestern 127
Mediterranean Sea (low temperature and irradiance; Gazeau et al., this issue-a). However, as a 128
consequence of very favourable weather conditions during the acidification phase (four sunny 129
days prior to the start of the experiment), nutrients were rapidly consumed in all mesocosms. 130
Most of the available nitrate was already consumed at the beginning of the experiment, 131
reaching levels and a molar inorganic N:P ratio of 13 not usually encountered during this 132
period of the year precluding the formation of a significant bloom (Louis et al., this issue). 133
Long time series of chlorophyll a and nutrient concentrations are available in this area of the 134
Mediterranean Sea, enabling to bring the experiments into a wider context and check for their 135
representativeness. Conditions encountered during the summer experiment were typical of 136
conditions in the Northwestern Mediterranean Sea between June and December as depicted 137
M
AN
US
CR
IP
T
AC
CE
PT
ED
for the concentration of chlorophyll a (Fig. 4A) as well as nitrate, phosphate and silicate (Fig. 138
4B). In contrast, winter conditions in the Northwestern Mediterranean Sea are much more 139
variable depending on location and the year considered, with a large variability in nutrient 140
concentrations and the formation or absence of a bloom. The analysis of these two long time 141
series highlights the difficulty to catch a bloom following a winter-mixing event in this 142
region. More importantly, these comparisons confirm that the nutrient concentrations 143
encountered at the beginning of the winter experiment were clearly outside the range of 144
values found in this area at this period of the year (Fig. 4B). 145
Although the concentration of total chlorophyll a was 20 times higher in winter than in 146
summer, in both experiments plankton communities were clearly dominated by small 147
phytoplankton cells such as Haptophyceae, Cyanobacteria and Chlorophyceae in the Bay of 148
Calvi and Cryptophyceae, Haptophyceae and Pelagophyceae in the Bay of Villefranche 149
(Gazeau et al., this issue-b; Table 2). Large species such as diatoms represented less than ~5% 150
and ~11% of phytoplankton biomass respectively in summer and in winter. This is not 151
surprising as it is well known that, in this region, diatoms dominate later in the spring during 152
the transition period between mixed and stratified conditions (Claustre et al., 1994). 153
Both communities were close to metabolic balance with a tendency toward autotrophy 154
during the winter experiment (Maugendre et al., this issue-a). In summer, both the abundance 155
and the production of heterotrophic prokaryotes remained constant throughout the experiment 156
(Celussi et al., this issue). In winter, although bacterial abundances increased significantly 157
during the experimental period, bacterial production did not change significantly (Celussi et 158
al., this issue). The addition of inorganic 13C allowed following the transfer of carbon from 159
inorganic via bulk particulate organic carbon and phytoplankton to bacteria by means of 160
biomarkers as well as to zooplankton and settling particles. In summer, the community was 161
slow-growing and based on regenerated production while in winter the fast-growing species at 162
M
AN
US
CR
IP
T
AC
CE
PT
ED
the start of the experiment were replaced by slow-growing ones during the experiment as a 163
consequence of nutrient limitation (Maugendre et al., this issue-b). Nitrogen fixation appeared 164
to be an active metabolic process in summer (Rees et al., this issue) but no activity of 165
nitrifiers could be detected in winter (Rees, unpublished data). During both experiments, 166
export of carbon to the sediment traps was highest at the start of the experiments, and 5 times 167
larger in winter than in summer (Gazeau et al., this issue-b). 168
The main results with respect to the observed effects of CO2 enrichment are shown in
169
Table 3. The vast majority of parameters and processes which were investigated suggest an 170
overall resilience of the plankton community structure and function in both locations and 171
season. Gazeau et al. (this issue-b) showed that although few phytoplankton groups were 172
negatively or positively impacted by CO2 enrichment in summer, their response remained
173
small with no consequence on total chlorophyll a concentrations, transparent exopolymeric 174
particle formation (data only available in the Bay of Villefranche; Bourdin et al., this issue) 175
and organic matter export (Gazeau et al., this issue-b). Similarly, scanning electron 176
microscopy reported by Oviedo et al. (this issue) did not highlight any change in the 177
abundance of coccolithophores and siliceous phytoplankton, and no change in size structure 178
which could have had an impact on sedimentation rates. As a result of such limited 179
modifications in the phytoplankton community structure, gross and net primary production 180
rates exhibited no apparent change in response to elevated pCO2 (Maugendre et al., this
issue-181
a; Maugendre et al. this issue-b). Bacterial production rates were negatively affected in 182
summer and several bacterial enzymatic activities responded to CO2 enrichment, either
183
negatively or positively (Celussi et al., this issue). However, no consequences were observed 184
on community mineralisation rates (Maugendre et al., this issue-a). In winter (no data in 185
summer), viral abundances and replication cycles appeared uncorrelated to the imposed pCO2
186
conditions. Although there was no clear association between specific abundances of nitrifiers 187
M
AN
US
CR
IP
T
AC
CE
PT
ED
and changes in pCO2, the summer experiment in the Bay of Calvi provided evidence of a
188
stimulation in nitrogen fixation at pCO2 levels above 1000 µatm (P5 and P6; Rees et al., this
189
issue). Nevertheless, the mechanisms and diazotroph(s) responsible for N2 fixation remain
190
unknown and this study strongly argues for a better characterization of diazotrophs and 191
diazotrophy under fixed conditions of pCO2 (Rees et al., this issue). Zooplankton population
192
structure and feeding rates were only investigated during the summer experiment in the Bay 193
of Calvi and no effects in any of the studied parameters/processes could be detected 194
(Zervoudaki et al., this issue). All these results converge in suggesting that elevated pCO2
195
levels will not lead to important changes in plankton structure, metabolic rates and sea surface 196
biological carbon fixation under conditions of strong limitation by nutrient availability. 197
As discussed in the papers brought together in the present special issue, these results 198
stand in contrast to similar large in situ mesocosm experiments conducted in eutrophic areas 199
(or following nutrient addition; see Table 1) as well as to very recent experiments performed 200
under low nutrient conditions in the Baltic Sea (Paul et al., 2015; Bach et al., 2016). In the 201
Northwestern Mediterranean Sea (Bay of Blanes), using indoor tanks, Sala et al. (2016) 202
exposed coastal plankton communities to elevated CO2 levels under contrasting conditions: in
203
winter, at the peak of the annual phytoplankton bloom, and in summer, under low nutrient 204
conditions. These recent studies suggested that plankton communities will be more affected 205
by ocean acidification under low nutrient conditions than in more productive waters. This is 206
in contrast to the two experiments described here. There are two non-mutually exclusive 207
reasons for these discrepancies. First, the experiment of Sala et al. (2016) was conducted in an 208
area that is much less nutrient limited than the sites investigated in the present study. Even 209
during their summer low-nutrient experiment, Sala et al. (2016) reported nitrate 210
concentrations almost ten times higher than those observed in summer in the Bay of Calvi and 211
four times higher than those observed in winter in the Bay of Villefranche at the start of the 212
M
AN
US
CR
IP
T
AC
CE
PT
ED
experiment. Likewise, the concentration of chlorophyll during our summer experiment was 213
three times lower than the one observed by Sala et al. (2016) in summer. The much lower 214
nutrient availability during our experiments likely explains the contrasting responses of 215
planktonic communities in these different environmental settings. The second potential 216
explanation of the discrepancies is related to the duration of the experiments. The two large in 217
situ mesocosm experiments performed in the Baltic Sea (Paul et al., 2015; Bach et al., 2016)
218
were performed over significantly longer time scales (> 43 d). Impacts of elevated CO2 were
219
visible during the last phase when the plankton communities were relying on remineralised 220
nutrients. Our experiments did not exceed ~20 d (12 days for the winter experiment) and it is 221
likely that the build-up of remineralised nutrients did not reach concentrations large enough to 222
significantly relieve nutrient limitation. 223
M
AN
US
CR
IP
T
AC
CE
PT
ED
4. Conclusion and perspectives
224
The Mediterranean Sea is a typical low-nutrient low-chlorophyll area which exhibits 225
large changes in nutrient concentrations in the illuminated surface waters that depend strongly 226
on the seasonal hydrological regime. Nutrients are severely depleted in the surface layer 227
during summer oligotrophic conditions characterized by strong thermal stratification. During 228
winter mixing events (January–February), nutrients are re-injected to the surface layer, 229
providing favourable conditions for a bloom initiation. Superimposed to these well-known 230
seasonal features is an important inter-annual variability (Marty et al., 2002; de Fommervault 231
et al., 2015). Short events driven by the atmosphere such as strong short wind events (i.e. 232
Andersen and Prieur, 2000) and sporadic atmospheric inputs (i.e. Pulido-Villena et al., 2010) 233
can lead to transient increase in nutrient concentrations impacting nutrient stocks and thus 234
likely biota and biogeochemical fluxes. Indeed, while a wind event can inject nutrients from 235
below by rapidly deepening the mixed layer depth (Andersen and Prieur, 2000), atmospheric 236
inputs such as Saharan dust events, biomass burning or intense rain events can bring new 237
nutrients to the surface of the water-column on short-time scales (The Mermex group, 2011, 238
and references therein). In some cases, both nutrients from below and above can also be 239
responsible of profound transient changes in nutrient dynamics and impact biota (Guieu et al., 240
2010). Nutrient availability is therefore a main control of ecosystem condition in the 241
Mediterranean Sea. The perturbation experiments reported in the present special issue show 242
no or low impact of ocean acidification on key biogeochemical processes, both in summer 243
and winter whereas the natural assemblage was highly dependent on nutrient availability. Our 244
summer in situ ocean acidification mesocosm experiment was representative of summer 245
conditions in the Northwestern Mediterranean Sea. The results appear solid regarding the 246
impact of ocean acidification on short time scale on the biogeochemistry of such oligotrophic 247
system. Caution should be exercised to interpret the results of the winter experiment because 248
M
AN
US
CR
IP
T
AC
CE
PT
ED
the expected bloom conditions were not met, and important changes in nutrient availability 249
were observed during the acidification step leading to conditions inside the mesocosms that 250
were not representative of ambient conditions. Moreover, poor weather conditions at the 251
beginning of the experiment (including variable and low light availability) prevented the 252
stabilisation of blooming conditions in the bags. Yet, the time of the year to perform this 253
experiment was carefully chosen according to the 18-year time series both at Point B and 254
DYFAMED (Fig. 4). Unfortunately, this experiment is a good illustration that biological 255
activity in the Mediterranean Sea exhibits a large interannual variability and specific short-256
term events, such as blooms, are difficult to capture. 257
The mesocosm approach was a good tool in the case of the summer experiment. Yet, 258
considering the tenuous changes – or no change – observed at elevated pCO2, a different
259
strategy would have helped refining our results. Rather than using a pCO2 gradient over six
260
mesocosms, a triplicate treatment strategy taking into account two ocean acidification 261
scenarios could have been more appropriate to better quantify possible impacts. Based on 262
these observations, it appears that a large mesocosm pelagic approach may not be the ideal 263
strategy in the Mediterranean Sea – or any other truly oligotrophic system - since the impacts 264
expected will likely be low or non-existent irrespective of ambient conditions when the 265
mesocosms were filled. A land-based experimental device providing well controlled 266
environmental conditions (including light and temperature) would be more appropriate. 267
Indeed, as for the global ocean, the Mediterranean Sea has experienced a positive trend in 268
both sea surface and deep-water temperature (The Mermex group, 2011) and yet specific 269
studies assessing the combined effects of ocean warming and acidification on planktonic and 270
benthic primary production are scarce. Moreover, as mentioned above, atmospheric 271
deposition is an important source of new nutrients to the Mediterranean Sea which should also 272
be considered as an additional driver. Changes in seawater pH and temperature may affect the 273
M
AN
US
CR
IP
T
AC
CE
PT
ED
bioavailability of some nutrients by altering their speciation as well as the adsorption/release 274
from/to particles. 275
A follow up of this project could thus be to work in very well controlled conditions of 276
pCO2, light, temperature and atmospheric deposition in large clean indoor containers (a small
277
version of the mesocosms currently under development at the Laboratoire d’Océanographie 278
de Villefranche) to investigate the impacts of atmospheric deposition under present and future 279
pCO2 and temperature conditions.
M
AN
US
CR
IP
T
AC
CE
PT
ED
5. Acknowledgements 281This work was funded by the EC FP7 project ‘Mediterranean Sea Acidification in a changing 282
climate’ (MedSeA; grant agreement 265103), the ‘European Free Ocean Carbon Enrichment’ 283
project (eFOCE; BNP-Paribas Foundation), the MISTRALS-MERMEX program (Institut des 284
Sciences de l’Univers, CNRS-INSU), the Corsican local authorities and the Rhone-285
Mediterranean and Corsica Water Agency (http://www.eaurmc.fr). It is a contribution to the 286
Surface Ocean-Lower Atmosphere Study (SOLAS) and Integrated Marine Biogeochemistry 287
and Ecosystem Research (IMBER) projects. The STARESO marine station is gratefully 288
acknowledged for its superb assistance and boat support carried out within the framework of 289
the STARECAPMED project funded by the Rhone-Mediterranean and Corsica Water 290
Agency. Staff of the Observatoire Océanologique de Villefranche is gratefully acknowledged 291
for its assistance and boat support. Colleagues of the Laboratoire d'Océanographie de 292
Villefranche provided laboratory space. Thanks are due to J. Czerny, K. Schulz and U. 293
Riebesell for invaluable help regarding the experimental setup, B. Hesse, D. Luquet, D. 294
Robin, P. Mahacek and E. Cox are acknowledged for assistance with diving operations. L. 295
Guidi is acknowledged for his help with figure drawing. L. Coppola and L. Mousseau are 296
acknowledged for providing respectively DYFAMED (doi: 10.17882/43749) and Point B data 297
(SOMLIT: Service d’Observation en Milieu LITtoral). Finally, thanks are due to the MedSeA 298
mesocosms team for help during the experiments. 299
M
AN
US
CR
IP
T
AC
CE
PT
ED
6. References 300Andersen, V., Prieur, L., 2000. One-month study in the open NW Mediterranean Sea 301
(DYNAPROC experiment, May 1995): overview of the hydrobiogeochemical structures 302
and effects of wind events. Deep-Sea Research Part I-Oceanographic Research Papers 303
47, 397-422. 304
Andersson, A.J., Mackenzie, F.T., Gattuso, J.-P., 2011. Effects of ocean acidification on 305
benthic processes, organisms, and ecosystems, in: Gattuso, J.-P., Hansson, L. (Eds.), 306
Ocean acidification. Oxford University Press, Oxford, pp. 122-153. 307
Bach, L.T., Taucher, J., Boxhammer, T., Ludwig, A., Achterberg, E.P., Algueró-Muñiz, M., 308
Anderson, L.G., Bellworthy, J., Büdenbender, J., Czerny, J., Ericson, Y., Esposito, M., 309
Fischer, M., Haunost, M., Hellemann, D., Horn, H.G., Hornick, T., Meyer, J., Sswat, 310
M., Zark, M., Riebesell, U., The Kristineberg, K.C., 2016. Influence of Ocean 311
Acidification on a Natural Winter-to-Summer Plankton Succession: First Insights from 312
a Long-Term Mesocosm Study Draw Attention to Periods of Low Nutrient 313
Concentrations. Plos One 11, e0159068. 314
Ciais, P., Sabine, C., Bala, G., Bopp, L., Brovkin, V., Canadell, J., Chhabra, A., DeFries, R., 315
Galloway, J., Heimann, M., Jones, C., Le Quéré, C., Myneni, R.B., Piao, S., Thornton, 316
P., 2013. Carbon and Other Biogeochemical Cycles, in: Stocker, T.F., Qin, D., Plattner, 317
G.-K., Tignor, M., Allen, S.K., Boschung, J., Nauels, A., Xia, Y., Bex, V., Midgley, 318
P.M. (Eds.), Climate Change 2013: The Physical Science Basis. Contribution of 319
Working Group I to the Fifth Assessment Report of the Intergovernmental Panel on 320
Climate Change, Cambridge University Press, Cambridge, United Kingdom and New 321
York, NY, USA. 322
M
AN
US
CR
IP
T
AC
CE
PT
ED
Claustre, H., Kerherve, P., Marty, J.C., Prieur, L., Videau, C., Hecq, J.H., 1994. 323
Phytoplankton dynamics associated with a geostrophic front - ecological and 324
biogeochemical implications. Journal of Marine Research 52, 711-742. 325
de Fommervault, O.P., Migon, C., D'Ortenzio, F., d'Alcala, M.R., Coppola, L., 2015. 326
Temporal variability of nutrient concentrations in the Northwestern Mediterranean Sea 327
(DYFAMED time-series station). Deep-Sea Research Part I-Oceanographic Research 328
Papers 100, 1-12. 329
De La Rocha, C.L., Passow, U., 2007. Factors influencing the sinking of POC and the 330
efficiency of the biological carbon pump. Deep-Sea Research Part Ii-Topical Studies in 331
Oceanography 54, 639-658. 332
Falkowski, P.G., Barber, R.T., Smetacek, V., 1998. Biogeochemical controls and feedbacks 333
on ocean primary production. Science 281, 200-206. 334
Field, C.B., Behrenfeld, M.J., Randerson, J.T., Falkowski, P., 1998. Primary production of the 335
biosphere: integrating terrestrial and oceanic components. Science 281, 237-240. 336
Gattuso, J.-P., Hansson, L., 2011. Ocean acidification: background and history, in: Gattuso, 337
J.-P., Hansson, L. (Eds.), Ocean acidification. Oxford University Press, Oxford, pp. 1-338
20. 339
Gattuso, J.P., Magnan, A., Bille, R., Cheung, W.W.L., Howes, E.L., Joos, F., Allemand, D., 340
Bopp, L., Cooley, S.R., Eakin, C.M., Hoegh-Guldberg, O., Kelly, R.P., Poertner, H.O., 341
Rogers, A.D., Baxter, J.M., Laffoley, D., Osborn, D., Rankovic, A., Rochette, J., 342
Sumaila, U.R., Treyer, S., Turley, C., 2015. Contrasting futures for ocean and society 343
from different anthropogenic CO2 emissions scenarios. Science 349, 45-+.
344
Goyet, C., Hassoun, A.E.R., Gemayel, E., Touratier, F., Saab, M.A.A., Guglielmi, V., 2016. 345
Thermodynamic forecasts of the Mediterranean Sea acidification. Mediterranean 346
Marine Science 17, 508-518. 347
M
AN
US
CR
IP
T
AC
CE
PT
ED
Guieu, C., Dulac, F., Desboeufs, K., Wagener, T., Pulido-Villena, E., Grisoni, J.M., Louis, F., 348
Ridame, C., Blain, S., Brunet, C., Nguyen, E.B., Tran, S., Labiadh, M., Dominici, J.M., 349
2010. Large clean mesocosms and simulated dust deposition: a new methodology to 350
investigate responses of marine oligotrophic ecosystems to atmospheric inputs. 351
Biogeosciences 7, 2765-2784. 352
Hassoun, A.E., Gemayel, E., Krasakopoulou, E., Goyet, C., Saab, M.A.A., Guglielmi, V., 353
Touratier, F., Falco, C., 2015. Acidification of the Mediterranean Sea from 354
anthropogenic carbon penetration. Deep-Sea Research Part I-Oceanographic Research 355
Papers 102, 1-15. 356
Irwin, A.J., Oliver, M.J., 2009. Are ocean deserts getting larger? Geophysical Research 357
Letters 36. 358
Longhurst, A., Sathyendranath, S., Platt, T., Caverhill, C., 1995. An estimate of global 359
primary production in the ocean from satellite radiometer data. Journal of Plankton 360
Research 17, 1245-1271. 361
Marty, J.C., Chiaverini, J., Pizay, M.D., Avril, B., 2002. Seasonal and interannual dynamics 362
of nutrients and phytoplankton pigments in the western Mediterranean Sea at the 363
DYFAMED time-series station (1991-1999). Deep-Sea Research Part Ii-Topical Studies 364
in Oceanography 49, 1965-1985. 365
Mayot, N., D'Ortenzio, F., Ribera d'Alcalà, M., Lavigne, H., Claustre, H., 2016. Interannual 366
variability of the Mediterranean trophic regimes from ocean color satellites. 367
Biogeosciences 13, 1901-1917. 368
Paul, A.J., Bach, L.T., Schulz, K.G., Boxhammer, T., Czerny, J., Achterberg, E.P., 369
Hellemann, D., Trense, Y., Nausch, M., Sswat, M., Riebesell, U., 2015. Effect of 370
elevated CO2 on organic matter pools and fluxes in a summer Baltic Sea plankton
371
community. Biogeosciences 12, 6181-6203. 372
M
AN
US
CR
IP
T
AC
CE
PT
ED
Polovina, J.J., Howell, E.A., Abecassis, M., 2008. Ocean's least productive waters are 373
expanding. Geophysical Research Letters 35. 374
Pulido-Villena, E., Rerolle, V., Guieu, C., 2010. Transient fertilizing effect of dust in P-375
deficient LNLC surface ocean. Geophysical Research Letters 37. 376
Riebesell, U., Bellerby, R.G.J., Grossart, H.P., Thingstad, F., 2008. Mesocosm CO2
377
perturbation studies: from organism to community level. Biogeosciences 5, 1157-1164. 378
Riebesell, U., Czerny, J., von Bröckel, K., Boxhammer, T., Büdenbender, J., Deckelnick, M., 379
Fischer, M., Hoffmann, D., Krug, S.A., Lentz, U., Ludwig, A., Muche, R., Schulz, 380
K.G., 2013. Technical Note: A mobile sea-going mesocosm system – new opportunities 381
for ocean change research. Biogeosciences 10, 1835-1847. 382
Riebesell, U., Gattuso, J.-P., 2015. Lessons learned from ocean acidification research. Nature 383
Climate Change 5, 12-14. 384
Riebesell, U., Tortell, P.D., 2011. Effects of ocean acidification on pelagic organisms and 385
ecosystems, in: Gattuso, J.-P., Hansson, L. (Eds.), Ocean acidification. Oxford 386
University Press, Oxford, pp. 99-121. 387
Sala, M.M., Aparicio, F.L., Balagué, V., Boras, J.A., Borrull, E., Cardelús, C., Cros, L., 388
Gomes, A., López-Sanz, A., Malits, A., Martínez, R.A., Mestre, M., Movilla, J., 389
Sarmento, H., Vázquez-Domínguez, E., Vaqué, D., Pinhassi, J., Calbet, A., Calvo, E., 390
Gasol, J.M., Pelejero, C., Marrasé, C., 2016. Contrasting effects of ocean acidification 391
on the microbial food web under different trophic conditions. ICES Journal of Marine 392
Science 73, 670-679. 393
The Mermex group, 2011. Marine ecosystems' responses to climatic and anthropogenic 394
forcings in the Mediterranean. Progress in Oceanography 91, 97-166. 395
Waters, C.N., Zalasiewicz, J., Summerhayes, C., Barnosky, A.D., Poirier, C., Gałuszka, A., 396
Cearreta, A., Edgeworth, M., Ellis, E.C., Ellis, M., Jeandel, C., Leinfelder, R., McNeill, 397
M
AN
US
CR
IP
T
AC
CE
PT
ED
J.R., Richter, D.d., Steffen, W., Syvitski, J., Vidas, D., Wagreich, M., Williams, M., 398
Zhisheng, A., Grinevald, J., Odada, E., Oreskes, N., Wolfe, A.P., 2016. The 399
Anthropocene is functionally and stratigraphically distinct from the Holocene. Science 400
351. 401
M
AN
US
CR
IP
T
AC
CE
PT
ED
Figure legends 403Figure 1. A: world map showing the localisation of ocean acidification perturbation 404
experiments conducted on natural planktonic communities (see Table 1 and supplementary 405
material for the full list). Experiments considering only the effects of ocean acidification are 406
represented by a blue circle while experiments considering another stress (either ocean 407
warming, nutrient concentrations or lights levels) as additional factors are represented as a 408
pink triangle. B: cumulated number of studies focused on the effects of ocean acidification 409
(and sometimes another stress: ocean warming, nutrient or lights levels) on natural planktonic 410
communities. The years reported correspond to the date of the experiments. 411
Figure 2. Map showing the two study sites in France, the Bay of Calvi in Corsica and the Bay 412
of Villefranche on the French Riviera. The station DYFAMED (doi: 10.17882/43749) where 413
long-term data series are available is also show (see Fig. 4). 414
Figure 3. A: schematic view of the mesocosm used during these experiments. B: aerial view 415
of the grouping of mesocosms showing the location of the ambient (OUT) sampling. C: 416
measured and targeted pCO2 (in µatm) during the experiments in summer 2012 in the Bay of
417
Calvi and in winter 2013 in the Bay of Villefranche. 418
Figure 4. A: annual distribution of chlorophyll a concentrations (in µg L-1) at the point B 419
station (BV: Bay of Villefranche; 43°41’N - 7°19’E; SOMLIT; http://somlit.epoc.u-420
bordeaux1.fr/), at the DYFAMED station (Dyf; see Fig. 2; 43°25’N - 7°52’E; 421
doi: 10.17882/43749) and in the Bay of Calvi (BC; 42°35′N - 08°44′E; Goffart et al., 2015). 422
The periods at which both experiments have been conducted are represented as white bars. B: 423
box-and-whisker plots of annual evolution (1997-2014) of nutrient (nitrate: NO3-, phosphate:
424
PO43- and silicate: Si(OH), all in µmol L-1) in the Bay of Villefranche (BV; point B station;
425
43°41’N - 7°19’E; SOMLIT; http://somlit.epoc.u-bordeaux1.fr/) and at the DYFAMED 426
M
AN
US
CR
IP
T
AC
CE
PT
ED
station (Dyf; see Fig. 2; 43°25’N - 7°52’E; doi: 10.17882/43749). Concentrations observed in 427
situ (OUT; empty red circles) and in the mesocosms (full red circles; average ± standard 428
deviations) are also shown. 429
M
AN
US
CR
IP
T
AC
CE
PT
ED
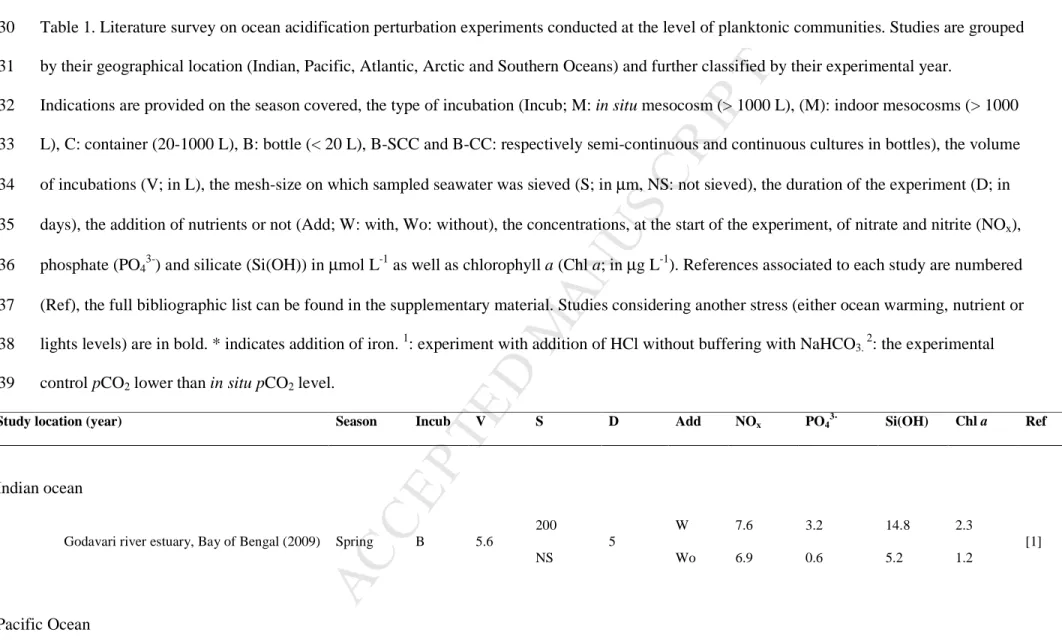
Table 1. Literature survey on ocean acidification perturbation experiments conducted at the level of planktonic communities. Studies are grouped 430
by their geographical location (Indian, Pacific, Atlantic, Arctic and Southern Oceans) and further classified by their experimental year. 431
Indications are provided on the season covered, the type of incubation (Incub; M: in situ mesocosm (> 1000 L), (M): indoor mesocosms (> 1000 432
L), C: container (20-1000 L), B: bottle (< 20 L), B-SCC and B-CC: respectively semi-continuous and continuous cultures in bottles), the volume 433
of incubations (V; in L), the mesh-size on which sampled seawater was sieved (S; in µm, NS: not sieved), the duration of the experiment (D; in 434
days), the addition of nutrients or not (Add; W: with, Wo: without), the concentrations, at the start of the experiment, of nitrate and nitrite (NOx),
435
phosphate (PO43-) and silicate (Si(OH)) in µmol L-1 as well as chlorophyll a (Chl a; in µg L-1). References associated to each study are numbered
436
(Ref), the full bibliographic list can be found in the supplementary material. Studies considering another stress (either ocean warming, nutrient or 437
lights levels) are in bold. * indicates addition of iron. 1: experiment with addition of HCl without buffering with NaHCO3. 2: the experimental
438
control pCO2 lower than in situ pCO2 level.
439
Study location (year) Season Incub V S D Add NOx PO4
3-Si(OH) Chl a Ref
Indian ocean
Godavari river estuary, Bay of Bengal (2009) Spring B 5.6
200 5 W 7.6 3.2 14.8 2.3 [1] NS Wo 6.9 0.6 5.2 1.2 Pacific Ocean
M
AN
US
CR
IP
T
AC
CE
PT
ED
Peruvian coast (2000) Fall B-SCC 4 NA 11 Wo 25 2.3 26 2 [2]
Bering Sea shelf (2003)
Summer B-CC 2.5 NS 9-10 W
+4 +1 +8 1.2
[3]
Bering Sea offshore (2003) NA NA NA NA
Southern coast of Korea (2004) Fall C 150 60 14
Wo 0.2 0.2
10 NA [4]
W 23 0.9
Okhotsk Sea (2006) Summer B 9 200 14 Wo 0.05 0.25 1.06 0.31 [5]
Bering Sea (2007) Summer B 12 200 14 Wo 16 1.5 38 0.39
[6]
Northwestern Pacific (2007) Summer B 12 200 14 Wo 16 1.4 32 0.21
Southern coast of Korea (2008) Fall M 2,400 NS 20 W 41 2.5 40 1 [7-9]
California current (2008) Fall B 4 NS 3-4
Wo <0.05
10 14 NA [10]
W 10-20
Northwestern Pacific (2008) Summer B 12 200 14
Wo
13.4 1.2 13.4 0.34 [11, 12]
W*
Bering Sea (2009) Summer B 12 200 7
Wo
18.1 1.47 17 2 [11, 13, 14]
W*
Shimoda, Japan (2009) Winter C 500 100 15 W 12.6 0.77 12.4 0.06 [15]
Ocean Station Papa (2010) Summer B 5 200 4 Wo 8 0.88 14.2 0.39 [16]
Shimoda, Japan (2011) Winter C 400 100 W 4.4 0.4 12.8 1.2 [17]
M
AN
US
CR
IP
T
AC
CE
PT
ED
Southern coast of Korea (2012) Spring M 2,400 100 19 W 15.6 0.93 13.4 15 [19, 20]
Qingdao coast, Yellow Sea (NA) NA C 20 200 5 Wo 17.2 0.5 5.9 NA [21]
Atlantic Ocean
Norwegian fjord, North Sea (PeECE I, 2001) Spring M 11,000 NS 19 W 15 0.45 0.2 0.5 [22, 23]
Norwegian fjord, North Sea (PeECE II, 2003) Spring M 20,000 NS 19 W 8.6 0.4 12 0.5
[24-42]
Norwegian fjord, North Sea (PeECE III, 2005) Spring M 27,000 NS 22 W 15 0.6 3.2 2
North Atlantic (2005) Spring B-CC 2.7 200 14 W 5 0.31 0.7 1.5 [43, 44]
Norwegian fjord, North Sea (2006) Spring M 11,000 NS 20 W 17 1 NA 0.5 [45-47]
Oresund strait, Baltic Sea (2007)
Spring
B 2.5
175 14 Wo 1.05 0.27 5.7 NA
[48]1
Summer Wo 0.65 0.18 5.2 NA
Sweden, Baltic Sea (2008) Spring C 100 NS 20 Wo 6.5 0.7 20.8 1 [49]
Kiel fjord, Baltic Sea (2009) Spring M 50,000 3000 21 W 10 0.65 8 2 [50]
Kiel Bight, Baltic Sea (2009) Summer C 300 NS 28 W 35 2.2 40 5 [51]
Subtropical North Atlantic (2009/2010) Spring B NA NS 1-3
Wo NA NA NA
0.06-0.6 [52]
W +5 +0.5 +5
Blanes Bay, Mediterranean Sea (2010) Winter C 200 200 9 Wo 3.11 0.14 2.01 0.96
[53-56] Blanes Bay, Mediterranean Sea (2011) Summer C 200 200 9 Wo 0.39 0.02 0.34 0.2
M
AN
US
CR
IP
T
AC
CE
PT
ED
Norwegian fjord, North Sea (2011) Spring M 75,000 3000 35 W 5 0.16 NA 1.2 [58-61]
Finland, Baltic Sea (2012) Spring M 50,000 3000 43 Wo 0.05 0.15 6.2 1.8 [58, 62-75]
Kiel Bight, Baltic Sea (2012) Fall (M) 1,400 NS 21 Wo 3.7 1.52 20 <1 [76-80] Bay of Villefranche, Mediterranean Sea (2012) Spring B 4 200 12 Wo 0.2 0.02 1.2 0.8 [81]
Alboran Sea (2012) Summer C 20 200 7
Wo 0.6 0.14
1.2 0.85 [82-85]
W 3 0.5
Ria Formosa coastal lagoon (2012) Winter B 4.5 NS 2 Wo NA NA NA 0.9 [86]
Northwest European shelf (2012) Spring B 4.2 NS 4
Wo 0.3-1.1 <0.02-0.14
<0.2-2.1 0.25-3.5 [87-96] W +2 +0.2
North Atlantic (2012) Spring B 5 200 9-10 W 8 0.5 6 NA [97]
Bay of Calvi, Mediterranean Sea (2012) Summer
M 50,000 5000
20
Wo
0.06 0.023 1.67 0.064
This study
Bay of Villefranche, Mediterranean Sea (2013) Winter 12 0.13 0.01 1.145 1.147
Kiel Bight, Baltic Sea (2013) Summer (M) 1,400 NS 28 Wo 1 0.6 11 NA [98]
Sweden, Baltic Sea (2013) Winter M 55,000 3000 111 Wo 6.7 0.75 9.8 0.3 [99-101]
Arctic Ocean
Fram Strait (2009) Summer (M) 1,000 NA 9 W 6 0.09 6 2.6 [102]
Svalbard (2010) Spring M 50,000 3000 30
Wo 0.1 0.07 0.2
0.2 [103-125]
M
AN
US
CR
IP
T
AC
CE
PT
ED
Svalbard offshore (2010) Summer C 20 100 15 Wo NA NA NA 0.6 [126]
Disko Bay, West Greenland (2012) Spring B 1 250 11-17 Wo 9.3 0.8 7.5 <5 [127]
Arctic (2012) Summer B 1 NS 4 Wo 0.04-9.5 NA 1.6-10.3 0.8-3 [128-136]
Southern Ocean
Ross Sea (2005) Summer B-CC 2.7 200 13
Wo
23.6 1.53 66.3 6 [137]
W*
Ross Sea (2006) Spring B-SCC 4 NA 10 - 18 Wo NA NA NA NA [138]
Derwent River estuary, Tasmania (2007) Summer B 2.5 250 14 Wo <0.2 0.5-0.2 12 1.3 [139]1
Davis Station (2008/2009) Spring C 650 200 10 Wo 4.8 0.58 ~70 0.4 [140, 141] Summer <0.43 <0.29 ~70 1.8 Summer 3 0.4 ~70 3
Weddel Sea (2010) Summer B 4 200
27-30 Wo
29 2 76 NA [142]2
18-20 W*
Tasmanian Sea (2010) Summer
C 22 NS 5 Wo NA NA NA NA [143]
New Zealand (2011) Winter
Western Antarctic Peninsula (2012/2013) Spring B 4 NA 15-21 Wo 10-23 <0.5-2 50 8-10 [144]
M
AN
US
CR
IP
T
AC
CE
PT
ED
Table 2. Environmental and experimental conditions observed in the mesocosms (average ± standard deviation) and in ambient seawater (OUT) 440
at the start (day 0) and at the end of the experiment in the Bay of Calvi in summer 2012 (day 20) and in the Bay of Villefranche in winter 2013 441
(day 12). O2: dissolved oxygen concentration, pCO2: partial pressure of CO2 and pHT: pH on the total scale estimated based on measured total
442
alkalinity (AT) and total inorganic carbon (CT) concentrations using the R package seacarb (Gattuso et al., 2016). NO3-: nitrate, NH4+:
443
ammonium, PO43-: phosphate, Si(OH): silicate. POC: particulate organic carbon, PON: particulate organic nitrogen, TEP-C: transparent
444
exopolymeric particles carbon content. Chl a: chlorophyll a. The percentage of contribution of the main taxonomic groups found during the 445
experiments and determined from high performance liquid chromatography (HPLC) measurements using modified CHEMTAX is also shown 446
(Prasino: Prasinophyceae, Dino: Dinophyceae, Crypto: Cryptophyceae, Hapto: Haptophyceae, Pelago: Pelagophyceae, Chloro: Chlorophyceae, 447
Cyano: Cyanophyceae). 448
Bay of Calvi (summer 2012) Bay of Villefranche (winter 2013)
Initial (day 0) Final (day 20) Initial (day 0) Final (day 12)
Inside Outside Inside Outside Inside Outside Inside Outside
Hydrology Temperature (°C) 22.16 ± 0.01 22.23 24.24 ± 24.27 13.24 ± 0.01 13.24 13.17 ± 13.19 Salinity 37.98 ± 0.01 37.96 38.16 ± 38.17 38.15 ± 0.01 38.11 38.18 ± 38.19 O2 (µmol L-1) 226 ± 1 226 208 ± 1 209 249 ± 1 243 251 ± 1 240 Carbonate chemistry pCO2 (µatm) 465 ± 6 458 473 ± 9 495 358 ± 17 354 373 ± 17 391 pHT 8.02 ± 0.01 8.02 8.01 ± 0.01 8.00 8.12 ± 0.02 8.12 8.11 ± 0.02 8.09
M
AN
US
CR
IP
T
AC
CE
PT
ED
AT (µmol kg-1) 2530 ± 1 2532 2547 ± 2 2544 2561 ± 1 2557 2561 ± 1 2560 CT (µmol kg-1) 2227 ± 4 2225 2225 ± 4 2232 2275 ± 9 2269 2284 ± 10 2293Inorganic nutrients (nmol L-1)
NO3- 60 ± 8 50 66 ± 10 NA 132 ± 31 1166 238 ± 139 1307
NH4+ 400 ± 200 150 210 ± 20 660 72 ± 14 62 35 ± 12 40
PO43- 23 ± 3 35 6 ± 2 NA 10 ± 2 12 10 ± 1 120
Si(OH) 1670 ± 0 1920 1260 ± 100 1770 1145 ± 35 1350 1090 ± 140 1200
Organic matter (mmol L-1)
POC 4.3 ± 1.0 5.6 4.3 ± 0.2 5.4 12.2 ± 0.4 8 9.6 ± 0.7 NA
PON 0.2 ± 1.0 0.7 0.7 ± 0.1 0.7 1.6 ± 0.1 0.8 1.3 ± 0.2 NA
TEP-C NA NA NA NA
Phytoplankton
Chl a (ng L-1) 64 ± 11 124 76 ± 9 115 1147 ± 62 950 908 ± 82 1170
Dominant species (%) Hapto (33)
Cyano (20) Chloro (17) Hapto (38) Cyano (17) Chloro (16) Chloro (34) Hapto (22) Cyano (21) Hapto (28) Chloro (19) Cyano (18) Cryto (26) Hapto (22) Pelago (18) Cryto (21) Prasino (18) Diatoms (17) Hapto (31) Pelago (23) Prasino (14) Prasino (21) Diatoms (17) Cryto (16) Heterotrophic prokaryotes Abundance (103 mL-1) 385 ± 70 467 465 ± 35 465 719 ± 19 615 1206 ± 123 669 Viruses Abundance (103 mL-1) 9.2 ± 0.7 NA 9.8 ± 1.2 NA 12.8 ± 4.3 4.2 11.6 ± 2.0 10.2
M
AN
US
CR
IP
T
AC
CE
PT
ED
Table 3. Summary of main results and highlights obtained during the two experiments in summer 2012 in the Bay of Calvi and in winter 2013 in 449
the Bay of Villefranche. Green, red and grey boxes refer to, respectively, positive, negative and not detectable effects of CO2 enrichment.
450
Hatched boxes indicate that no data are available. 451
Parameters and processes CO2 effect Highlights Related publication
Summer Winter
Hydrology and carbonate chemistry Gazeau et al. (this issue-a)
Nutrients •Contrasted nutrient stoichiometry in surface waters in summer and winter
•Dissolved organic pool was a large stable fraction of N and P in summer and winter
•CO2 had no effect on nutrient dynamics that was mostly biologically controlled
Louis et al. (this issue)
Particulate organic matter Concentration •Organic matter export was not impacted by CO2-enrichment Gazeau et al. (this issue-b)
Export to sediment traps
Transparent exopolymeric particles (TEP) TEP carbon content •A large contribution of TEP to organic carbon
•A substantial contribution of ultraphytoplankton to phytoplankton carbon pool
•No effect of ocean acidification on TEP, TEP precursors and size distribution
•Shift in ultraphytoplankton community during the experiment
•Vast production of TEP precursors by Synechococcus and/or TEP degradation
Bourdin et al. (this issue) TEP precursors
TEP densities TEP volume concentrations
Phytoplankton community Total chlorophyll a •Production limited by nutrient availability and community dominated by small species
•In areas where nutrient availability exerts a strong pressure on phytoplankton growth, CO2 addition will likely have very limited effects on phytoplankton diversity
Gazeau et al. (this issue-b) Haptophyceae Cryptophyceae Chlorophyceae Bacilophyceae Dinophyceae Prasinophyceae Pelagophyceae Cyanophyceae Diatoms Nano-eukaryotes Pico-eukaryotes
M
AN
US
CR
IP
T
AC
CE
PT
ED
Synechoccocus ProchlorococcusCalcifying phytoplankton community •A pCO2 driven phytoplankton succession did not occur in these oligotrophic areas
•Different species-specific sensitivities to pCO2 were observed
•Coccolithophore community structure changed with time, nutrients and temperature
Oviedo et al. (this issue)
Emiliania huxleyi coccolith morphology Emiliania huxleyi calcification degree
Heterotrophic prokaryotes Abundance •Different trophic regimes revealed diverse effects of ocean acidification on prokaryotes
•Ocean acidification and organic substrates were responsible for metabolic alterations
•Viral and prokaryotic abundances were not affected by increased CO2 levels
Celussi et al. (this issue)
% highly active prokaryotes
Heterotrophic Production ß-glucosidase Lipase Chitinase Alkaline phosphatase Leucine aminopeptidase
Viruses Abundance •See above Celussi et al. (this issue)
Activity •No direct effect of elevated pCO2 on viral replication cycles could be detected
•Lysogeny was dependent on system productivity, as well as on phytoplankton dynamics
•Lysis was not related to any of the measured environmental parameters
•Mild differences in lysogeny in the most perturbed mesocosm were occasionally found, along with different phytoplankton dynamics
Tsiola et al. (this issue)
Mesozooplankton Abundance and composition •Ocean acidification does not have detectable effects on the studied parameters
•Food limitation had more significant effect on copepods than ocean acidification
•The experimental set-up for the oligotrophic conditions did not provide the information on the effect of acidification
Zervoudaki et al. (this issue) Copepod eggs, nauplii stock and feeding rates
Metabolic rates Oxygen metabolism (O2 light-dark) •Summer conditions close to metabolic balance in the Bay of Calvi
•Winter autotrophic conditions in the Bay of Villefranche, with no bloom
•No effect of ocean acidification on plankton metabolic rates at both sites
•Natural environmental limitations override a potential effect of ocean acidification
Maugendre et al. (this issue-a) Gross phytoplankton production (18
O) Organic carbon production (particulate and dissolved; 14
C) Calcification rates (14
M
AN
US
CR
IP
T
AC
CE
PT
ED
Carbon flow (13C and biomarkers) •Inorganic 13
C was added to follow carbon transfer in plankton communities using biomarkers
•Summer community production dominated by slow-growing species is representative of stratified nutrient limited conditions
•Winter community evolved from a dominance of fast-growing species to slow-growing species, due to nutrient limitation
•No detectable effect of ocean acidification on production and carbon transfer during both experiments
Maugendre et al. (this issue-b)
Nitrogen fixation Diazotrophic community structure •First study of ocean acidification impacts on Mediterranean Sea N2 fixation
•Ocean acidification enhanced rates of N2 fixation in Mediterranean coastal waters
•N2-fixing bacteria observed were not representative of the main marine N2-fixers
•A diverse community of N2-fixing bacteria changed in composition unrelated to ocean
acidification
Rees et al. (this issue) N2 fixation rates
M
AN
US
CR
IP
T
AC
CE
PT
ED
33Supplementary material: list of publications cited in Table 1
452
1. Biswas, H., Cros, A., Yadav, K., Ramana, V.V., Prasad, V.R., Acharyya, T., Babu, 453
P.V.R., 2011. The response of a natural phytoplankton community from the Godavari 454
River Estuary to increasing CO2 concentration during the pre-monsoon period. Journal
455
of Experimental Marine Biology and Ecology, 407 (2): 284-293. 456
2. Tortell, P.D., DiTullio, G.R., Sigman, D.M., Morel, F.M.M., 2002. CO2 effects on
457
taxonomic composition and nutrient utilization in an Equatorial Pacific phytoplankton 458
assemblage. Marine Ecology Progress Series, 236 37-43. 459
3. Hare, C.E., Leblanc, K., DiTullio, G.R., Kudela, R.M., Zhang, Y., Lee, P.A., Riseman, 460
S., Hutchins, D.A., 2007. Consequences of increased temperature and CO2 for
461
phytoplankton community structure in the Bering Sea. Marine Ecology Progress 462
Series, 352 9-16. 463
4. Kim, J.M., Lee, K., Shin, K., Kang, J.H., Lee, H.W., Kim, M., Jang, P.G., Jang, M.C., 464
2006. The effect of seawater CO2 concentration on growth of a natural phytoplankton
465
assemblage in a controlled mesocosm experiment. Limnology and Oceanography, 51 466
(4): 1629-1636. 467
5. Yoshimura, T., Nishioka, J., Suzuki, K., Hattori, H., Kiyosawa, H., Watanabe, Y.W., 468
2010. Impacts of elevated CO2 on organic carbon dynamics in nutrient depleted
469
Okhotsk Sea surface waters. Journal of Experimental Marine Biology and Ecology, 470
395 (1-2): 191-198. 471
6. Yoshimura, T., Suzuki, K., Kiyosawa, H., Ono, T., Hattori, H., Kuma, K., Nishioka, 472
J., 2013. Impacts of elevated CO2 on particulate and dissolved organic matter
473
production: microcosm experiments using iron-deficient plankton communities in 474
open subarctic waters. Journal of Oceanography, 69 (5): 601-618. 475
7. Kim, J.H., Kim, K.Y., Kang, E.J., Lee, K., Kim, J.M., Park, K.T., Shin, K., Hyun, B., 476
Jeong, H.J., 2013. Enhancement of photosynthetic carbon assimilation efficiency by 477
phytoplankton in the future coastal ocean. Biogeosciences, 10 (11): 7525-7535. 478
8. Kim, J.M., Lee, K., Shin, K., Yang, E.J., Engel, A., Karl, D.M., Kim, H.C., 2011. 479
Shifts in biogenic carbon flow from particulate to dissolved forms under high carbon 480
dioxide and warm ocean conditions. Geophysical Research Letters, 38 481
9. Kim, J.M., Lee, K., Yang, E.J., Shin, K., Noh, J.H., Park, K.T., Hyun, B., Jeong, H.J., 482
Kim, J.H., Kim, K.Y., Kim, M., Kim, H.C., Jang, P.G., Jang, M.C., 2010. Enhanced 483
production of oceanic dimethylsulfide resulting from CO2-induced grazing activity in
484
a high CO2 world. Environmental Science & Technology, 44 (21): 8140-8143.
485
10. Losh, J.L., Morel, F.M.M., Hopkinson, B.M., 2012. Modest increase in the C:N ratio 486
of N-limited phytoplankton in the California Current in response to high CO2. Marine
487
Ecology Progress Series, 468 31-42. 488
11. Yoshimura, T., Sugie, K., Endo, H., Suzuki, K., Nishioka, J., Ono, T., 2014. Organic 489
matter production response to CO2 increase in open subarctic plankton communities:
490
Comparison of six microcosm experiments under iron-limited and -enriched bloom 491
conditions. Deep-Sea Research Part I-Oceanographic Research Papers, 94 1-14. 492
12. Endo, H., Yoshimura, T., Kataoka, T., Suzuki, K., 2013. Effects of CO2 and iron
493
availability on phytoplankton and eubacterial community compositions in the 494
northwest subarctic Pacific. Journal of Experimental Marine Biology and Ecology, 495
439 160-175. 496
13. Endo, H., Sugie, K., Yoshimura, T., Suzuki, K., 2015. Effects of CO2 and iron
497
availability on rbcL gene expression in Bering Sea diatoms. Biogeosciences, 12 (7): 498
2247-2259. 499
M
AN
US
CR
IP
T
AC
CE
PT
ED
34 14. Sugie, K., Endo, H., Suzuki, K., Nishioka, J., Kiyosawa, H., Yoshimura, T., 2013. 500Synergistic effects of pCO2 and iron availability on nutrient consumption ratio of the
501
Bering Sea phytoplankton community. Biogeosciences, 10 (10): 6309-6321. 502
15. Hama, T., Kawashima, S., Shimotori, K., Satoh, Y., Omori, Y., Wada, S., Adachi, T., 503
Hasegawa, S., Midorikawa, T., Ishii, M., Saito, S., Sasano, D., Endo, H., Nakayama, 504
T., Inouye, I., 2012. Effect of ocean acidification on coastal phytoplankton 505
composition and accompanying organic nitrogen production. Journal of 506
Oceanography, 68 (1): 183-194. 507
16. Mélançon, J., Levasseur, M., Lizotte, M., Scarratt, M., Tremblay, J.É., Tortell, P., 508
Yang, G.P., Shi, G.Y., Gao, H., Semeniuk, D., Robert, M., Arychuk, M., Johnson, K., 509
Sutherland, N., Davelaar, M., Nemcek, N., Peña, A., Richardson, W., 2016. Impact of 510
ocean acidification on phytoplankton assemblage, growth, and DMS production 511
following Fe-dust additions in the NE Pacific high-nutrient, low-chlorophyll waters. 512
Biogeosciences, 13 (5): 1677-1692. 513
17. Hama, T., Inoue, T., Suzuki, R., Kashiwazaki, H., Wada, S., Sasano, D., Kosugi, N., 514
Ishii, M., 2016. Response of a phytoplankton community to nutrient addition under 515
different CO2 and pH conditions. Journal of Oceanography, 72 (2): 207-223.
516
18. Endo, H., Sugie, K., Yoshimura, T., Suzuki, K., 2016. Response of spring diatoms to 517
CO2 availability in the Western North Pacific as determined by next-generation
518
sequencing. PLoS ONE, 11 (4): e0154291-e0154291. 519
19. Lee, Y., Kumar, K.S., Lee, K., Shin, K., Park, K.-T., Yang, E.J., Shin, K.-H., 2016. 520
Effects of elevated CO2 concentrations on the production and biodegradability of
521
organic matter: An in situ mesocosm experiment. Marine Chemistry, 183 33-40. 522
20. Park, K.-T., Lee, K., Shin, K., Yang, E.J., Hyun, B., Kim, J.-M., Noh, J.H., Kim, M., 523
Kong, B., Choi, D.H., Choi, S.-J., Jang, P.-G., Jeong, H.J., 2014. Direct linkage 524
between dimethyl sulfide production and microzooplankton grazing, resulting from 525
prey composition change under high partial pressure of carbon dioxide conditions. 526
Environmental Science & Technology, 48 (9): 4750-4756. 527
21. Biswas, H., Jie, J., Li, Y., Zhang, G., Zhu, Z.Y., Wu, Y., Zhang, G.L., Li, Y.W., Liu, 528
S.M., Zhang, J., 2015. Response of a natural phytoplankton community from the 529
Qingdao coast (Yellow Sea, China) to variable CO2 levels over a short-term
530
incubation experiment. Current Science, 108 (10): 1901-1909. 531
22. Engel, A., Zondervan, I., Aerts, K., Beaufort, L., Benthien, A., Chou, L., Delille, B., 532
Gattuso, J.P., Harlay, J., Heemann, C., Hoffmann, L., Jacquet, S., Nejstgaard, J., 533
Pizay, M.D., Rochelle-Newall, E., Schneider, U., Terbrueggen, A., Riebesell, U., 534
2005. Testing the direct effect of CO2 concentration on a bloom of the
535
coccolithophorid Emiliania huxleyi in mesocosm experiments. Limnology and 536
Oceanography, 50 (2): 493-507. 537
23. Delille, B., Harlay, J., Zondervan, I., Jacquet, S., Chou, L., Wollast, R., Bellerby, 538
R.G.J., Frankignoulle, M., Borges, A.V., Riebesell, U., Gattuso, J.P., 2005. Response 539
of primary production and calcification to changes of pCO2 during experimental
540
blooms of the coccolithophorid Emiliania huxleyi. Global Biogeochemical Cycles, 19 541
(2): 542
24. Allgaier, M., Riebesell, U., Vogt, M., Thyrhaug, R., Grossart, H.P., 2008. Coupling of 543
heterotrophic bacteria to phytoplankton bloom development at different pCO2 levels: a
544
mesocosm study. Biogeosciences, 5 (4): 1007-1022. 545
25. Antia, A.N., Suffrian, K., Holste, L., Müller, M.N., Nejstgaard, J.C., Simonelli, P., 546
Carotenuto, Y., Putzeys, S., 2008. Dissolution of coccolithophorid calcite by 547
microzooplankton and copepod grazing. Biogeosciences Discuss., 2008 1-23. 548