HAL Id: tel-01090575
https://tel.archives-ouvertes.fr/tel-01090575
Submitted on 3 Dec 2014
HAL is a multi-disciplinary open access archive for the deposit and dissemination of sci-entific research documents, whether they are pub-lished or not. The documents may come from teaching and research institutions in France or abroad, or from public or private research centers.
L’archive ouverte pluridisciplinaire HAL, est destinée au dépôt et à la diffusion de documents scientifiques de niveau recherche, publiés ou non, émanant des établissements d’enseignement et de recherche français ou étrangers, des laboratoires publics ou privés.
and acidification in the NW Mediterranean Sea
Laure Maugendre
To cite this version:
Laure Maugendre. Response of plankton communities to ocean warming and acidification in the NW Mediterranean Sea. Oceanography. Université Pierre et Marie Curie - Paris VI, 2014. English. �NNT : 2014PA066286�. �tel-01090575�
Université Pierre et Marie Curie
Ecole doctorale 129
Laboratoire d’Océanographie de Villefranche – Equipe B&B
Response of plankton communities
to ocean warming and acidification in the
NW Mediterranean Sea
Par Laure Maugendre
Thèse de doctorat en Océanographie Biologique
Dirigée par Frédéric Gazeau et Jean-Pierre Gattuso
Présentée et soutenue publiquement le 31 Octobre 2014
Devant un jury composé de :
Patrizia Ziveri, Professor, Universidad Autonoma de Barcelona (reviewer) Emilio Marañon, Associate Professor, Universidad de Vigo (reviewer) Jack Middelburg, Professor, Universiteit Utrecht (examineur)
Stéphane Blain, Professor, Université Pierre et Marie Curie (examineur) Frédéric Gazeau, Research Scientist at CNRS (co-director)
Université Pierre et Marie Curie
Ecole doctorale 129
Laboratoire d’Océanographie de Villefranche – Equipe B&B
Réponse de communautés planctoniques au
réchauffement et à l’acidification de l’océan en
Méditerrannée du Nord-Ouest
Par Laure Maugendre
Thèse de doctorat en Océanographie Biologique
Dirigée par Frédéric Gazeau et Jean-Pierre Gattuso
Présentée et soutenue publiquement le 31 Octobre 2014
Devant un jury composé de :
Patrizia Ziveri, Professeur, Université Autonome de Barcelone (rapporteur) Emilio Marañon, Professeur Associé, Université de Vigo (rapporteur) Jack Middelburg, Professeur, Université de Utrecht (examinateur)
Stéphane Blain, Professeur, Université Pierre et Marie Curie (examinateur) Frédéric Gazeau, Chargé de recherche au CNRS (co-directeur)
Plankton plays a key role in the global carbon cycle. It is therefore important to project the evolution of plankton community structure and function in a future high-CO2 world. Several experimental results reported at the community level have shown increased rates of primary production as a function of increasing pCO2 and few multi-driver experiments have been performed. However, the great majority of these experiments have been performed under high natural or nutrient-enriched conditions and very few data are available in areas with naturally low levels of nutrient and chlorophyll i.e. oligotrophic areas such as the Mediterranean Sea, although they represent a large and expanding part of the ocean surface.
Several approaches have been used during this thesis to investigate the effects of ocean warming and acidification on plankton communities in the NW Mediterranean Sea. One approach, restricted to the investigation of ocean acidification effects alone, was the use of mesocosms. In the Bay of Calvi (experiment #1; summer 2012 during 22 days), the community was very efficient in recycling nutrients and showed important regenerated production while in the Bay of Villefranche (experiment #2; winter/spring 2013 during 11 days) the community was characterized by a more autotrophic state and larger new production. A third experiment was set-up to investigate the combined effects of ocean acidification and warming in small containers in the Bay of Villefranche (experiment #3; March 2012; post-bloom conditions).
All experiments were conducted under low nutrient conditions with communities dominated by small species (e.g. haptophytes, cyanobacteria, chlorophytes). During the third experiment, biomass of populations decreased throughout the experiment (12 days), except cyanobacteria (mostly Synechococcus spp.) that significantly increased during that period. This increase was even more pronounced under elevated temperature, albeit the combination with elevated pCO2 tended to limit this effect. For the three experiments, ocean acidification alone had no effect on any of the metabolic processes, irrespective of the methods used (O2 -LD, as well as 18O, 13C and 14C labelling) while during the multi-driver experiment #3, ocean warming led to enhanced gross primary production as measured by the 18O labelling technique. Specific biomarkers, polar lipid fatty acids, were used in combination with 13C labelling to assess group primary production rates. This confirmed that ocean acidification alone did not favour any phytoplankton group under our experimental conditions.
Based on our findings and on an extensive literature review, it appears that most (57 %) of the experiments performed to date have shown no effect of ocean acidification alone while ocean warming seem to have an effect on plankton composition and production. Furthermore, plankton biomass in ecosystems dominated by small phytoplankton species appears insensitive to elevated CO2. It remains, for the moment, impossible based on these findings to provide a general concept on the effect of ocean acidification on plankton communities. However, it appears that ocean acidification will likely not lead to increased biomass and primary production rates for most communities, as it was previously anticipated. Furthermore, although warming will likely lead to increased primary production, it appears that small species with a low capacity for export will be favoured. If this proves to be a widespread response, plankton will not help mitigating atmospheric CO2 increase through an enhancement of the biological pump.
Key words: ocean acidification, ocean warming, plankton community, primary
Le plancton a un rôle crucial dans le cycle du carbone. Il est donc primordial de projeter son évolution dans le contexte de changement climatique. Une partie des résultats rapportés au niveau des communautés planctoniques montrent une stimulation de la production primaire avec l’augmentation de concentration en CO2 et très peu d’expériences combinant plusieurs facteurs ont été faites. Qui plus est, les expériences ont été réalisées majoritairement dans des conditions naturellement élevées ou enrichies en sels nutritifs et très peu de données existent dans les zones naturellement pauvres en nutriments et chlorophylle a, c’est à dire dans les zones oligotrophes telles que la mer Méditerranée, bien que ces régions représentent une surface importante et en expansion de la surface de l’océan.
Plusieurs approches ont été utilisées au cours de cette thèse pour étudier les effets du réchauffement et de l’acidification de l’océan sur des communautés planctoniques dans le NO de la Méditerranée. Une des approches, restreinte à l’effet de l’acidification seule, a été l’utilisation de mesocosmes. En Baie de Calvi (expérience #1; été 2012 sur 22 jours) la communauté étudiée présentait un efficace processus de recyclage des sels nutritifs ainsi qu’une production régénérée importante alors que dans le Baie de Villefranche (expérience #2; hiver/printemps 2013 durant 11 jours) la communauté était caractérisée plutôt par un système autotrophe et par une production nouvelle dominante. Une troisième expérience a été réalisée pour étudier les effets synergétiques de l’acidification et du réchauffement de l’océan (expérience #3; March 2012; post-bloom).
Toutes les expériences ont ainsi été menées dans des conditions de faibles concentrations en sels nutritifs avec des communautés dominées par des petites espèces phytoplanctoniques telles que des haptophytes, cynaobacteries et chlorophytes. Lors de l’expérience #3, toutes les populations ont décliné au cours de l’expérience (12 jours) à l’exception des cyanobactéries (principalement Synechococcus spp.) qui ont significativement augmenté durant cette période. Cette augmentation était d’autant plus prononcée dans les conditions de température plus élevée, bien que l’augmentation concomitante de CO2 ai eu tendance à limiter cet effet. Pour les trois expériences, l’acidification de l’océan seule n’a pas montré d’effet sur les taux métaboliques quelque soit la méthode utilisée (O2-LD, marquage au 18O, 13C et 14C) alors que durant l’expérience #3, les conditions élevées en température ont favorisé la production brute déterminée par la méthode de marquage 18O. Des biomarqueurs spécifiques, les acides gras des lipides polaires, utilisés de façon combinée avec du marquage au 13C a permis la détermination des productions primaires par groupe. Ceci a confirmé que l’acidification de l’océan seule n’a pas particuliérement favorisé un groupe phytoplanctonique par rapport à un autre dans nos conditions expérimentales.
Basé sur nos résultats et sur une revue de littérature, il apparait que la plupart des expériences (57 % des études) réalisées jusqu’à maintenant n’ont pas montré d’influence notoire de l’acidification de l’océan seule sur les communautés planctoniques, alors que le réchauffement de l’océan semble avoir plus d’effet sur la composition et la production planctonique. De plus, la biomasse dans les écosystèmes dominés par des petites espèces de phytoplancton semble être insensible à l’augmentation de CO2. A l’heure actuelle, il est impossible, basé sur ces résultats, de fournir un concept général de l’effet de l’acidification de l’océan sur les communautés planctoniques. Cependant il semble que l’acidification n’augmentera pas la biomasse et la production primaire pour la majorité des communautés. Qui plus est, bien que le réchauffement de l’ocean pourrait augmenter la production primaire, il semble que les petites expèces présentant de faibles capacités d’export pourraient être favorisées. Si cela s’avére être une réponse générale, le plancton pourrait ne pas participer à l’atténuation de l’augmentation de CO2 atmosphérique par une plus forte pompe biologique.
Mot-clés: acidification de l’océan, réchauffement de l’océan, communauté
A Pierre Rabhi, To Pierre Rabhi,
“Dare is to lose foot momentarily, not to dare is to lose oneself.”
« Oser c’est perdre pied momentanément, ne pas oser c’est se perdre soi-même. »
Kierkegaard
My gratitude goes first to my directors Frédéric Gazeau and Jean-Pierre Gattuso. Thanks for your supervision, for the opportunity you’ve given to me of learning more about the ocean and research in academia, and many thanks for your patience with my English writing style.
I thank Toby Tyrrell and Jack Middelburg for having been in my PhD committees. Your knowledge’s have been precious for the scientific realisation of the thesis. Cécile Guieu, thanks for having been part of my committee, your scientific contribution has been important in this thesis but also the personal exchanges we have had, has enriched me. Thanks to Karline Soetaert for accepting the collaboration between our laboratories and sharing your knowledge.
As all experimental research work can’t be realise without assistant engineer and technician, thanks to: Sophie M. for the flow cytometry analyses and many discussions, Samir A. it has been a great pleasure to share the 2 mesocosms mission with you. Thanks to MEK for the radioactive paper work (a big deal!). And Amélie C. for your efficient help with the last MedSeA samples! Thanks to the eFOCE team: Paul Mahacek and Erin Cox (as well as the numerous internships). I wish all the best in the future project in Europe and/or USA. Plenty of thoughts to Ella, Fanny, the Aurélies, Maïa and Cécile for sharing our great tucked office where few people dare to come! Many thanks to Sakina for your many advices and discussions. A big thanks to Margaux for all the work provided during the internship, I wish you to find rapidly a position. Big thanks to the PhD candidates met in the lab: Anto, Justine, Robin, Fabio, Mathieu, Hubert…. As well as the post-doc, sailors, permanent and non-permanent position person that I’ve met in the laboratory: Martine, Martin, Martina, Laurent, Francis, the Amélies, Nathalie…. A big thank to the LOV administration
thesis. Thank you for managing the shipment of the sample in catastrophe, the multiple train and plane tickets.
The thesis has been part done in a small village in Zeeland, Yerseke capital of the mussels. This small village helped me to calm down as well as recharge to face up the French Riviera again. I first thank Anna De Kluijver for teaching me the secret of manipulating 13C and the email support for data analysis. Thanks to Marco H for leaving me access to the analytical lab in Yerseke. Pieter the PLFA extractions made me crazy but I’m very thankful for the place you gave in the lab. Finally Peter, thanks for sharing your instruments and manage to analyse the 200 samples with master hand. I also thank you for the general discussion about life, place of science, men vs women and harvesting piece of land. And a stay in Yerseke also mean to be in the Keete, the guesthouse, I thanks all the inhabitant I had the opportunity to meet: Kris, Laurine, Tadao (for scientific support also !), Nemo, Helene, Laura, …
There is one person who doesn’t belong to the lab but to whom I how a lot, Ann Hughes. Your yoga teachings have brought me both morally and physically. Words are not just enough to express my gratitude. And as we were a group for practice, thank to all the yogi students.
And I will not be there without my parents, sister and family. I thank them for trusting me and let me build my studies at university as I felt. Thank you for the remote support and small packages full of biscuit from Brittany!
Ronan you were there every day (even remotely!). You allowed me to keep going in this long duration experience and especially get myself to see everything that the thesis can teach us in addition to scientific aspects. Without you I would not have completed this work in a such positive mindset!
Bien que cette thèse ai été écrite en anglais, je tenais à ce que mes remerciements apparaissent aussi en français, ma langue maternelle qui permet d’exprimer avec plus de justesse ce que j’ai vécu au cours de ces 3 années. Pour moi faire de la recherche est avant tout une histoire entre des individus, il m’est très important d’exprimer ma gratitude et remerciements envers de nombreuses personnes.
Ma gratitude va en premier lieu vers mes directeurs Frédéric Gazeau et Jean-Pierre Gattuso. Merci à Fred de m’avoir suivi au plus près et d’avoir survécu à mon anglais ! Merci de m’avoir donné l’opportunité de faire cette thèse, pour en apprendre toujours plus sur la mer (surtout la Méditerranée, bon vivement que je retrouve les marées quand même !).
Je remercie également Toby Tyrrell et Jack Middelburg pour avoir été membre de mon comité de thèse. Vos connaissances ont été précieuses pour la réalisation scientifique de cette thèse ainsi que pour me redonner confiance. Merci à Karline Soetaert et tous les chercheurs du NIOZ qui ont accepté la collaboration et aidé sur cette thèse.
Je souhaite remercier tous les chercheurs du LOV avec qui j’ai pu interagir. Remerciements spéciaux à Cécile Guieu pour avoir été dans mon comité, tu as été un apport scientifique important et bonne source de remise en confiance. Merci à Cécile chef de mission qui a su faire la part entre le boulot et la vie de tous les jours en Corse, ainsi que les séances de yoga sur le toit de la station de Stareso!
Je remercie également le directeur de l’OOV Gaby Gorsky et son adjoint Rodolphe Lemée ainsi qu’Antoine Sciandra directeur du LOV. Vous m’avez appris sur les aspects plus politiques et administratifs du laboratoire. Merci d’avoir été à l’écoute et d’avoir répondu à mes sollicitations en tant que représentante des étudiants.
Comme tout travail de recherche ne peut pas se faire sans ITA, un très grand merci à ceux de l’ex-équipe 4 puis B&B du LOV. Merci Sophie M pour les échantillons de cyto et des discussions autour du travail en labo, … Samir, ça a été un grand plaisir de partager les 2 missions MedSeA mesocosmes avec toi et pour tes fous rires qui raisonnent dans la Vieille Forge! Merci également à MEK pour la galère des paperasses de radioactivité et Amélie C. pour les derniers échantillons trappes à sédiment.
Mathieu, Hubert,…. La liste est longue. Remercîments très chaleureux à l’équipe organisatrice de la 1ère Journée des Jeunes chercheurs de l’OOV ! Plein de pensées aux post-doc, marins et personnel permanent et non permanent croisés : Martine, Matine, Micka, Jean-Yves, Francis, David, Nathalie, les Amélies, …Merci à Paul, Erin et Arnaud de eFOCE et bonne continuation et bon courage pour la suite.
Un très grand merci à l’équipe administrative du LOV : Isabelle, Linda et Corinne. Vous avez été d’un support indispensable à cette thèse. Merci pour avoir géré les envois catastrophe d’échantillons, d’avoir géré les multiples billets de train et avion !
Cette thèse a été en partie faite dans un petit village de Yerseke, en Zeeland. Les périodes de calme, dans cette capitale de la production de moule, m’ont permis de me reposer et recharger pour affronter à nouveau la Côte d’Azur. Je remercie en premier Anna De Kluijver qui m’a tout enseigné sur le carbone 13 et dont la thèse m’a été d’un grand support ! Merci à Marco Houtekamer pour m’avoir laissé l’accès à la plateforme d’analyse de Yerseke. Pieter, les extractions des lipides m’ont rendu folle mais je suis reconnaissante de la place laisser dans le laboratoire (enfin la hotte pour l’extraction des lipides principalement!). Une dernière personne que je dois chaleureusement remercier est Peter, merci d’avoir partagé tes « joués », on a formé une bonne équipe quand j’arrivais avec 200 échantillons. Je te remercie également pour toutes les discussions sur la vie, la place de la science, homme vs. Femme et cultiver un bout de terre.
Un séjour à Yerseke est toujours associé à la maison d’hôte « Keete » et je remercie tous les habitants rencontrés : Kris, Laurine, Tadao, Nemo, ... Ainsi que Hélène et Laura pour m’avoir dépanné quand la Keete avait trop de succès !
Je dois aussi remercier les personnes qui ont fait partie de l’histoire de cette thèse. Ella, Fanny, les Aurélies, Maïa et Cécile pour avoir partagé notre super bureau bien caché jusqu’où peu de personnes osent venir ! Grand Merci à Sakina pour tes multiples conseils et discussions. Je garderai un très bon souvenir de la promo M2 UPMC de l’année 2012-2013. Un très grand merci à Margaux, tes scripts R m’auront servis jusqu’au bout ! Bonne chance à toi et j’espère que tu trouveras ce qui te conviens le mieux le plus rapidement possible.
Ann A. Hugh. Tes enseignements du yoga m’ont énormément apporté aussi bien sur le plan moral que physique (et oui le yoga peut être physique !). Les mots ne sont pas assez justes pour t’exprimer ma gratitude. Je tacherai de garder l’ouverture du cœur que tu m’as enseigné. Et comme nous étions un groupe à pratiquer, merci à toutes (désolé Malik, le féminin l’emporte cette fois !) les autres élèves yogi.
Et je n’en serai pas là sans mes parents et ma famille. Je les remercie de m’avoir fait confiance et laisser faire mon parcours universitaire comme je le sentais. Merci de votre soutien à distance et des petits paquets de « bretonneries » qui nous ont bien remonté le moral ! Il me reste encore un long chemin à faire avec vous mais merci de m’avoir laissé réaliser ce rêve de gosse : faire de l’océanographie !
Il reste une dernière personne à remercier : Ronan. Tu as été là au quotidien (même à distance !) tu m’as permis de tenir le coup dans cette expérience à longue durée et surtout tu m’auras fais voir tout ce que la thèse peut nous apprendre en plus des aspects scientifiques. Sans toi je n’aurais pas pu aboutir à ce travail avec un état d’esprit si positif (même à 2h26 du matin !) et avoir acquis autant de recul sur le milieu de la recherche. Merci de m’aider et soutenir dans ce métier en étant curieux, en me posant des questions pour m’aider à reformuler ou à creuser certains aspects. Merci pour toutes les attentions et la gestion du quotidien quand on était à Nice, je réalise à quel point tu as du prendre sur toi pour supporter tous mes déplacements et absences. Merci 1000 fois de m’avoir laissé faire avec passion cette thèse.
MISTRALSHMERMEX% French% programme,% the% Local% Authorities% Corsica,% Water% Agency% RhôneHMéditerranéeHCorse.%%
The% project% received% also% support% of% the% European% project% EPOCA% (grant% agreement% 211384)%and%eFOCE%project%funded%by%BNP%Paribas.% % The%thesis%was%realised%in%collaboration%with%the%NIOZ%Royal%Institute%for%Sea%Research% (Yerseke%laboratory,%The%Netherlands).% % The%thesis%has%been%supported%by%a%grant%from%the%French%Ministry%if%Higher%Education% and%Research.% % % % % % % % % % % % % % %
BATS:&Bermuda&Atlantic&Time2series&Station& CCM:&Carbon&Concentration&Mechanism& CMIP5:&Coupled&Model&Intercomparison&Project&(201022014)& CR&:&Community&Respiration& CTD&:&Conductivity&Temperature&Depth& DYFAMED:&DYnamique&des&Flux&Atmospherique&en&MEDiterranée&(Dynamic&of& atmospheric&fluxes&in&Mediterranean&Sea)& EPOCA&:&European&Program&Ocean&Acidification& GPP&:&Gross&Primary&Production& HNLC&:&High&Nutrient,&Low&Chlorophyll& HOT&:&Hawaii&Ocean&Time2series& HPLC&:&High&Performance&Liquid&Chromatography& IPCC:&Intergovernmental&Panel&on&Climate&Change& LNLC&:&Low&Nutrient,&Low&Chlorophyll& MedSeA&:&Mediterranean&Sea&Acidification&European&project& MS:&Mediterranean&Sea& NCP&:&Net&Community&Production& OA&:&Ocean&Acidification& OW&:&Ocean&Warming& pCO2:&carbon&dioxide&partial&pressure& PeECE:&Pelagic&Ecosystem&CO2&Enrichment& PP&:&Primary&Production& UKOA:&United&Kingdom&Ocean&Acidification&research&programme
Chapter I-Introduction to the plankton community in the Anthropocene
1. The Anthropocene……….…..1
2. Carbon pump………..….5
3. The evolution of plankton community in the Anthropocene………..…7
3.1 Effect of ocean warming……….…7
3.2 Effect of ocean acidification………9
3.2.1 Single cells cultures………...9
3.2.2 Community studies………10
3.3 Combined effect of warming and acidification……….11
4. Oligotrophic areas under anthropogenic perturbation………...13
5. Objectives and experimental approaches followed in this thesis………..15
Chapter II-Ocean acidification and plankton metabolism in LNLC 1. Context of mesocosm experiments………...………….17
1.1 Mesocosms acidification and sampling……….17
1.2 Main results of Corsica mesocosm experiment……….…19
1.3 Main results of Villefranche mesocosm experiment……….…25
2. No effect of ocean acidification on planktonic metabolism in the NW oligotrophic Mediterranean Sea: results from two mesocosm studies……….28
2.1 Introduction………...30
2.2 Material and Method……….32
2.2.1 Study sites and experimental set-up………..32
2.2.2 Irradiance……….…..32
2.2.3 Oxygen light-dark method……….33
2.2.4 GPP-18O method………..…..33
2.2.5 14 C primary production………..34
2.2.6 Data analysis, statistics and data availability……….35
2.3 Results………...35
2.3.1 Summer conditions (Bay of Calvi)………35
2.3.2 Winter-spring conditions (Bay of Villefranche)………39
1. Preambule………...………..50
2. Carbon-13 labelling studies show no effect of ocean acidification on Mediterranean plankton communities………..….51
2.1 Introduction………...53
2.2 Material and Method……….55
2.2.1 Study sites, experimental set-up and sampling………...55
2.2.2 Laboratory analysis……….56 2.2.3 Data analysis………...56 2.2.4 Model………..58 2.2.5 Statistics………..59 2.3 Results………...59 2.3.1 Bay of Calvi………59 2.3.2 Bay of Villefranche………65 2.4 Discussion……….70
Chapter IV-Combined effects of temperature and pCO2 increase on a plankton community Effect of ocean warming and acidification on a plankton community in the NW Mediterranean Sea……….74
Supplement Material……….86
Chapter V-Synthesis and general discussion………87
Conclusions and perspectives…..………..……….99
References………...………...101 Appendix
Chapter I-Introduction to the plankton community in the Anthropocene
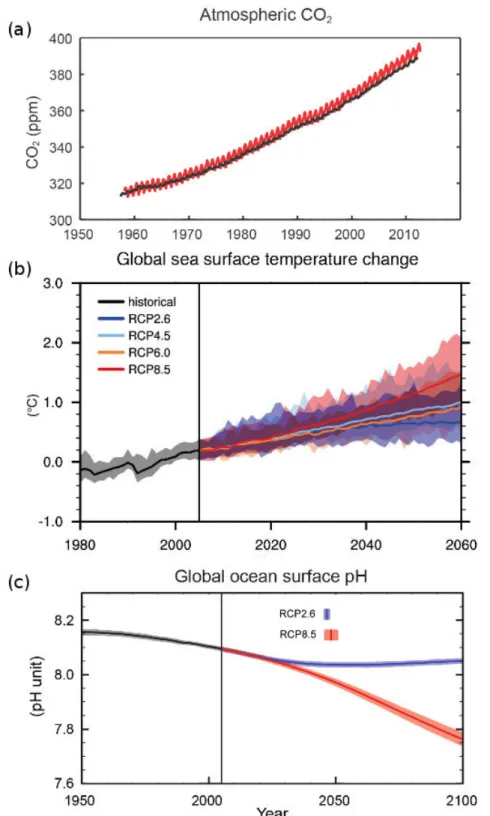
Figure I-1. Last fifty years global climate change indicators a) continuous atmospheric CO2
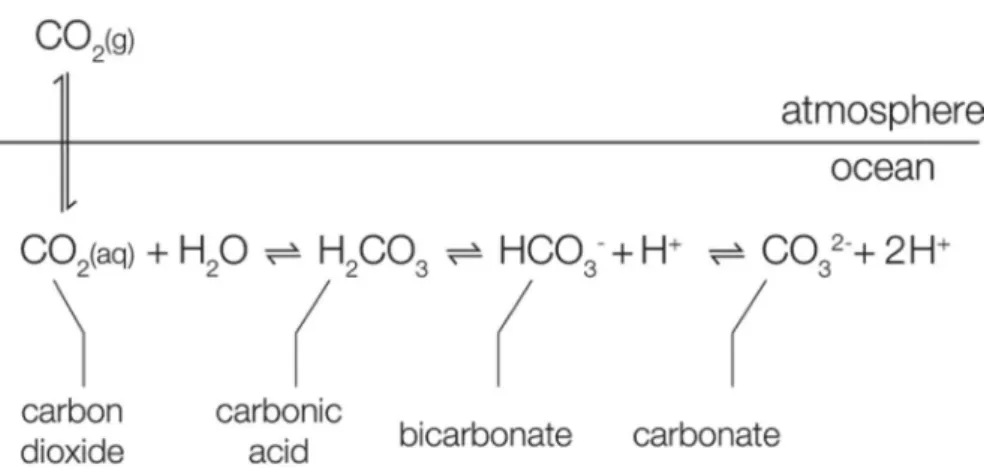
concentration increase from the time series of Mauna Loa (Hawaii) in red and South Pole in black and CMIP5 model for 1950 to 2100 using different Representative Concentration Pathways (RCP) with historical data (black line) and coloured lines different RCPs (see legend in figure) for b) global sea surface temperature and c) global mean ocean surface pH decrease. Modified from IPCC 2013 report: a) Summary for Policymarkers (Figure SPM 4), b) Chapter 11 (Figure 11.19) and c) Summary for Policymarkers (Figure SPM 7)..………...2 Figure I-2. Atmosphere-Ocean CO2 exchanges and carbonate chemistry equilibrium. Source:
Rokitta (2012)……….3 Figure I-3. Bjerrum plot (temperature = 20 °C, salinity = 32) showing the distribution in percentage of total dissolved inorganic carbon (CT) of the different species as a function of pH
in total scale (pHT). Vertical line is the present ocean pHT and dashed line is pHT expected for
the end of the century (~ -0.35 pH unit) showing the shift towards more bicarbonate (HCO3
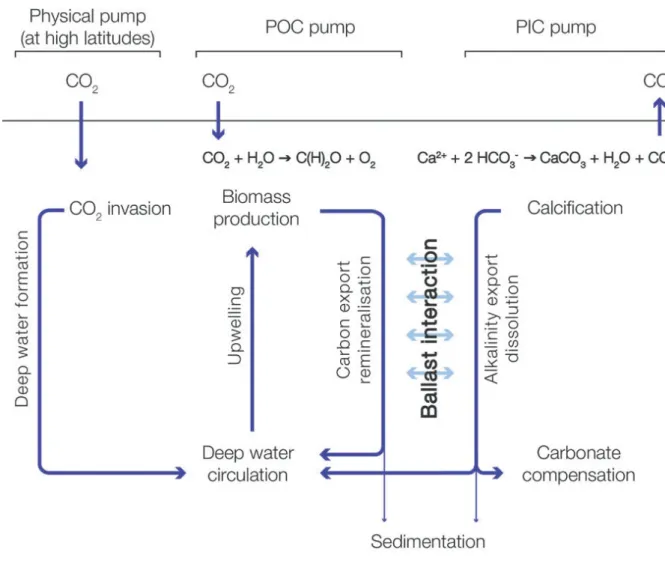
-) and CO2 and less carbonate (CO3
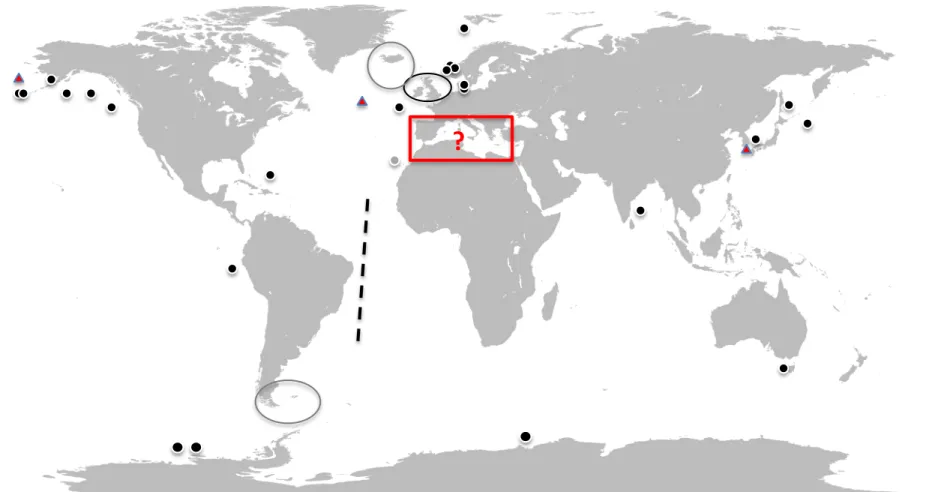
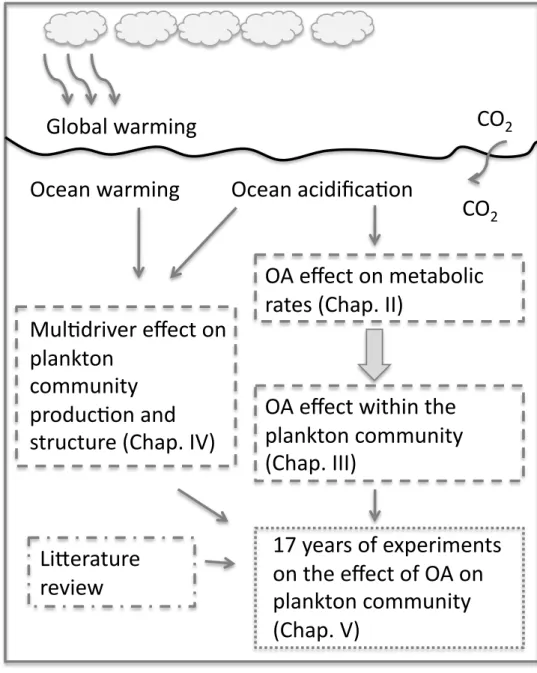
2-). Modified from Rokitta (2012)………..4 Figure I-4. Representation of the solubility pump, the biological pump and carbonate pump. From Rokitta (2012)………..6 Figure I-5. Map showing locations of experiments on ocean acidification (OA; black points) or ocean acidification and warming (OA + OW; red points) effects on the plankton community undertaken from 1990 to 2014. The black line represents transect from Hein and Sand-Jensen (1997). The grey point offshore the north-west African coast was an experiment performed in January 2014 in Canary Islands which will be rerun in winter 2014 by KOSMOS team (Kiel, Germany). The grey circles in the Arctic and Antarctic are the cruises of the Sea Surface consortium UKOA performed in 2011 and 2012 that are currently unpublished. The black circle is also from the UKOA cruise of June-July 2011, which will be published in a special issue of Biogeosciences. The black point in the Bermuda area was a study with a community dominated by cyanobacteria (Synechococcus and Prochlorococcus). Map source: Wikimedia common………12 Figure I-6. Diagram presenting the objective of the thesis………...16
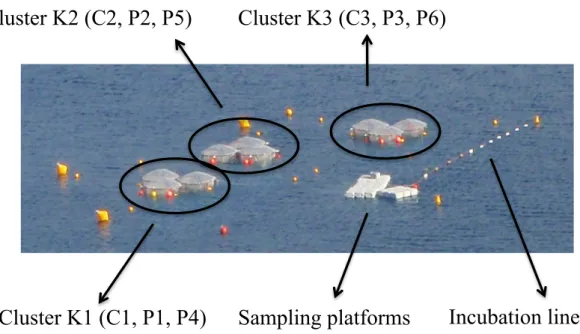
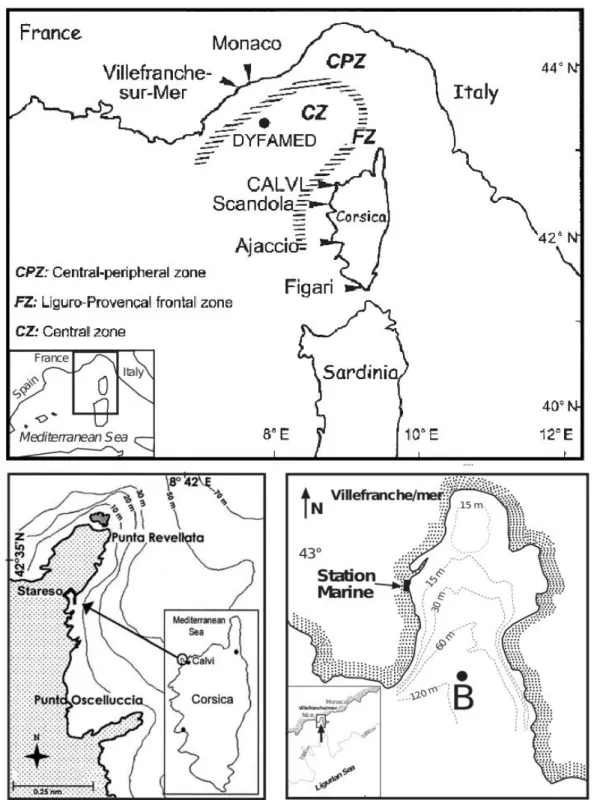
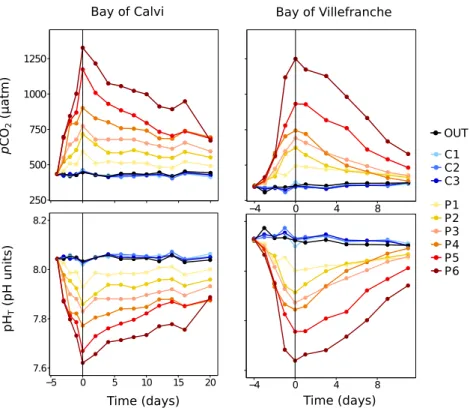
Figure II-1. Mesocosms deployed in the Bay of Calvi showing the different clusters and mesocosms (see text for more details). The platforms used to sample the mesocosms are also visible. Incubations for processes measurements (metabolic rates, nitrogen fixation, etc…) were suspended below the incubation line at the depth of mean irradiance in the mesocosms (~6 m in the Bay of Calvi and ~4 m in the Bay of Villefranche)……….18 Figure II-2. Localisation of the study sites. Upper map: general view of the area with hydrological features. Lower left map: the Bay of Calvi and localisation of Stareso marine station, mesocosms were moored in front of the station by 20 m depth. Lower right map: the Bay of Villefranche with localisation of the Laboratoire d’Océanographie de Villefranche (LOV) and Point B time series, mesocosms were moored at 20 m depth in front of LOV. Source: upper panel from Goffart et al. (2002); lower left from Jadot et al. (2002); lower right from Gomez and Gorsky (1998)….………..20 Figure II-3. Partial pressure of CO2 (pCO2; upper panel) and pH on the total scale (pHT; lower
panel) inside and outside the mesocosms deployed in the Bay of Calvi (left) and the Bay of Villefranche (right)………...22 Figure II-4. Temperature (top) and salinity (bottom) profiles in the Bay of Calvi (BC; left) and Villefranche (BV; right) in mesocosm C1. In BC, thermal stratification is clearly visible on days 5 to 8. In BV, the intrusion of seawater from outside at the end of the experiment is clearly visible in both salinity and temperature profiles………...22 Figure II-5. Chlorophyll a concentrations during the experiments in the Bay of Calvi (left) and the Bay of Villefranche (right). Data before sampling started (day 0) have been provided by CTD profiles, while high performance liquid chromatography started on day 0. Colours and shapes represent the different mesocosms……….24 Figure II-6. Net community production (NCP; a and d), community respiration (CR; b and e) and gross primary production (GPP; c and f) as a function of time in during the experiment in the Bay of Calvi (left) and in the Bay of Villefranche (right)………..37 Figure II-7. Cumulative rates of net community production (NCP; full diamonds), community respiration (CR; empty circles) as well as gross primary production estimated using the oxygen light-dark (GPP-O2; empty triangles) and the
18
O labelling techniques (GPP-18
O; asterisk) in the bay of Calvi (a, duration: 20 days) and in the bay of Villefranche (b, duration: 12 days). pCO2 is the mean value for each mesocosm during the experiment………40
Figure II-8. Irradiance at the incubation depth in the Bay of Calvi (empty triangle) and in the Bay of Villefranche (circles) as a function of time………..40 Figure II-9. Cumulative production rates estimated by the 14
C method during the experiment in the Bay of Villefranche. PP-14
C: particulate primary production; DO14
Cp: dissolved organic carbon production; TO14
C: total organic carbon production. pCO2 is the mean value for each
Figure III-1. Major biosynthesis fatty acids pathways in marine algae. Extracted from Dalsgaard et al. (2003), modified after Gurr and Harwood (1991) and Cook (1996)………..50 Figure III-2. Average ∆δ13C in the nine mesocosms deployed in a) the bay of Calvi in summer
2012 and b) the bay of Villefranche in winter/spring 2013 reported as mean ± SD for dissolved inorganic carbon (DIC; black points); particulate organic carbon in the water column (POC; black square), autotroph phytoplankton (light green square), mixotrophs (dark green points) and bacteria (orange square)………...59 Figure III-3. 13C-biomass (µmol 13C L-1) in the nine mesocosms (C1 to P6) deployed in the
Bay of Calvi in summer 2012 (left) and in the Bay of Villefranche in winter/spring 2013 (right) for dissolved inorganic carbon (DIC; upper panels) and particulate organic carbon (POC; lower panels)………..61 Figure III-4. 13C-biomass (µmol 13C L-1) in the nine mesocosms (C1 to P6) and average
(dashed line) deployed in the Bay of Calvi in summer 2012 (left) and in the Bay of Villefranche in winter/spring 2013 (right) for autotroph (upper panels), mixotrophs (middle panels) and bacteria (lower panels)………...63 Figure III-5. The model output (solid lines) fitted to the data (points) for all mesocosms deployed a) in the Bay of Calvi in summer 2012 and b) in the Bay of Villefranche in winter/spring 2013. δ13C of particulate organic carbon (POC), autotrophs, mixotrophs and
bacteria based on polar lipids fatty acid (PLFA) 13C incorporation………..64 Figure III-6. Average biomass concentration in all nine mesocosms deployed in the Bay of Calvi (summer 2012; a) and in the Bay of Villefranche (winter/spring 2013; b) for bacteria (orange full squares), mixotrophs (green full circles) and autotrophs (green empty circles)...66 Figure III-7. Cumulative net community production rates based on production rates) based on
13
C-POC incorporation (NCP-13C; µmol C L-1) as a function of averaged pCO2 levels during
the experimental periods considered, in the Bay of Calvi (full triangles) and Villefranche (empty circles)………..67 Figure III-8. Final isotopic signature (∆δ 13C ‰) of the zooplankton species Paracalanus spp.
and Oncaea spp. as a function of average pCO2 levels in each mesocosm during the
experiment in the Bay of Calvi in summer 2012………..68 Figure III-9. Cumulative 13C enrichment of the sediment trap organic particles in all
Figure 1. Temperature during the experiment. Blue: in situ temperature (Control and Ocean Acidification treatments). Red: in situ +3 °C (Ocean Warming and Greenhouse treatments)……….77 Figure 2. Concentration of inorganic nutrients as a function of time: a) silicate, b) NOx (NO3
-+ NO2
-) and c-) phosphate. Control (C-), ocean warming (OW-), ocean acidification (OA-) and greenhouse (G) treatments. Symbols are for the three replicates of each treatment. Lines: solid (C), dashed (OA), dotted (OW) and dotted-dashed (G)……….…………...80 Figure 3. Particulate organic matter and chlorophyll a as a function of time: a) particulate organic carbon (POC), b) particulate organic nitrogen (PON) and c) chlorophyll a measured by HPLC. Control (C), ocean warming (OW), ocean acidification (OA) and greenhouse (G) treatments. Symbols are for the three replicates of each treatment. Lines: solid (C), dashed (OA), dotted (OW) and dotted-dashed (G)………...80 Figure 4. Pigments (left panels) and flow cytometer counts (right panels) as a function of time: a) fucoxanthin (typically diatoms), b) 19’-hexanoyloxyfucoxanthin (19’-hex; prymnesiophytes), c) zeaxanthin (cyanobacteria), d) abundance of heterotrophic prokaryotes, e) abundance of viruses and f) abundance of Synechococcus. Control (C), ocean warming (OW), ocean acidification (OA) and greenhouse (G) treatments. Symbols are for the three replicates of each treatment. Lines: solid (C), dashed (OA), dotted (OW) and dotted-dashed (G)……….81 Figure 5. Community metabolism as a function of time: a) net community production (NCP-O2), b) community respiration (CR-O2), c) gross primary production using the O2 techniques
(GPP-O2) and d) gross primary production using the 18
O labelling technique (GPP-18
O). Control (C), ocean warming (OW), ocean acidification (OA) and greenhouse (G) treatments. Symbols are for the three replicates of each treatment. Lines: solid (C), dashed (OA), dotted (OW) and dotted-dashed (G)………82 Figure 6. Concentrations of labelled a) dissolved inorganic carbon (DIC) and b) particulate organic carbon (POC) expressed in µmol C L-1
. Control (C), ocean warming (OW), ocean acidification (OA) and greenhouse (G) treatments. Symbols are for the three replicates of each treatment. Lines: solid (C), dashed (OA), dotted (OW) and dotted-dashed (G)………...83 Figure' SM*IV*1.' Figure SM-IV-1. Picture of the experiment showing the two outdoor tanks on the pontoon in Villefranche-sur Mer (left) and the + 3°C with the 4 L bottles, the heater and pump for water circulation (right). ………...………86
Figure V-1. Number of studies expressed as a percentage showing a positive effect (stimulation; yellow bars), no effect (blue bars) and negative effect (inhibition; red bars) for all the studies considered. RR-chl a and RR-PP stand for response ratio of chlorophyll a and primary production respectively and the number of studies are indicated in parenthesis……93 Figure V-2. Response ratio for chlorophyll a (upper panel) and primary production (lower panel) relative to initial chlorophyll a concentration (µg L-1; log scale). The colour gradient corresponds to initial nitrogen (NOx) concentration (µmol L
-1
), black is used when no data were available………...95
Chapter II-Ocean acidification and plankton metabolism in LNLC areas
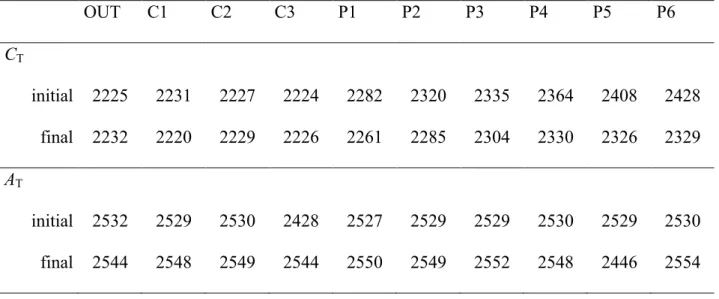
Table II-1. Initial and final concentrations of dissolved inorganic carbon (CT) and total
alkalinity (AT) in µmol kg -1
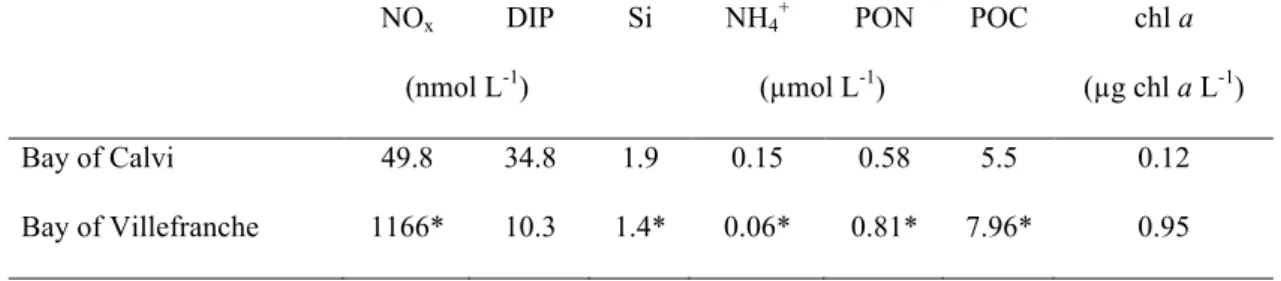
as mean integrated value over the 10 m depth in the nine mesocosms deployed in the Bay of Calvi in June/July 2012 (see text for more details). Concentrations measured in the bay (outside mesocosms; OUT) are also presented………...21 Table II-2. In situ concentrations of nitrate + nitrite (NOx) and phosphate (DIP), silicate (Si), ammonium (NH4
+
), particulate organic nitrogen and carbon (PON and POC) and chlorophyll
a (chl a) when sampling started (d0; June 24th in the Bay of Calvi and February 21st in the Bay of Villefranche. When data at d0 were not available, values have been measured on February 22nd
(d1; *)………....24 Table II-3. Initial and final concentrations of dissolved inorganic carbon (CT) and total
alkalinity (AT) in µmol kg -1
as mean integrated value over the 10 m depth in the nine mesocosms deployed in the Bay of Villefranche in February/March 2013 (see text for more details). Concentrations measured in the bay (outside mesocosms; OUT) are also presented. * measured on March 4th
………..26 Table II-4. Average environmental conditions at day 0 in all mesocosms (mean ± S.D.): temperature, salinity as well as concentrations of nitrate + nitrite (NOx), inorganic phosphate (DIP) and chlorophyll a (chl a). BC refers to the Bay of Calvi (Corsica, France) and BV to the Bay of Villefranche (France). * measured on February 19th………36 Table II-5. Gross primary production estimated by the 18
O labelling technique (GPP-18
O; µmol O2 L
-1
d-1
) in the Bay of Calvi. Mean rates and associated standard errors (S.E.) are reported. For each mesocosm, the pCO2 level on day 0 and averaged over the experimental
period (20 days) are also reported (further details in Gazeau et al., in prep, a)………38 Table II-6. Particulate and dissolved primary production (PP-14C and DO14C) during the experiment in the Bay of Villefranche. Rates are reported as mean value ± S.D. µmol C L-1
. For each mesocosm, the pCO2 level on day 0 and averaged over the experimental period (12
days) are also reported (further details in Gazeau et al., in prep, a). NA indicates the absence of data and ND that no replicates were available.……….41 Table II-7. Effects of ocean acidification as observed during previous experiments under different environmental conditions. The range in nitrogen (NOx = nitrate + nitrite), phosphate (DIP) and chlorophyll a (chl a) concentrations as well as temperature (T) and the main phytoplankton groups are presented. LOD: below detection limit and ND: not determined………...48-49
Table III-1. Final ratio for the 13
C enrichment of different particulate organic compartments: bulk particulate organic carbon (POC), all phytoplankton (phyto; autotrophs + mixotrophs) and bacteria, relative to final 13
C enrichment of dissolved inorganic carbon (DIC) or phytoplankton………...62 Table III-2. Cumulative production (µmol C L-1
) in all mesocosms (C1 to P6) of fast incorporating phytoplankton species (autrotrophs), slow incorporating phytoplankton species (mixotrophs) and bacteria during the experiments in the Bay of Calvi (BC) and in the Bay of Villefranche (BV). Mean pCO2 value for the period considered (µatm)………..69
Chapter IV- Combined effects of temperature and pCO2 increase on a plankton
community
Table 1. Carbonate chemistry parameters in the control (C), ocean warming (OW), ocean acidification (OA) and greenhouse (G) treatments (average ± SD). Total alkalinity (AT) and
dissolved inorganic carbon (DIC) were measured, while the partial pressure of CO2 (pCO2)
and pHT were estimated based on DIC and AT using seacarb (see the Material and Method
section for more details)………78 Table 2. Results of the Permutational analysis of variance for selected parameters and processes………...79 Table 3. Net community production based on 13
C enrichment in the control (C), ocean warming (OW), ocean acidification (OA) and greenhouse (G) treatments (average ± SD)….83
Chapter V-Synthesis and general discussion
!
!
Chapter!I!
!
Introduction!to!the!
plankton!community!in!the!
Anthropocene!
!
!
!1. The Anthropocene
A working group of researchers of the International Union of Geological Science (IUGS) is preparing to release a report in 2016 to state whether the Earth has entered a new geological era called the Anthropocene (from anthrôpos ‘human’ and kainos ‘recent’) and, if so, when this new era was reached (Crutzen and Stoermer, 2000). Simultaneously, the Intergovernmental Panel on Climate Change (IPCC) has produced a fifth report on climate change. The conclusions of this report are clear: human activities are responsible for environmental perturbations caused by carbon dioxide (CO2) and other greenhouse gases. Furthermore, it states that emissions at an unprecedented rate are transgressing planetary boundaries for the safety of humanity (Rockstöm et al., 2009).
The definition of the Anthropocene or anthropogenic global change (i.e. changes related to human activities) cover several aspects such as land use changes, deforestation or changes in biogeochemical cycles such as nitrogen cycle but also expansion of mankind in number and exploitation of Earth’s resources (Crutzen and Stoermer, 2000). However, all those aspects of the Anthropocene cannot be presented in details in this Introduction. Here two aspects of the effect of human activities are emphasized and are specifically related to excessive CO2 emissions by human activities in the atmosphere and affecting the ocean.
Indeed, since the industrial revolution, human activities release significant amounts of CO2 to the atmosphere through burning of fossil fuel and land use changes (Figure I-1a) leading to atmospheric and ocean warming (Figure I-1b; Levitus et al., 2001). Depending on human's development and behaviour, different CO2 emission scenarios can be made and an increase of 0.6 to 5 °C in the ocean for 2100 have been established through several models, although projections are difficult due to regional and temporal (from daily to inter-annual) variability.
Besides ocean warming by heat transfer, the ocean absorbs about 25% of the CO2 emissions (Le Quéré et al., 2013). Carbon dioxide, as other gases, exchanges with its dissolved form at the ocean surface forming carbonic acid (H2CO3), a weak acid that rapidly dissociates to bicarbonate ions (HCO3-), carbonate ions (CO32-) and protons (H+; Figure I-2). The sum of seawater CO2, HCO3- and CO32-, is termed dissolved inorganic carbon (CT).
Figure I-1. Last fifty years global climate change indicators a) continuous atmospheric CO2 concentration increase from the time series of Mauna Loa (Hawaii) in red and South Pole in black and CMIP5 model for 1950 to 2100 using different Representative Concentration Pathways (RCP) with historical data (black line) and coloured lines different RCPs (see legend in figure) for b) global sea surface temperature and c) global mean ocean surface pH decrease. Modified from IPCC 2013 report: a) Summary for Policymarkers (Figure SPM 4); b) Chapter 11 (Figure 11.19) and c) Summary for Policymarkers (Figure SPM 7).
Figure I-2. Atmosphere-Ocean CO2 exchanges and carbonate chemistry equilibrium. Source: Rokitta (2012).
These chemical species are at equilibrium under specific conditions of temperature, salinity and pressure. A change in pH or CO2 alters the speciation and preponderance of the different elements. At present seawater pH (~8.1 pH units on the total scale), the major part of CT is present in bicarbonate form (91%; Figure I-3). Due to the increase in atmospheric CO2 partial pressure (pCO2), more CO2 is dissolved into the ocean, increasing the concentration of CT, CO2, HCO3- and H+ and decreasing the concentrations of CO32- and pH. This process is known as ‘ocean acidification’ (OA; Doney et al., 2009, Gattuso and Hansson, 2011). It is estimated that pH of surface waters has decreased by 0.1 pH units since 1900 and that it will decrease by an additional 0.06 to 0.34 pH units by 2100 depending on the CO2 emission scenario considered (IPCC, 2013 in Chapter 3; Figure I-1c). CO2 dissolution in the ocean is sensitive to temperature, dissolution being larger in cold than in warm waters, thus future ocean warming will decrease the capacity of the oceans to store CO2.
Figure I-3. Bjerrum plot (temperature = 20 °C, salinity = 32) showing the distribution in percentage of total dissolved inorganic carbon (CT) of the different species as a function of pH in total scale (pHT). Vertical line is the present ocean pHT and dashed line is pHT expected for
the end of the century (~ -0.35 pH unit) showing the shift towards more bicarbonate (HCO3-) and CO2 and less carbonate (CO32-). Modified from Rokitta (2012).
The rapid flow of publications on OA prompted the compilation of an expert survey by Gattuso et al. (2012) which assessed the current knowledge and confidence level for several statements regarding ocean acidification and its effect on the ocean. While the chemical process of ocean acidification is very well documented leading to very high levels of confidence, the biological and biogeochemical responses are associated with much lower confidence levels. It appears that there is a lack of knowledge regarding the response of the
plankton community to ocean acidification in various regions of the ocean, especially in the context of a concomitant warming (multi-stressors studies).
2. Carbon pump
The ocean is the largest active reservoir of carbon on Earth and absorbs about 2.6 ± 0.5 Pg C yr-1 (Le Quéré et al., 2013). Carbon uptake is controlled by two mechanisms: the solubility and biological pumps (Figure I-4). The solubility pump is the process mentioned above: CO2 dissolves in the ocean and is sequestered to the ocean interior by water masses sinking at high latitudes. The biological pump is the transport of organic matter from the surface to the deep sea. It is considered that about 50% of the global Earth primary production occurs in the ocean (Field et al., 1998), despite the fact that it represents less than 1% of the global photosynthetic biomass (Antoine et al., 1996; Behrenfeld and Falkowski, 1997). Oceanic
primary production has, therefore, a key role in carbon cycle and climate regulation.
The majority of carbon fixation in the surface layer is performed by pelagic phytoplankton, which uses CO2 and converts it to organic matter (OM) through photosynthesis (~50 PgC yr-1; Field et al., 1998). This reaction is powered by light and requires nutrients (nitrogen and phosphate being the main macro-nutrients), following the simplified photosynthetic reaction:
Nutrients + light + CO2,aq + H2O -> O2 + CH2O
In addition, the production of calcareous structures by many planktonic or benthic species in the ocean counteracts the CO2 sequestration during photosynthesis and calcium carbonate production represent about 0.8-1.4 PgCaCO3 yr-1 (Feely et al., 2004). Indeed, calcifying organisms use bicarbonate ions to build their skeleton and the production of calcium carbonate releases CO2:
Ca2+ + 2 HCO3- -> CaCO3 + H2O + CO2
The organic matter produced in the surface layers can be exported to the deep sea. However, heterotrophs (e.g. bacteria, flagellates) remineralise this OM in surface layers through respiration, consuming O2 and releasing CO2 back to seawater. Although most of the community respiration is due to bacteria, it must be stressed that part of the respiration is realised by autotrophs during both light and dark periods. It has been estimated that about 70% of the OM produced in the mixed layer is recycled while 30% is exported to the deep sea (Falkowski et al., 1998) where it is partially remineralised by bacteria. Finally, only 1-3% of the OM produced in the surface layer is definitely buried in the sediments (De La Rocha and Passow, 2007) while approximately 13-30% of the CaCO3 produced is ultimately stored in the sediment (Feely et al., 2004; Sarmiento and Gruber, 2006).
Figure I-4. Representation of the solubility pump, the biological pump and carbonate pump. From Rokitta (2012).
The surface ocean is not homogeneous in terms CO2 exchanges with the atmosphere. The solubility capacity depends on the ocean surface temperature as CO2 dissolves more in cold than warm waters. In addition, the potential for carbon sequestration also depends on the metabolic status of the plankton community in the surface mixed layer, controlled by the balance between community gross primary production (GPP) and respiration (CR), i.e. the net community production (NCP) defined as the production of organic matter after it has been respired by all plankton communities (NCP = GPP – CR, if CR is expressed as a positive process). An ecosystem is autotrophic, and potentially a CO2 sink for the atmosphere, when GPP exceeds CR (NCP > 0). Conversely, in a heterotrophic system, CR exceeds GPP (NCP < 0) with potentially a source of CO2 for the atmosphere. Primary production and respiration
can push ecosystems towards being CO2 sinks or sources. However, the ecosystem
metabolic state does not always imply a air-sea CO2 flux as it depends on the CO2
The capacity for producing organic matter in the surface layer depends on environmental conditions such as temperature, water-column structure (mixed vs. stratified), irradiance and nutrient availability. In the classical plankton food-web, described as the production of phytoplankton species grazed by zooplankton which are subsequently consumed by higher trophic levels, high nutrient concentrations are required. In addition to this food web, the microbial loop describes the use of dissolved organic carbon (DOC) released by phytoplankton (about 10-15 % of the particulate primary production; Baines and Pace, 1991) and zooplankton, as a substrate for bacterial growth and leading to the recycling of nutrients. Classic food-web and microbial loop exist as a continuum of trophic structure and the predominance of one path relative to the other depends on the nutrient availability (Legendre and Rassoulzadegan, 1995) that also influence the metabolic balance of the ecosystem. The remineralisation by bacteria is also subject to temperature control by an inverse function (Rivkin and Legendre, 2001) and therefore influences scope for carbon export to the deep-sea. Finally, the capacity for carbon sink also depends on the phytoplankton community composition as phytoplankton species with calcium carbonate (e.g. coccolithophores) or silicate (e.g. diatoms) structures have better ballast properties and are fast-sinking particles (Klaas and Archer, 2002).
3. The evolution of plankton community in the Anthropocene
The ongoing environmental perturbations such as ocean acidification and warming could have profound effects on the functioning of plankton community. As a result, the strength of the biological pump could be affected, thereby altering the carbon storage capacity of the ocean
3.1 Effect of ocean warming
Temperature exerts a positive effect on phytoplankton metabolic rates as observed in laboratory culture (Eppley, 1972) and at sea (Regaudie-de-Gioux and Duarte, 2012), although a recent study suggests that phytoplankton carbon-specific production rates mostly depend on nutrient supply rather than on temperature (Marañon et al., 2014). However, photosynthesis and respiration exhibit different sensitivities to temperature. Phytoplankton growth and photosynthesis are less affected by a temperature increase (irradiance and nutrient availability exert tighter controls) than bacterial and heterotrophic respiration (López-Urrutia et al., 2006).
Thus, warmer conditions should increase respiration and therefore altering carbon cycling by promoting heterotrophy.
However, experimental evidence for this process is still missing and contradictory results have been reported. For instance, in Kiel Fjord (Germany) the effect of temperature has been investigated during two mesocosm experiments. During the first experiment, enhanced respiration was measured in warmer treatments, diminishing the CT drawdown. Additionally, a shift toward a larger accumulation of dissolved organic carbon (DOC) (Wohlers et al., 2009) and higher C:N ratio of the dissolved organic matter (DOM) in warmer treatments (Engel et al., 2011) were found. In contrast, in the second experiment, CT uptake as well as particulate organic carbon (POC) and DOC increased in the warmer treatments (Taucher et al., 2012). The differences in CT drawdown during these two experiments were attributed to the different species of diatoms present in the community (Skeletonema costatum
vs. Dactyliosolen fragilissimus), but could also be due to differing irradiance and temperature
levels.
Plankton species have different metabolic thermal optima and a rapid change of average temperature could cause shifts in the community structure with some species benefiting from warmer conditions and adapting better than others (Lürling et al., 2013). Mesocosms and in situ data show that small species are favoured under warmer conditions (Sommer and Lengfellner, 2008; Morán et al., 2010; Peter and Sommer, 2012; Daufresne et al., 2009). This would have consequences on carbon export efficiency, as some phytoplankton species (e.g. diatoms and coccolithophores) have better ballasting properties than others. In addition, not all phytoplankton have the same food quality (lipids content and stoichiometric ratios) and therefore energy transfer capacity to higher trophic levels (zooplankton, fishes) differs (Dickman et al., 2008) with, for example, diatoms (large species) presenting better food quality than cyanobacteria (Müller-Navarra et al., 2000).
A full understanding of the effect of ocean warming on the plankton community, requires to consider both the direct effect of increased temperature on metabolic rates, and the indirect effect due to nutrient depletion in surface layers, as well as increased irradiance at high latitudes, caused by stronger stratification (Behrenfeld et al., 2006; Lewandowska et al., 2014). Indeed, satellite observations reported a decline of ~ 1% of the global median per year in surface plankton biomass during the last decade (Boyce et al., 2010). However, faster nutrient remineralisation by bacteria could offset the decrease in phytoplankton biomass by earlier bacterial activity peak after phytoplankton bloom, that tighten the coupling between phytoplankton and bacteria (Hoppe et al., 2008). Temperature is recognized as a major
parameter controlling plankton community structure and dynamics and there are still uncertainties on how the plankton community will evolve in the future warmer ocean. Finally, it is very likely that, as the efficiency of the carbon pump and its evolution in a warmer ocean seems to be closely related to nutrient regime and community composition (Boyce et al., 2010; Taucher and Oschlies, 2011), important regional variations will be observed in the coming decades.
3.2 Effect of ocean acidification
Higher levels of CO2 in seawater lead to an ocean acidification, an environmental perturbation that could also affect phytoplankton metabolism. Phytoplankton acquires dissolved inorganic carbon to produce organic matter, using CO2 as a substrate for photosynthesis despite the low affinity for CO2 of rubilose-1,5-bisphosphate carboxylase oxygenase (RuBisCO), a key enzyme involved in photosynthetic carbon fixation (Raven and Johnston, 1991) and limited diffusion capacities of CO2 in water. To overcome these limitations, marine phytoplankton have developed carbon concentrating mechanisms (CCMs; Giordano et al., 2005) to raise CO2 concentrations in the vicinity of RuBisCO involving carbonic anhydrase activities or bicarbonate transport through the cell for example (Reinfelder, 2011). An increase in CO2 would increase the diffusion of CO2 in the cells and may therefore benefit primary producers by lowering the energy cost of carbon acquisition, increasing CO2 diffusion through the cell membranes (Raven et al., 2005) and reducing CO2 leakage (Rost et al., 2006). Different CCMs have been developed by phytoplankton species varying within and among groups, it is therefore expected that organisms will be differently affected by CO2 increase, potentially causing shifts in the plankton community composition (e.g. Rost et al., 2008).
3.2.1. Single cells cultures
The majority of early laboratory experiments performed on single species have shown enhanced carbon fixation (e.g. Buitenhuis et al., 1999; see Riebesell and Tortell, 2011 for comprehensive review on this section) however some species, such as coccolithophore strains, have shown a neutral (e.g. Langer et al., 2006) or inhibitive effect under nitrate limitation (e.g. Sciandra et al., 2003). Coccolithophores have been more studied than other species for the impact of ocean acidification on calcification, with decreases in calcification rates (e.g. Riebesell et al., 2000) observed in most of the studies, although contradictory results showing neutral or enhanced calcification have also been reported (e.g.
Iglesias-Rodriguez et al., 2008). Differences in the strains used have been shown to be critical and repetitions of experiments on some strains have not always led to the same results (see Riebesell and Tortell, 2011 for details).
3.2.2. Community studies
The contradictory results obtained at the species level indicated that extrapolation from monocultures to assemblages is not straightforward. The investigation of the effect of ocean acidification at community level is therefore necessary.
Initial experimental work at the community level has reported an increase (~ 15 %) of 14
C fixation under high pCO2 conditions (Hein and Sand-Jensen, 1997) in the South Atlantic Ocean. The first large mesocosm experiments (> 10 m3) performed in the North Sea (PeECE 2001, 2003 and 2005) have shown different responses. Only one of these three experiments have shown an increase in primary production under high pCO2 conditions (Egge et al., 2009) while no change in primary production was found in the first and second experiments (Delille et al., 2005 for PeECE I; unpublished data for PeECE II, see Egge et al., 2009). Other experiments carried out in different oceanic regions, with different incubation volume, have led to increased primary production (e.g. Tortell et al., 2008) or to no effect (e.g. Tortell et al., 2002; Yoshimura et al., 2013). The recent Svalbard mesocosm experiment showed no clear trend in net community production and community respiration over the whole period (Silyakova et al., 2013; Tanaka et al., 2013), but found decreased NCP when considering only the post-bloom period. However, 14C carbon fixation increased with increasing pCO2 levels (Engel et al., 2013). In this experiment, the community response was not straightforward and possibly related to the change in community composition over the different phases (before and after nutrient addition). However, the different methods for measuring primary production did not show the same results, so the conclusions of this experiment should be regarded with caution, although they reveal the complexity of the community metabolic response to ocean acidification under different physiological states conditioned by nutrient availability.
It is thought that species with less efficient CCMs under present day CO2 concentrations should benefit more from increased CO2, while species with efficient CCMs should be less affected (Rost et al., 2008; Low-Décarie et al., 2014). Studies focusing on the effect of increased pCO2 on community composition have also shown some contradictory results, with either a shift towards more diatoms (Tortell et al., 2002; 2008), towards less silicified species and smaller species, or no change (e.g. Nielsen et al., 2012; Yoshimura et al.,
2013). In addition, Yoshimura et al. (2013) investigated the ocean acidification response at two sites in the North Pacific. In the Bering Sea, a decrease in dissolved organic carbon production at high pCO2 was found, while at the second site in the Pacific no CO2 effect was found, probably due to different community compositions.
The results and findings of the experiments performed in close-to-in-situ conditions (mesocosms or on-deck bottle incubations) have generated contradictory and ambiguous responses, failing to establish consistent responses to ocean acidification. The first hypothesis of enhanced primary production under ocean acidification, due to higher CO2 substrate availability, has been challenged in the last few years as more experiments have been performed. It seems that the response of the plankton community to ocean acidification
depends on the oceanic provinces, nutrient conditions, community composition and other unidentified processes (e.g. grazing).
3.3 Combined effects of warming and acidification
Ocean acidification and ocean warming (OW) will occur concomitantly and the interactive effects of both factors must be taken into consideration. Only few studies have reported their combined effects on plankton community. In the Bering Sea, an increase in carbon fixation under warmer conditions irrespective of pCO2 level with a shift toward smaller nanophytoplankton species was measured (Hare et al., 2007) and a similar experiment led to the same conclusions in the North Atlantic Ocean (Feng et al., 2009). Both experiments suggest a greater influence of temperature compared to pCO2, with some interactive effects. An increase in carbon fixation under combined OA and OW was observed in mesocosm experiments (Kim et al., 2013) where, despite no change in the POC concentrations, enhanced DOC production at high temperature and/or CO2 treatments (Kim et al., 2011) was measured. The bacterioplankton community structure has also been investigated under combined OA and OW using mesocosms (Lindh et al., 2013). OA alone had a limited impact, while temperature was the major driver causing shifts in species composition and synergistic effect of both factors might increase the species selection, highlighting the need to perform studies combining the two stressors. There is a distinct lack of studies on the combined effect of
OA and OW, despite it is important to know the possible interactions between these stressors and to know which driver could have the greatest impact on the plankton community in order to have realistic projections models.
Figure I-5. Map showing locations of experiments on ocean acidification (OA; black points) or ocean acidification and warming (OA + OW; red triangles) effects on the plankton community undertaken from 1990 to 2014. The black line represents transect from Hein and Sand-Jensen (1997). The grey point offshore the north-west African coast was an experiment performed in January 2014 in Canary Islands which will be rerun in winter 2014 by KOSMOS team (Kiel, Germany). The grey circles in the Arctic and Antarctic are the cruises of the Sea Surface consortium UKOA performed in 2011 and 2012 that are currently unpublished. The black circle is also from the UKOA cruise of June-July 2011, which will be published in a special issue of Biogeosciences. The black point in the Bermuda area was a study with a community dominated by cyanobacteria (Synechococcus and Prochlorococcus). Map source: Wikimedia commons.
4. Oligotrophic areas under anthropogenic perturbation
Most of the experiments discussed in the previous section were performed in relatively eutrophic conditions or with nutrient addition during the experiment and were mainly carried out in relatively cold waters (Figure I-5). However, there is an important diversity of oceanic provinces (Longhurst et al., 1995), from the less productive areas (ultra-oligotrophic) to very productive areas (eutrophic). About 50 % of primary production on Earth takes place in the ocean although more than 60 % of its surface being associated with low productivity, termed oligotrophic areas. A decreased nutrient availability and expansion of low productive
regions are projected in a high CO2 world, as enhanced thermal stratification is
expected to lead to surface layer nutrient depletion (Polovina et al., 2008; Irwin and Oliver, 2009).
Although it is important to assess the capacity of oligotrophic provinces for carbon uptake, and further storage, and its evolution under climate change, their trophic state (i.e. auto- vs heterotrophy) is still under debate (Ducklow and Doney, 2013), as to whether these areas are autotrophic (Williams et al., 2013) or heterotrophic (Duarte et al., 2013). As reviewed in the previous section, the effects of OA and/or OW on metabolic processes are still poorly understood and the biological response to climate change seems to be conditioned by the ecosystem conditions, e.g. nutrient availability, community composition. Therefore, the different biological responses in different oceanic regions must be investigated in order to gain a better understanding on the response of the global ocean to future environmental conditions. However, oligotrophic areas have been chronically under sampled with
respect to the effect of climate change.
Case study: The Mediterranean Sea
The Mediterranean Sea (MS) is considered as an oligotrophic area exhibiting a gradient from mesotrophic (western basin) to ultra-oligotrophic (eastern basin). It is semi-enclosed, warm, deep and presents higher salinity and total alkalinity levels than in the open ocean. Mediterranean waters can, therefore, absorb more CO2 than the open ocean waters. The western and eastern basins differ in their carbonate chemistry; the western basin exhibits a lower total alkalinity than the eastern basin and the opposite pattern is seen for CT (higher CT in the western than in the eastern basin). Based on satellite observations, it is estimated that the MS, as a whole, acts as a small sink of CO2 (0.24 Gt C yr-1), with the western basin acting