HAL Id: hal-01254357
https://hal.sorbonne-universite.fr/hal-01254357
Submitted on 12 Jan 2016HAL is a multi-disciplinary open access
archive for the deposit and dissemination of sci-entific research documents, whether they are pub-lished or not. The documents may come from teaching and research institutions in France or abroad, or from public or private research centers.
L’archive ouverte pluridisciplinaire HAL, est destinée au dépôt et à la diffusion de documents scientifiques de niveau recherche, publiés ou non, émanant des établissements d’enseignement et de recherche français ou étrangers, des laboratoires publics ou privés.
scenarios in a low nutrient low chlorophyll system: the
Northwestern Mediterranean Sea
Justine Louis, C. Guieu, F. Gazeau
To cite this version:
Justine Louis, C. Guieu, F. Gazeau. Nutrient dynamics under different ocean acidification scenarios in a low nutrient low chlorophyll system: the Northwestern Mediterranean Sea. Estuarine, Coastal and Shelf Science, Elsevier, 2016, �10.1016/j.ecss.2016.01.015�. �hal-01254357�
M
AN
US
CR
IP
T
AC
CE
PT
ED
1Nutrient dynamics under different ocean acidification scenarios in a
low nutrient low chlorophyll system: the Northwestern Mediterranean
Sea
Louis J.1*, Guieu C.1 and Gazeau F.1
[1] Sorbonne Universités, UPMC Univ Paris 06, CNRS, UMR 7093, LOV, Observatoire océanologique, F-06230, Villefranche-sur-mer, France
*Corresponding author: [email protected]
Highlights:
- Mesocosm experiments performed in two Mediterranean sites during two seasons - Contrasted nutrient stoichiometry in surface waters in summer and winter
- Dissolved organic pool was a large stable fraction of N and P in summer and winter - CO2 had no effect on nutrient dynamics that was mostly biologically controlled
Keywords: ocean acidification; plankton community; mesocosm experiments; nutrient dynamics; nitrogen; phosphorus; iron; stoichiometry; Oligotrophy; Mediterranean Sea
M
AN
US
CR
IP
T
AC
CE
PT
ED
2 AbstractTwo pelagic mesocosm experiments were conducted to study the impact of ocean acidification on Mediterranean plankton communities. A first experiment took place in summer 2012 in the Bay of Calvi (France) followed by an experiment in winter 2013 in the Bay of Villefranche (France) under pre-bloom conditions. Nine mesocosms were deployed: three served as controls and six were acidified in a targeted partial pressure of CO2 (pCO2)
gradient from 450 to 1250 µatm. The evolution of dissolved organic and inorganic nutrient concentrations was observed using nanomolar techniques. The experiments were
characterized by a large contribution of organic nutrients to nutrient pools and contrasting in
situ conditions with an inorganic N / P ratio of 1.7 in summer and of 117 in winter. In the Bay
of Calvi, initial conditions were representative of the summer oligotrophic Mediterranean Sea. While inorganic phosphate concentrations were depleted during both experiments, in situ inorganic nitrogen concentrations were higher in winter. However, nitrate was rapidly consumed in winter in all mesocosms during the acidification phase, leading to a decrease in N / P ratio to 13. During these first mesocosm experiments conducted in a low nutrient low chlorophyll area, nutrient dynamics were insensitive to CO2 enrichment, indicating that
nutrient speciation and related biological processes were likely not impacted. During both experiments, nitrate and phosphate dynamics were controlled by the activity of small species that are favored in low nutrient conditions. In contrast to the theoretical knowledge, no increase in iron solubility at high pCO2 was observed.
M
AN
US
CR
IP
T
AC
CE
PT
ED
3 1. IntroductionSince the beginning of the industrial era, the atmospheric carbon dioxide (CO2) level
has increased by nearly 40% (from ~280 to 390 ppm in 2011; Hartmann et al., 2013) and may reach between ~450 and ~1000 ppm by 2100 depending on the considered future emission scenario (Collins et al., 2013). As the ocean absorbs about a quarter of total anthropogenic CO2 emissions (Le Quéré et al., 2014), the increase in CO2 dissolved in seawater leads to an
increase in seawater acidity (decrease in pH). Surface ocean pH has already declined by approximately 0.1 since the beginning of the industrial era (Orr, 2005) and is expected to decrease an additional 0.06 to 0.32 by the end of this century depending on the considered CO2 emission scenario (Ciais et al., 2013). Although the chemical forms of compounds such
as macro- and micro-nutrients in the ocean are controlled by multiple environmental factors including pH, only a restricted number of studies have addressed the impact of ocean acidification on nutrient dynamics and its consequences on biological activity.
Following established theoretical equilibriums of dissolved inorganic phosphate and ammonium (NH4+) in seawater as a function of pH (i.e. Zeebe and Wolf-Gladrow, 2001), a
decrease in surface ocean pH expected to occur this century will lead to a decrease of phosphate (PO43-) concentrations by up to 80% (and increase in HPO42-) and an alteration of
the NH4+ / NH3 equilibrium. Therefore, ocean acidification could directly affect the chemical
speciation of phosphorus and nitrogen with impacts on their bioavailability and stoichiometry. In addition to pH equilibrium reactions, ocean acidification can impact biological processes and indirectly shift nutrient cycles. In the case of nitrogen, an increase in the partial pressure of CO2 (pCO2)could (1) enhance nitrogen fixation (e.g. Hutchins et al., 2007) and
(2) reduce the rate of marine nitrification (e.g. Beman et al., 2011). The alteration of the NH4+
M
AN
US
CR
IP
T
AC
CE
PT
ED
4 production and phytoplankton community structure (CIESM, 2008; Hutchins et al., 2009). For example, Romero et al. (2012) showed that waters rich in NH4+ favor the growth of smallautotrophic species and heterotrophic bacteria while NO3- mostly favor diatom growth.
The organic fraction of dissolved nutrients (dissolved organic nitrogen: DON and dissolved organic phosphorus: DOP) can represent a large source of P and N for
microorganisms in oligotrophic areas (e.g. Jackson and Williams, 1985; Karl and Bjorkman, 2002; Bronk, 2007). Regarding DOP, most of its compounds cannot be used by
phytoplankton directly, unless specific enzymes (e.g. alkaline phosphatase) are produced to hydrolyze DOP into PO43- (Holland et al., 2005; Dyhrman and Ruttenberg, 2006). These
hydrolysis reactions are sensitive to pH with the consequence that a change in pH could alter the bioavailability of DOP in seawater (Doney et al., 2009).
Furthermore, decreases in ocean pH theoretically increase the proportion of free dissolved trace metals and increase metal solubility (Millero, 1998). This would lead to substantial increases in the total bioavailable fraction of many trace elements and result in toxic concentrations for marine microorganisms (Raven et al., 2005). Several studies have shown that a decrease in ocean pH enhances the solubility of Fe(III), a form of iron that is bioavailable for phytoplankton (e.g. Liu and Millero, 2002; Millero et al., 2009). Iron speciation is largely controlled by organic complexation and photochemical processes (Breitbarth et al., 2010a and ref within). A decrease of pH below 8 favors the iron complexation with organic ligands against the precipitated form Fe(OH)3 (De Rijck and
Schrevens, 1998). The effect of ocean acidification on Fe(III)-organic complexation needs further investigations (Hoffmann et al., 2012). Shi et al. (2010) have shown that depending on the nature of the chelating agent, a pH decrease could enhance the solubility of Fe by
M
AN
US
CR
IP
T
AC
CE
PT
ED
5 maintaining Fe(III) binding and affect the chemical speciation of Fe by favoring Fe chelated by organic compounds rather than its oxy-hydroxide form (Fe(OH)3).Ligand production is facilitated by phytoplankton dissolved organic matter (DOM) production. Enhanced release of DOM with increasing pCO2 (i.e. Engel, 2002) could, as a
feedback, increase iron binding and make it more bioavailable for primary production. This has recently been shown in in situ mesocosm experiments conducted as part of the Pelagic Ecosystem CO2 Enrichment project (PeECE) in Bergen, Norway (Breitbarth et al., 2010b).
Most studies investigating the impact of ocean acidification on pelagic ecosystems have been performed in laboratories but, during the last decade, several mesocosm
experiments have been conducted, for instance as part of the PeECE project and the European Project on Ocean Acidification (EPOCA; i.e. Engel et al., 2005; Grossart et al., 2006; Schulz et al., 2008; Riebesell et al., 2013). Mesocosms offer the advantage to follow the response of pelagic communities to an environmental driver under close-to-natural environmental
conditions. The above-mentioned mesocosm experiments have been mostly performed in nutrient-replete cold waters. However, a large portion of the open ocean is characterized by low-nutrient, low-chlorophyll (LNLC) conditions. To our knowledge, no ocean acidification mesocosm study has been conducted under these limiting conditions as observed in the Mediterranean Sea.
The Mediterranean Sea is one of the most nutrient-poor waters in the world with a trophic status varying from oligotrophic-mesotrophic in the Northwestern Mediterranean to extremely oligotrophic in the eastern basin (Moutin and Rimbault, 2002; Mermex Group, 2011 and references within). The Mediterranean Sea is in general a sink for atmospheric CO2
(D'Ortenzio et al., 2008). As this region is relatively more alkaline than the open ocean, it absorbs relatively more anthropogenic CO2 and is a significant source of CO2 for the Atlantic
M
AN
US
CR
IP
T
AC
CE
PT
ED
6 ocean (Ait-Ameur and Goyet, 2006). Long-term data series of carbonate properties and ocean acidification trends in the Mediterranean Sea are scarce. However, current interpolation suggests that pH may have already declined by 0.15 in some areas of the surfaceMediterranean Sea (Touratier and Goyet, 2011).
The objective of the present study is to assess the effect of ocean acidification on nutrient (Fe, N and P) dynamics in a nutrient-depleted system, limited or co-limited by P and N availability (Tanaka et al., 2011): the Mediterranean Sea. Two mesocosm experiments have been conducted in the Northwestern Mediterranean Sea during contrasting periods in terms of biogeochemical conditions and trophic status. These experiments were conducted in the framework of European Mediterranean Sea Acidification in a Changing Climate project (MedSeA; www.medsea-project.eu). In this paper, we report on the evolution of nutrient concentrations, under both dissolved inorganic and organic forms, and discuss the potential impact of ocean acidification on nutrient dynamics in LNLC ecosystems.
M
AN
US
CR
IP
T
AC
CE
PT
ED
7 2. Material and methods2.1. Experimental setup and sampling
The first mesocosm experiment was performed in the Bay of Calvi (BC; Corsica, France) during summer (June-July 2012), and the second experiment was conducted in the Bay of Villefranche (BV; France) during winter (February-March 2013). A complete description of the sites, experimental setup, initial conditions and evolution of the core parameters is given in Gazeau et al. (submitted, this issue-a). Briefly, for each experiment, nine mesocosms (2.5 m in diameter, 12 m depth and ~50 m3 in total volume) were deployed during 20 (BC) and 11 days (BV). Mesocosm bags were made of plastic material
(polyethylene mixed with vinyl acetate) with nylon mesh to allow a maximum resistance and light penetration. In order to avoid atmospheric deposition, the top of the mesocosms were covered with UV-transparent ethylene tetrafluoroethylene (ETFE) roofs, except for periods of sampling during which the roofs were partially opened. Three unperturbed mesocosms were used as controls (C1, C2 and C3) and six mesocosms were enriched with CO2 to obtain a
gradient of pCO2 levels (P1 to P6). Targeted pCO2 levels were obtained via addition of 75 to
> 300 L of CO2-saturated water into mesocoms. A diffusing system was used to ensure a
perfect mixing of this CO2-saturated seawater inside the mesocosms. In order to minimize the
stress induced by the addition of large quantities of acid water, the acidification of the mesocosms was performed over the course of 4 days. Control mesocosms presented initial
pCO2 levels of 450 and 350 µatm in BC and BV, respectively. In BC, the six targeted elevated
pCO2 levels were P1: 550, P2: 650, P3: 750, P4: 850, P5: 1000 and P6: 1250 µatm. In BV, the
targeted levels were P1: 450, P2: 550, P3: 750, P4: 850, P5: 1000 and P6: 1250 µatm. Mesocosms were anchored in clusters of 3, each cluster containing one control mesocosm accompanied by a medium and a high pCO2 level (cluster 1: C1, P1, P4; cluster 2: C2, P2, P5
M
AN
US
CR
IP
T
AC
CE
PT
ED
8 and cluster 3: C3, P3, P6). On June 24th 2012 (in BC) and on February 21st 2013 (in BV), the targeted pCO2 levels were reached and the experiments started (day 0). Daily depth-integratedsampling (0 - 10 m) was performed using 5 L Hydro-Bios integrated water samples in the nine mesocosms and in the external environment (OUT) in order to follow the dynamics of each considered parameter in natural free waters.
Seawater samples for total alkalinity (AT; 500 mL) measurements were filtered on
GF/F membranes while samples for total inorganic carbon (CT; 120 mL) measurements were
immediately inoculated with 20 µL of a saturated solution of mercuric chloride (HgCl2). Both
parameters were analyzed within one day of collection. For pigments, 2 L of sampled seawater were filtered onto GF/F membranes. Filters were immediately frozen in liquid nitrogen and stored at -80 °C pending analysis at the Laboratoire d’Océanographie de
Villefranche (France). Samples for the determination of heterotrophic prokaryote abundances were collected every second day, immediately fixed with 0.2 µm pre-filtered 25%
glutaraldehyde (0.5% final concentration), kept at 4 °C for approximately 30 min, deep frozen in liquid nitrogen and stored at -80 °C until enumeration.
For dissolved inorganic and organic nutrients (NOx, PO43-, DFe, DON and DOP), bulk
seawater samples were collected in 1 L bottles previously rinsed 3 times with sampled seawater. Shortly after sampling, samples were filtered onto 0.2 µm polycarbonate filters (Nucleopore, Whatman) under a laminar flow bench. Filters were cleaned with a 5%
hydrochloric acid (HCl) suprapure solution for 30 min, rinsed 20 times with ultrapure water, cleaned again with 1% HCl suprapure solution for 24 h and finally rinsed and kept in
ultrapure water in a Teflon vial. After filtration, samples for NOx, PO43-, DFe, were kept in 60
mL polyethylene bottles, previously cleaned following trace-metal clean procedures (Bruland et al., 1979), and then acidified to pH < 2 with HCl ultrapure, following the recommendations
M
AN
US
CR
IP
T
AC
CE
PT
ED
9 of Pulido-Villena et al. (2010). Samples for the determination of DON and DOP were not acidified but directly irradiated (see section 2.2.2 and 2.2.3). Data for DON and DOP were not available at the end of both experiments due to an irradiation defect (BC) and bad weather conditions (BV).2.2. Analytical method
2.2.1. Carbonate chemistry, chlorophyll a and heterotrophic prokaryote abundance
AT was determined potentiometrically and CT was determined using an inorganic
carbon analyser (AIRICA, Marianda©, Kiel, Germany) coupled to an infrared gas analyser (LI-COR© 6262). More detailed analytical protocols are given in Gazeau et al. (submitted, this issue-a). All parameters of the carbonate chemistry were determined from CT, AT,
temperature and salinity using the R package seacarb (Lavigne et al., 2014). Chlorophyll a (Chla) measurements were performed by high performance liquid chromatography (HPLC, following the protocol described in Gazeau et al. (submitted, this issue-b). The abundance of free-living heterotrophic prokaryotes (HP) was estimated by flow cytometry as described in Celussi et al. (in press, this issue).
2.2.2. Dissolved inorganic phosphorus (PO43-) and dissolved organic phosphorus (DOP)
A Liquid Waveguide Capillary Cell (LWCC), made of quartz capillary tubing, was used to manually analyze PO43-. The LWCC was connected to a spectrophotometer and
measurements were performed in the visible at 710 nm. This spectrometric method is based on Murphy and Riley’s molybdenum blue method and uses two reagents: (1) a mixed reagent composed of an ammonium molybdate solution (40 g L-1 in ultrapure water) and an antimony potassium tartrate solution (3 g L-1 in ultrapure water) in 5N sulfuric acid solution, and (2) an ascorbic acid solution (18 g L-1 in 2/3 of ultrapure water and 1/3 of SDS surfactant solution; Zimmer and Cutter, 2012; Zhang and Chi, 2002). The LWCC was 2.5 m long in order to
M
AN
US
CR
IP
T
AC
CE
PT
ED
10 decrease the limit of detection to 1 nM. The repeatability and reproducibility standarddeviations were around 4.8% and 7%, respectively. Phosphate concentrations ([PO43-]) were
calculated using a calibration method in ultrapure water, following the Beer-lambert’s law, and validated by a standard addition method (tstudent = 0.988, n = 25, pvalue = 0.30, α = 0.05).
To determine DOP concentrations ([DOP]UV), samples were irradiated by ultra-violet
light (UV) using the 705 UV Digester (Metrohm). Samples were transferred into 10 mL (a total of 20 mL was irradiated for each sample) quartz tubes and irradiated during 90 min with a mercury vapor lamp, according to the method UV light photooxidation described by
Armstrong and Tibbitts (1968). With the standard molybdenum blue method of Murphy and Riley, the concentration of total dissolved phosphorus [TDP] was measured in irradiated samples. [DOP]UV was then determined by subtracting [PO43-] from [TDP].
2.2.3. Dissolved inorganic nitrogen (NOx) and dissolved organic nitrogen (DON)
The exact same protocol (and equipment) as described by Louis et al. (2015) was used to determine dissolved inorganic nitrogen concentrations. Briefly, the analysis of NOx (= NO3
-+ NO2-) was performed by a spectrometric method in the visible at 540 nm, with a 1 m
LWCC. This method is based on the colored reaction between NO2- and 2 reagents
(sulfanilamide and NED) to form a pink azo compound. Previously, samples were passed through a copperized cadmium column to reduce NO3- to NO2- and determine NOx
concentrations ([NOx]) using a calibration curve in ultrapure water. The limit of detection was
~10 nM and the reproducibility was ~6% (tested using a reference solution, CertiPUR, Merck; tstudent = 0.263, n = 7, pvalue = 0.80, α = 0.05).
Similar to DOP, DON concentrations ([DON]UV) were determined by the irradiation
UV method during which DON and all reduced inorganic ions, such as NO2-, are oxidized to
M
AN
US
CR
IP
T
AC
CE
PT
ED
11 concentration of total dissolved nitrogen [TDN] was measured, and [DON]UV was calculatedby subtracting [NOx] from [TDN].
2.2.4. Dissolved iron (DFe)
DFe concentrations were measured by flow injection with online preconcentration and chemiluminescence detection using the exact protocol, instrument, and analytical parameters as described by Bonnet and Guieu (2006). Briefly, our flow injection analysis and
chemiluminescence detection (FIA-CL) instrument is based on the method described by Obata et al. (1993). In order to quantify the low DFe concentration [DFe] in seawater,
samples (with pH adjusted to ~5) were passed through MAF-8HQ (8-quinolinol-immobilized fluoride containing metal alkoxide glass) resin column to selectively collect and
pre-concentrate DFe. After elution of DFe by a HCl solution, the eluent was mixed with a luminol solution (0.74 M), an ammonium hydroxide solution (1 M) and a hydrogen peroxide (H2O2)
solution (0.7 M). A luminescence reaction occurs between the luminol and H2O2, catalyzed
with DFe in alkaline conditions. Two distinct seawater reference materials were used to control for analytical accuracy: NASS-5 (North Atlantic Surface Seawater) and D1-508 (SAFe reference seawater) with measured [DFe] of 3.74 ± 0.19 nM and 0.65 ± 0.03 nM respectively in good agreement with consensus values (3.763 ± 0.001 and 0.67 ± 0.04 nM respectively). The repeatability and reproducibility were lower than 10%, and the detection limit was ~20 pM. Data of [DFe] are only available for the experiment in BV.
2.3. Data availability
Data collected during both experiments are freely available on Pangaea, Bay of Calvi (BC): http://doi.pangaea.de/10.1594/PANGAEA.810331 and Bay of Villefranche (BV): http://doi.pangaea.de/10.1594/PANGAEA.835117.
M
AN
US
CR
IP
T
AC
CE
PT
ED
12 2.4. Statistical analysisIn order to test for ocean acidification effects on [NOx], [PO43-], [DOP]UV, [DON]UV
and [DFe], the measured concentration in each perturbed mesocosm for each sampling date was subtracted from the average of concentrations in the 3 controls at that time-point. The relative mean deviation (MD, expressed as a %) for each treatment and time-point was
obtained by dividing that value by the average concentration in the 3 controls. A simple linear regression model was used to test MD variations as a function of delta pCO2, which
corresponds to the difference of pCO2 level between the treatments and the 3 controls at each
time-point. A significant linear trend between MD and pCO2 was considered when pvalue <
0.05 (Fisher’test). Above this threshold, we assumed that acidification had no linear effect on nutrient dynamics. All regressions were conducted using the R software.
M
AN
US
CR
IP
T
AC
CE
PT
ED
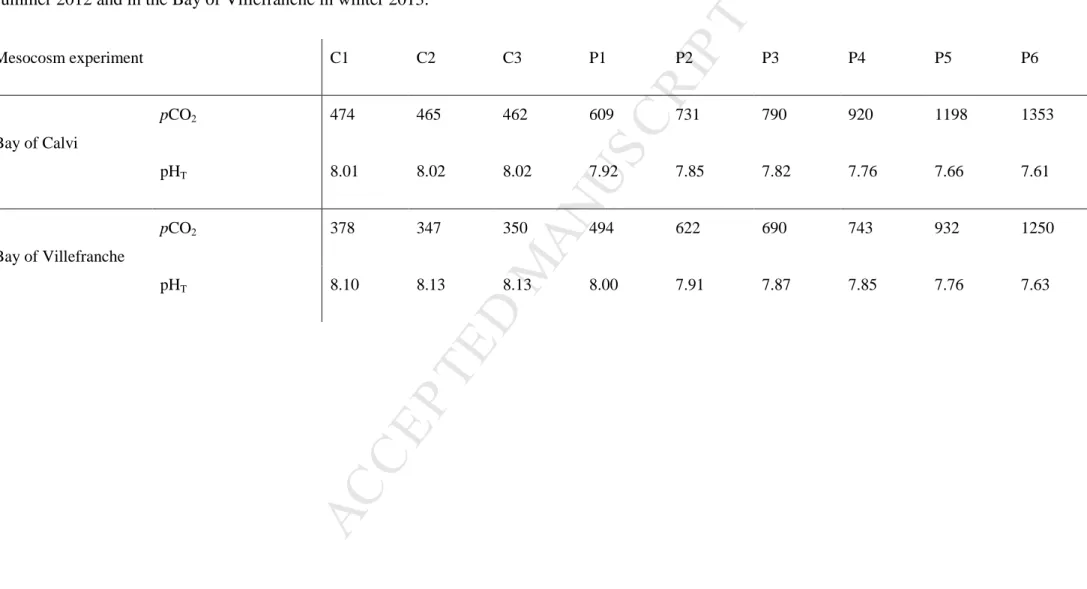
13 3. Results 3.1. Initial conditionsTable 1 presents the initial conditions (day 0) of pCO2 and pHT (on the total scale) in
the nine mesocosms during both experiments. In BC, the initial pCO2 in control mesocosms
was 467 ± 5 µatm corresponding to a pHT of 8.02. At the start of the experiment, perturbed
pCO2 levels were close to the targeted levels and ranged from 609 to 1353 µatm (P1 to P6)
corresponding to a pHT gradient from 7.92 to 7.61. In BV, initial pCO2 levels in control
mesocosms were lower than in BC, with an average pCO2 of 358 ± 17 µatm corresponding to
a pHT of 8.12. Initial pCO2 levels in perturbed mesocosms were close to the targeted levels
and ranged from 494 µatm (P1) to 1250 µatm (P6) corresponding to a pHT ranging from 8.0
to 7.63.
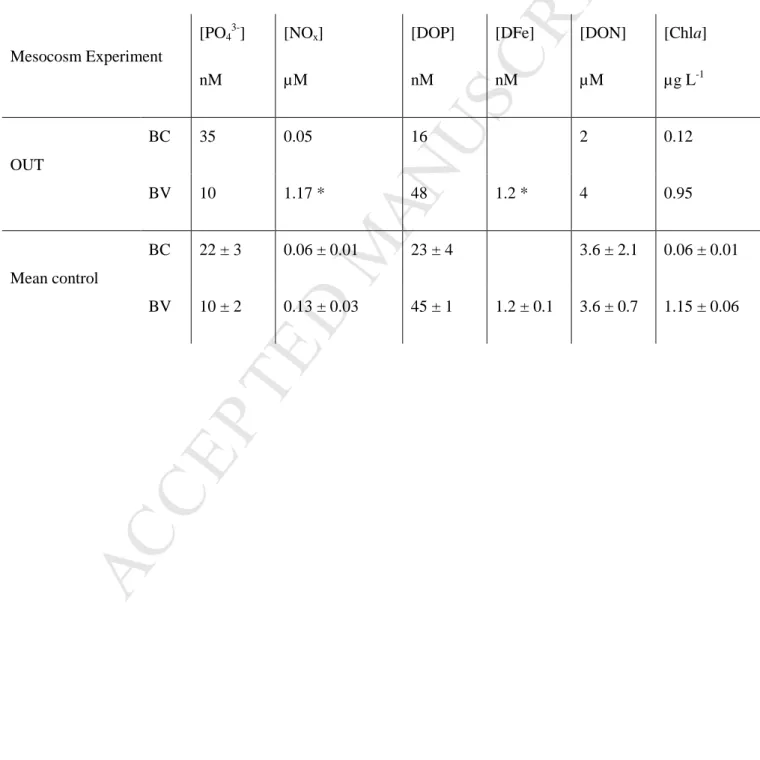
Initial nutrient and Chla concentrations in BC and in BV inside control mesocosms and outside are presented in Table 2. In BC, [Chla] was higher outside (0.12 µg L-1) than inside mesocosms (0.06 ± 0.01 µg.L-1). The same holds true for [PO43-] (35 vs 22 ± 3 nM). In
control mesocosms, [DOP]UV was similar to [PO43-] (23 ± 4 nM), while lower values were
measured outside (~16 nM). DONUV represented the largest dissolved N pool with
concentrations of 2 and 3.6 ± 2.1 µM inside and outside control mesocosms respectively, while [NOx] was lower with no difference between outside and inside control mesocosms
(0.05 µM vs 0.06 ± 0.01 µM).
In BV, [Chla] was much higher than in BC with initial values of 1.15 ± 0.06 µg L-1 inside control mesocosms and 0.95 µg L-1 outside. This was also the case for [DOP]UV with
values of 45 ± 1 nM inside control mesocosms and 48 nM outside. Regarding [PO43-], values
were lower in BV than in BC and were similar inside and outside control mesocosms (~10 nM). [DON]UV were also similar outside and inside control mesocoms at 4.0 and 3.6 ± 0.7
M
AN
US
CR
IP
T
AC
CE
PT
ED
14 µM respectively. In contrast, [NOx] was higher in BV than in BC and a difference betweenOUT and control mesocosms was observed (1.17 vs 0.13 ± 0.03 µM). [DFe] was 1.2 nM inside and outside control mesocosms.
3.2. Environmental and experimental conditions during the summer experiment in the Bay of Calvi
In BC, in the perturbed mesocosms, as no further addition of CO2-saturated seawater
was performed, pCO2 levels slightly decreased after the acidification phase over the course of
the experiment, especially for high CO2 mesocosms (P5 and P6). During the experiment,
mean pCO2 levels were C1: 429, C2: 427, C3: 429, P1: 508, P2: 586, P3: 660, P4: 747, P5:
828, P6: 990 µatm. [Chla] did not show any strong temporal trend, although levels slightly increased on day 10 to maximal concentrations of 0.09 ± 0.003 µg L-1 on day 14 (Fig. 1). With regard to the heterotrophic prokaryotes, the initial average abundance (day 0) in all mesocosms was 5.0 ± 0.3 x 10⁵ cell mL-1. Their density remained relatively constant during the experiment, and ranged from 4.0 x 10⁵ to 6.1 x 10⁵ cell mL-1. The evolution of [PO43-],
[NOx], [DOP]UV and [DON]UV in BC in all mesocosms and outside is shown in Figure 2.
After an initial decrease in [PO43-] inside and outside mesocosms between day 0 and day 1,
[PO43-] remained low and ranged from 3 to 12 nM inside all mesocosms, and from 7 to 13 nM
outside until day 20. Regarding DOP, a decrease was also observed between day 0 and day 1 outside mesocosms and in control mesocosms (no data available for perturbed mesocosms at day 0 except for P2). From day 1 to day 13, [DOP]UV varied between 5 and 20 nM with no
significant trend, except for P1 where an increase from 8 to 16 nM (linear regression: r² = 0.89, n = 5, pvalue = 0.02) was observed.
[NOx] increased from 47 ± 14 nM to 97 ± 22 nM in all mesocosms between day 0 and
M
AN
US
CR
IP
T
AC
CE
PT
ED
15 regression: r² = 0.90, n = 8, pvalue < 0.01). Then [NOx] remained very low (8 ± 6 nM) until day13 (except for P2 (28 ± 9 nM), and a peak (52 nM) observed for P1). While a gradual increase in [NOx] occurred for C2 and P6 from day 16 until the end of the experiment, two peaks were
observed on day 16 in P1 and P4 (105 and 124 nM respectively), and a strong increase was observed on day 17 for C1, C3, P2, P3 and P5. At the end of the experiment, [NOx] averaged
60 ± 14 nM in all mesocosms. After a high variability of [DON]UV between mesocosms on
day 0, the average [DON]UV, inside all mesocosms, varied around 4.8 ± 0.3 µM over the
course of experiment. A slight decrease between day 1 and day 13 could be observed in all mesocosms (linear regression: r² = 0.83, n = 6, pvalue = 0.01).
3.3. Environmental and experimental conditions during the winter experiment in the Bay of Villefranche
In BV, drops in pCO2 levels were more important than in BC due to strong winds with
mesocosms P1 to P4 showing very similar levels by the end of the experiment. Mean pCO2
levels were C1: 357, C2: 356, C3: 352, P1: 456, P2: 486, P3: 544, P4: 545, P5: 719, P6: 941 µatm. [Chla] averaged 0.98 ± 0.15 µg L-1 in the nine mesocosms along the 12-day
experiment. Chlorophyll a remained slightly above levels in the surrounding waters for the entire experimental period, except for the last day (day 12) when concentrations increased abruptly outside the mesocosms. As one can see in Figure 1, [Chla] increased during the acidification phase, consuming a large proportion of available nutrients (see below), notably NOx, before the start of the experimental phase (day 0). In all mesocosms, after this initial
peak, [Chla] gradually decreased until the end of the experiment. While the abundance of the heterotrophic prokaryotes outside the mesocosms remained constant over the experiment (6.3 ± 0.3 x 10⁵ cell mL-1), it increased from day 2 to day 12 to reach 1.1 ± 0.1 x 10⁶ cell mL-1
M
AN
US
CR
IP
T
AC
CE
PT
ED
16 inside all mesocosms. The initial average density of heterotrophic prokaryotes (day 0) was 7.3 ± 0.4 x 10⁵ cell mL-1.[PO43-], [NOx], [DOP]UV, [DON]UV and DFe evolution in BV in all mesocosms and
outside are shown in Figure 3. During the acidification phase, the increase in [Chla] outside and inside mesocosms was concomitant with the decrease in [PO43-] (from 15 ± 2 to 10 ± 2
nM) and [NOx]. At day 0, while [NOx] outside mesocosms remained high (~ 1 µM), all
mesocosms were depleted in NOx with an average concentration of 129 ± 30 nM.
No strong variations for [PO43-] were observed in the mesocosms over the course of
the BV experiment (global average: 9 ± 1 nM). [PO43-] was generally higher outside than
inside mesocosms and a peak of 23 nM was reached on day 6 followed by a decrease until the end of the experiment with similar inside and outside concentrations (12 nM at day 12). For the strongest perturbations (P4, P5 and P6), [DOP]UV dropped between day 0 and day 1, while
[DOP]UV outside and in P2, P3 and control mesocosms tended to increase. [DOP]UV then
remained stable (~44 ± 6 nM) in all mesocoms and outside until the end of the experiment. Over the course of the BV experiment, [NOx] was much higher outside (range
889-1618 nM) than inside mesocosms (range 40-682 nM). Inside all mesocosms, [NOx] was stable
until day 3 with an average concentration of 121 ± 50 nM. A general increase in [NOx]
occurred between day 3 and day 9 (linear regression: r² = 0.95, n = 6, pvalue < 0.001) with the
largest rise observed in P4, P2 and C2. [NOx] in those mesocosms was the highest measured
during the BV experiment (Fig. 4). The lowest [NOx] was measured in P1 and the standard
deviation was the lowest in P6 indicating that [NOx] in that mesocosm was more stable than
elsewhere (Fig. 4).
With respect to DON, concentrations were around 3.5 ± 0.7 µM inside and outside mesocosms and no clear trend could be observed, except for C1 and outside mesocosms
M
AN
US
CR
IP
T
AC
CE
PT
ED
17 where [DON]UV increased after day 1 until day 10 (linear regression C1: r² = 0.86, n = 6, pvalue= 0.02; linear regression OUT: r² = 0.82, n = 6, pvalue = 0.03).
In addition to NOx, PO43-, DON and DOP, [DFe] data were documented during the
experiment in BV. [DFe] were similar outside and inside mesocosms (2.3 ± 0.8 vs. 2.5 ± 1.2 nM, respectively). No clear trend was observed over the course of the experiment, although [DFe] slightly increased between day 3 and day 7 in all mesocosms.
3.4. Nutrient dynamics vs. pCO2
Box-plots of inorganic and organic nutrient concentrations during both experiments are shown in Figure 4, and relative MD (see section 2.4) of each perturbed mesocosm during the entire experiments was plotted against delta pCO2 for each perturbed mesocosm at each
time-point, in Figure 5. During both experiments, [PO43-] dynamics were not significantly
related to pCO2 levels. In addition, there was no significant relationship between pCO2 and
relative MD for PO43- (Fig. 5; BC: pvalue = 0.06; BV: pvalue = 0.69). The same holds true for
[DOP]UV (Fig. 5; BC: pvalue = 0.97; BV: pvalue = 0.33) and [DON]UV in BC (Fig. 5; BC: pvalue =
0.35). In BV, despite the significant relationship between relative MD for [DON]UV and delta
pCO2 (pvalue of 0.03), this relationship appears weak considering the large observed deviation
between the 3 controls (Figs. 4 and 5). In BC, pCO2 had no impact on [NOx] (Fig. 5; pvalue =
0.31). In BV, although box-plots for [NOx] indicate a difference between controls, P2 and P4
on one side and P1, P3, P5 and P6 on the other side (Fig. 4), no significant effect of pCO2
gradient on NOx dynamics was observed (Fig. 5; pvalue = 0.36). Despite the fact that [DFe]
was generally lower in CO2-enriched mesocosms compared to controls (Fig. 4), the pCO2
gradient did not significantly affect the evolution of [DFe] when considering the full duration of the experiment (Fig. 5; BV: pvalue = 0.91).
M
AN
US
CR
IP
T
AC
CE
PT
ED
18 4. Discussion4.1. Representativeness of the environmental settings
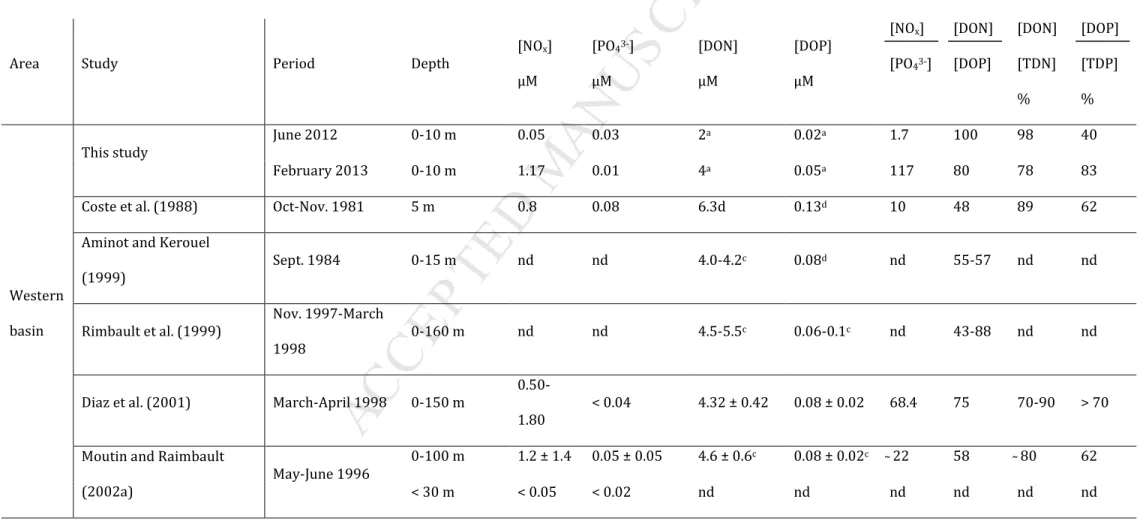
The mesocosm experiments presented here focused on the impact of ocean acidification on plankton communities and are the first of such experiments to have been conducted in a low nutrient, low chlorophyll system. Our experimental protocol allowed for quantification of both inorganic and organic nutrient concentrations at nanomolar levels, and therefore allowed us to assess, in detail, temporal nutrient variability and contribution to the functioning of the community. Furthermore, this study provided the opportunity to compare nutrient levels measured at the two sites, with data compiled from the literature and obtained using both conventional (micromolar level) and nanomolar techniques (see Table 3). Finally, this compilation allowed us to put our results in a broader context of seasonal and spatial variability of nutrient levels in the Mediterranean Sea.
In the Bay of Calvi, the low initial in situ [NOx] (50 nM) was in agreement with [NOx]
< 30 nM measured during a mesocosm experiment conducted in summer 2008 and 2010 in coastal waters of Corsica (Ridame et al., 2014). The low initial in situ [PO43-] (35 nM) was
consistent with data reported in previous studies conducted in the same season (Table 3; 5-20 nM in surface waters). These nitrate and phosphate depleted conditions, observed at the start of this experiment, are representative of summer oligotrophic conditions in the Mediterranean Sea.
In the Bay of Villefranche, the initial in situ [NOx] (1.17 µM) was very close to the
concentration (1.25 µM) measured during the same week at a sampling site located at the entrance of the Bay (Service d'Observation en Milieu LITtoral;
http://somlit.epoc.u-bordeaux1.fr/fr/). The same range [NOx = 0.7-2.3 µM] was also found at that site in surface
M
AN
US
CR
IP
T
AC
CE
PT
ED
19 waters: ~10 nM in this study (but ~50 nM from SOMLIT, close to the detection limit using the conventional analytical method), from 25 to 92 nM using a conventional analytical method (Thyssen et al., 2014) and 7 nM using nanomolar techniques (Louis et al., 2015). Those concentrations were low compared to the ones measured at the open ocean DYFAMED site (43°25’N, 7°52’E): 200-300 nM during the winter-mixing period (January-February) followed by a decrease from 200 to 30 nM during the winter-spring transition (Pulido-Villena et al., 2010). While a NOx-replete system outside mesocosms was in agreement withconditions usually reported for the Mediterranean Sea in winter, it must be stressed that this was no longer the case at the start of the experiment inside all mesocosms. Instead, a rapid NOx uptake by phytoplankton during the acidification phase (4 days before day 0; Gazeau et
al., submitted, this issue-a) was concomitant with the increase in biomass in all mesocosms (Figs. 1 and 3). This led to a sharp drop in [NOx] from 0.96 to 0.13 µM. Although [NOx]
outside mesocosms also slightly declined (from 1.6 to 1.2 µM) during that acidification period, [NOx] was maintained at a higher level due to a winter-mixing situation (the vertical
profile of temperature from SOMLIT indicated a homogeneous water column over 200 m) and/or due to external input via atmospheric wet depositions (Migon, pers. comm.). Therefore, the conditions encountered at the start of the experimental phase were not fully representative of winter conditions for that area.
The stoichiometric nutrient balance [NOx] / [PO43-] can be used to depict the P or/and
N (co)-limitation(s) for phytoplankton carbon fixation. In the Mediterranean Sea, below the mixed layer, [NOx] / [PO43-] is close to 22 (e.g. Mc Gill, 1965; Krom et al., 1991; Pujo-Pay et
al., 2011) and higher than the Redfield ratio (N / P = 16). In deep waters, estimates are more robust as ratios are calculated based on [PO43-] and [NOx] well above the analytical detection
M
AN
US
CR
IP
T
AC
CE
PT
ED
20 In surface waters, reported ratios are much more variable: from 6 to 68 in the 0-150 m layer (Table 3). This reflects the difficulty to accurately measure nutrients with conventional methods in severely nutrient depleted waters, with concentrations often below DL during the stratification period (Pasqueron de Fommervault et al., 2015). Estimates of surface water ratios are thus questionable in terms of quality. In surface waters of the Bay of Calvi, using nanomolar techniques, we found an initial in situ [NOx] / [PO43-] of 1.7 (Table 3), well belowthe Redfield ratio. Both low ratio and low nutrient concentrations suggest that this system experienced N and P co-limitation in summer, similarly to what was shown by Tanaka et al. (2011) in Svalbard. In winter in the Bay of Villefranche, initial in situ [NOx] / [PO43-] was 177
due to high [NOx] and low [PO43-] at the start of the experiment. As mentioned above, NOx
uptake occurred during the acidification phase, causing [NOx] to decrease to 129 ± 30 nM and
leading to an average [NOx] / [PO43-] = 13 in all mesocosms. These conditions suggest a
potential N and P co-limitation for the plankton community.
During both summer and winter experiments, the contribution of dissolved organic nutrients to the total dissolved phosphate and nitrogen pool was high. This is in agreement with previous studies in the Mediterranean Sea ([DON] / [TDN] = 60-100% and [DOP] / [TDP] = 30-100%; Table 3). Considering that organic forms of nutrients follow the same dynamics as DOM, which are known to accumulate in surface waters in the Northwestern Mediterranean Sea during the stratification period (Copin-Montegut and Avril, 1993), [DON] and [DOP] should peak in summer. In contrast, in our study, initial in situ [DON]UV and
[DOP]UV were higher in winter than in summer. The large labile fraction of DOP (60-80%;
Aminot and Kerouel, 2004; Lønborg and Alvarez-Salgado, 2012) and the oligotrophic nature of the Mediterranean Sea could explain a high turnover rate of DOP, thus preventing its accumulation in surface waters. Previous studies in the Sargasso Sea (Lomas et al., 2010), as
M
AN
US
CR
IP
T
AC
CE
PT
ED
21 well as in an oligotrophic subtropical gyre (Steinberg et al., 2001), showed that [DOP] peaked during the winter/spring bloom and declined slowly throughout the summer resulting in enhanced P-stress. This was concomitant with an increase in the alkaline phosphatase activity (APA). Similarly, in the present study, APA was higher in summer than in winter (Celussi et al., in press, this issue), possibly explaining lower [DOP] in summer than in winter. At the start of the experiment in the Bay of Villefranche, in situ [DON]UV and [DOP]UV were closeto reported concentrations for the Mediterranean Sea in winter (Table 2; Raimbault et al., 1999; Santinelli et al., 2002). In the Bay of Calvi, in situ [DOP]UV was in the range (0.01 -
0.10 µM) of reported data in summer in surface waters of the Mediterranean Sea (Table 3). With respect to in situ [DON]UV, the observed value of 2 µM was lower than concentrations
reported previously for the western basin in winter (from 4.5 to 5.5 µM; Raimbault et al., 1999; Table 3).
In the Bay of Villefranche, initial in situ [DFe] (1.2 nM; Table 1) was lower than values reported in the Bay of Villefranche at the same season by Bressac and Guieu (2013; 3.8 nM at 5 m) and, instead, more similar to winter offshore concentrations (DYFAMED site, 0.81 ± 0.07 nM; Bonnet and Guieu, 2006). The annual [DFe] dynamics in surface waters in the Northwestern Mediterranean Sea are controlled by several factors such as atmospheric deposition, winter mixing, phytoplankton uptake, and particle scavenging. Over an annual time scale, [DFe] ranged from 0.2 to 1.2 nM at DYFAMED site (Bonnet and Guieu, 2006). Minimal values were measured when [Chla] was the highest, as a consequence of biological uptake and removal by the sinking particles. Under stratified conditions, atmospheric
deposition results in an accumulation of [DFe] in surface waters that is isolated from deeper layers (Bonnet and Guieu, 2006; Guieu et al., 2010). Because atmospheric inputs, such as Saharan dust deposition, have high interannual variability (Guieu et al., 2014 and ref within),
M
AN
US
CR
IP
T
AC
CE
PT
ED
22 [DFe] concentrations in surface waters are likely also highly variable from one year toanother. This could explain the different [DFe] observed in the Bay of Villefranche at similar season. At the start of the winter experiment in the Bay of Villefranche, [DFe] in surface waters was reflective of [DFe] found in the open western Mediterranean Sea in winter. 4.2. Nutrient dynamics: Biological vs. Acidification effect
During both experiments, results showed that none of the parameters investigated in this study were linearly related to CO2 enrichment (Fig. 5). These two experiments, conducted
in waters depleted in PO43-, showed low variations in PO43- over the experimental period and
no significant differences in PO43- dynamics over the different pCO2 conditions. With respect
to NOx, concentrations followed the same temporal trend with no significant differences
between control and perturbed mesocosms (Figs. 4 and 5). In the Bay of Villefranche, during the acidification phase, although targeted pCO2 conditions were not yet reached, a drop in
NOx observed in all mesocosms suggested that NOx uptake by phytoplankton was not
impacted by an increase in pCO2 in the perturbed mesocosms. During the summer and winter
experiments, a trend in DONUV and DOPUV was now observed, and concentrations were not
affected by acidification (Fig. 5). Although a decrease in pH would favor the solubility of DFe (Breitbarth et al., 2010a), DFe concentrations did not increase with increasing pCO2 (Fig.
5). As such, it appears that both direct chemical and indirect biological processes (further discussed in this section) that controlled nutrient dynamics during these experiments were independent of pCO2 conditions.
Previous mesocosm experiments, similar to the ones presented here, focused on the effect of ocean acidification on plankton communities but were performed under nutrient replete conditions using artificial nutrient addition. For instance, in the framework of the Pelagic Ecosystem CO2 Enrichment (PeECE) project, three land-based mesocosm
M
AN
US
CR
IP
T
AC
CE
PT
ED
23 experiments were conducted in Bergen (Norway), in 2001, 2003 and 2005 (PeECE I, II and III, respectively). In 2001 and 2003, three treatments represented low (190 µatm), present-day (370-410 µatm) and high (700 µatm) pCO2 conditions. In PeECE III, there was onepresent-day condition and two high pCO2 levels (350, 700 and 1050 µatm). After nutrient addition,
[NOx]initial and [PO43-]initial were 15 and 0.5 µM respectively during PeECE I, 9 and 0.4 µM
respectively during PeECE II, and 16 and 0.8 µM respectively during PeECE III. During all three experiments, and in agreement with our results, NOx and PO43- uptake were similar in
all mesocosms, indicating that phytoplankton nutrient uptake was insensitive to changes in seawater pH (Engel et al., 2005 and 2008; Schulz et al., 2008; Bellerby et al., 2008). As similar increases in DOC, DON and DOP were observed in all PeECE mesocosms, this further suggests that acidification, as observed in our experiments, did not impact the production or consumption of dissolved organic nutrients. In contrast to the lack of pCO2
effects on inorganic and organic macronutrients, Breitbarth et al. (2010b) have shown, during the PeECE III experiment and in agreement with previous studies (e.g. Liu and Millero, 2002; Millero et al., 2009), that ocean acidification may lead to enhanced Fe-bioavailability due to (1) an increase in the organically complexed Fe (III) and (2) an increase in Fe(II)
concentrations. This is not consistent with data acquired during our experiment in the Bay of Villefranche where [DFe] in high-CO2 mesocosms were not significantly higher than in
low-CO2 mesocosms.
More recently, a large off-shore mesocosm experiment has been conducted in the Arctic ocean (Svalbard) following a pCO2 gradient ranging from 185 to 1420 µatm. This
study has shown that, before nutrient addition ([NOx] = 0.1 µM and [PO43-] = 0.06-0.09 µM),
in agreement with our results, organic and inorganic nutrient dynamics were similar in all
pCO2 treatments (Schulz et al., 2013). During the phytoplankton growth stimulated by
M
AN
US
CR
IP
T
AC
CE
PT
ED
24 dynamics in DON and DOP were observed in all mesocosms, inorganic nutrient uptake (NOxand PO43) was faster at higher CO2 levels indicating a shift in phytoplankton community
composition (Schulz et al., 2013), a shift that was not observed during our experiments (Gazeau et al. submitted, this issue-b).
Among the very few bottle experiments focused on the effect of ocean acidification on planktonic communities under low nutrient conditions, results of Yoshimura et al. (2010; [NOx]initial = 0.05 ± 0.02 µM and [PO43-]initial = 0.25 ± 0.01 µM) support our conclusion that
under limiting conditions, nutrient dynamics are not dependent on pCO2 levels.
In our study, nutrient measurements were performed at nanomolar levels providing greater detail to assess temporal dynamics. As nutrients dynamics did not differ between
pCO2 levels, the nine mesocosms can be considered as replicate measurements. As such, daily
average nutrient concentrations were calculated (Figs. 6, 7 and 8) providing insight to the relationship between nutrient dynamics and major biological parameters (chlorophyll a, particulate organic carbon, organic matter) and processes (production and degradation, heterotrophic enzymatic activities, nitrification). Such stocks and fluxes, measured during the experiments, are presented and discussed in details in companion papers (Gazeau et al., submitted, this issue-b; Maugendre et al., in press, this issue-a; Celussi et al., in press, this issue).
As a brief summary of the companion papers, during the summer experiment in the Bay of Calvi, CO2 enrichment did not have any significant effect on primary production
(Maugendre et al. in press, this issue-a), abundance and activity of heterotrophic prokaryotes (Celussi et al., in press, this issue), as well as Chla concentrations and phytoplankton
community composition (Gazeau et al., submitted, this issue-b). The summer plankton community was mostly composed of small species such as haptophytes and cyanobacteria
M
AN
US
CR
IP
T
AC
CE
PT
ED
25 (Gazeau et al., submitted, this issue-b), dominated by mixotrophs or heterotrophs. While the carbon biomass of autotrophs was very low (from 0.009 ± 0.003 to 0.022 ± 0.009 µmol C L-1; based on compound specific 13C incorporation; Maugendre et al., in press, this issue-b), mixotrophs represented the most productive group with an increasing biomass over the experimental period (from 0.05 ± 0.01 to 0.08 ± 0.03 µmol C L-1). The low biomass ofautotrophs determined by Maugendre et al. (in press, this issue-b) was consistent with the low average [Chla] measured in the Bay of Calvi (from 0.06 to 0.08 µg L-1; Fig. 6). Despite a low autotrophic production, [NOx] decreased by 50% throughout the experiment and [PO43-]
decreased during the first day and then slightly decreased until day 7 (Fig. 6). In such a nutrient-depleted system, haptophytes, considered as mixotrophic, are known to be good competitors for low nutrient resources (Sanders, 1991). The ratio between uptake rates of NOx
(12.8 nmol N L-1 d-1) and PO43- (0.5 nmol P L-1 d-1), determined from the slope of NOx and
PO43- decreases between day 1 and day 7, was around 25. This is close to the typical [NOx] /
[PO43-] in Mediterranean waters below the mixed layer (~22). Despite a slight decrease in
[DON]UV, an uptake of DOP was not observed (except between day 0 and day 1). This was
unexpected since the gradual increase of the alkaline phosphatase activity (APA) observed until day 12 (on average 169 nM h-1; Celussi et al., in press, this issue) should be concomitant with a decrease in [DOP] (i.e., Ruttenburg and Dyhrman, 2002; Mahaffey et al., 2014; Fig. 7). It could be due to either the low [DOP]UV during this experiment and/or a rapid turnover of
DOP (Benitez-Nelson and Buesseler, 1999). Towards the end of the experiment, [NOx] raised
while [PO43-] remained stable (Fig. 6). Excluding the external inputs in the mesocosms by
UV-transparent roofs covering them, the release of NOx would result from bacterial
remineralization.
In the Bay of Villefranche, as already mentioned, a rapid nutrient uptake by
M
AN
US
CR
IP
T
AC
CE
PT
ED
26 biomass (Fig. 6). After this [Chla] increase (and [NOx] drop) in all mesocosms, the biomassof the autotrophic community decreased (from 1.1 to 0.9 µg L-1) while the abundance of heterotrophic prokaryotes increased in all mesocosms (from 7.3 x 10⁵ cell mL-1 to 1.1 x10⁶ cell mL-1; Fig. 6). From day 3, an increase in [NOx] occurred in all mesocosms that was likely
linked to enhanced heterotrophic prokaryotes activity (Fig. 6). It is possible that the increase in [NOx] of ~18 nmol N L-1 d-1 was induced by nitrification activity estimated to be ̴ 19 nmol
N L-1 d-1 (Al-Moosawi, pers. comm.) although no negative correlation between [NH4+] and
[NOx] could be observed (Fig. 8b). Nitrification could have been preceded by ammonification
of the DON pool produced from the degradation of particulate organic matter by
heterotrophic prokaryotes. This could explain the negative correlation between particulate organic carbon concentrations ([POC]) and [NOx] (Fig. 8c), while [DON] remained stable
(Fig. 8a; sampling and analytical protocols for POC are described in Gazeau et al., submitted, this issue-b). The decrease in POC could also be due to the phytoplankton cell lysis under experimental stress (e.g. water column trapped in mesocosm). The large amount of released nutrient-rich organic matter resulted in an increase in bacterial abundance and heterotrophic activity. Ultimately, regenerated inorganic nutrients such as NH4+ and NOx by nitrification
were produced (Al-Moosawi, pers. comm.). While the heterotrophic activity based on the regenerated production was usually higher in summer, the increase in phytoplankton biomass (mostly composed of small species such as cryptophyceae and haptophyceae; Gazeau et al. submitted, this issue-b) at the start of experiment in the Bay of Villefranche allowed an increase in the abundance and activity of heterotrophic prokaryotes (see Celussi et al., in press, this issue, for further details).
Finally, in the Bay of Villefranche, in relation to the increase in heterotrophic activity and nitrification, [DFe] increased significantly (pvalue < 0.001) from day 3 to day 7 (Fig. 9a).
M
AN
US
CR
IP
T
AC
CE
PT
ED
27 by phytoplankton or the release of DFe in seawater after cell death (Witter et al., 2000) while [Chla] decreased. A negative relationship between [DFe] and [Chla] (pvalue = 0.001) wasindeed observed between day 3 and day 7 (Fig. 9b). Although [Chla] continued to decline until day 11, [DFe] did not increase after day 7. Finally, other biotic and abiotic processes such as scavenging and/or aggregation (Johnson et al., 1997), that were not explicitly studied here, could have explained this decrease in [DFe] observed at the end of the experiment.
M
AN
US
CR
IP
T
AC
CE
PT
ED
28 5. ConclusionThese first ocean acidification mesocosm experiments conducted in coastal LNLC areas allowed for investigation of the effect of ocean acidification on nutrient dynamics using nanomolar techniques. While the summer experiment was fully representative of oligotrophic summer conditions in the Mediterranean Sea, the winter experiment failed to reproduce the mesotrophic conditions typical of the winter time. Instead post-bloom conditions were also encountered, with high concentrations of phytoplankton exudates and low nutrient
concentrations.
Based on these two experiments, ocean acidification did not affect the dynamics of nutrients both under inorganic and organic forms: (1) the concentration of dissolved organic nutrients remained stable regardless of pCO2 conditions, (2) the expected increase in iron
solubility at high pCO2 was not observed and (3) the dynamics of NOx and PO43- were
controlled by the biological processes independently of pCO2 conditions.
Although the use of nanomolar techniques during these experiments facilitated documentation of nutrient dynamics with great precision, the direct measurement of the turnover times of P and N would provide a better view on these dynamics resulting from biological uptake. Such measurement would improve the assessment of ocean acidification impacts on plankton nutrient uptake, particularly in summer, when the turnover time of P is very low (1-2 h; Moutin et al., 2002b). As such, we recommend the measurement of nutrient turnover rates over nanomolar measurements in future mesocosm studies conducted in oligotrophic areas.
This absence of pCO2 effects on the bioavailability of nutrients in low nutrient and low
chlorophyll waters suggests that there will be no direct positive or negative feedback by the biological pump in response to the rise in atmospheric CO2. However, other changes
M
AN
US
CR
IP
T
AC
CE
PT
ED
29 projected with climate change, such as the increase in water column stratification, seawater temperature, extreme events occurrence, could induce shifts in the nutrient stoichiometry with important impacts on the diversity of the natural plankton assemblage. The response ofmarine ecosystems to on-going environmental changes in oligotrophic areas should be tackled using multi-stressor approaches (such as combining ocean acidification, warming and
M
AN
US
CR
IP
T
AC
CE
PT
ED
30 AcknowledgementsThis work was funded by the EC FP7 project ‘Mediterranean Sea Acidification in a changing climate’ (MedSeA; grant agreement 265103), the project European Free Ocean Carbon Enrichment (eFOCE; BNP-Paribas foundation), the MISTRALS-MERMEX program (Institut des Sciences de l’Univers, INSU), the Corsican local authorities and the Rhone-Mediterranean and Corsica Water Agency (http://www.eaurmc.fr). It is a contribution to the Surface Ocean - Lower Atmosphere Study (SOLAS), the Integrated Marine
Biogeochemistry and Ecosystem Research (IMBER) and the LOICZ projects. The STARESO marine station in Corsica is gratefully acknowledged for its assistance and boat support carried out within the framework of the STARECAPMED project funded by the Rhone-Mediterranean and Corsica Water Agency. A grant provided by the University of Paris 6 supported J.L. The staff of the Observatoire Océanologique de Villefranche is gratefully acknowledged for their assistance and boat support, colleagues of the Laboratoire
d'Océanographie de Villefranche for providing laboratory space. J.-M. Grisoni, A. Sallon, G. Obolensky, S. Alliouane, B. Hesse, D. Luquet, D. Robin, P. Mahacek and E. Cox are
acknowledged for assistance with diving operations. L. Kapsenberg is acknowledged for a careful check of English grammar.
M
AN
US
CR
IP
T
AC
CE
PT
ED
31 ReferencesAït-Ameur, N., and C. Goyet. 2006. « Distribution and transport of natural and anthropogenic CO2 in the Gulf of Cádiz ». Deep Sea Research Part II: Topical Studies in
Oceanography, The Gulf of Cadiz oceanography: a multidisciplinary view, 53 (11–
13): 1329 1343. doi:10.1016/j.dsr2.2006.04.003.
Aminot, A., and R. Kérouel. 2004. « Dissolved organic carbon, nitrogen and phosphorus in the N-E Atlantic and the N-W Mediterranean with particular reference to non-refractory fractions and degradation ». Deep Sea Research Part I: Oceanographic
Research Papers 51 (12): 1975 1999. doi:10.1016/j.dsr.2004.07.016.
Armstrong, F. a. J., and S. Tibbitts. 1968. « Photochemical combustion of organic matter in sea water, for nitrogen, phosphorus and carbon determination ». Journal of the Marine
Biological Association of the United Kingdom 48 (01): 143 152. doi:10.1017/S0025315400032483.
Bellerby, R. G. J., K. Schulz, U. Riebesell, C. Neill, G. Nondal, T. Johannessen, and K. R. Brown. 2008. « Marine ecosystem community carbon and nutrient uptake
stoichiometry under varying ocean acidification during the PeECE III experiment ».
Biogeosciences 5 (6): 1517 1527.
Beman, J. M., C.-E. Chow, A. L. King, Y. Feng, J. A. Fuhrman, A. Andersson, N. R. Bates, B. N. Popp, and D. A. Hutchins. 2011. « Global declines in oceanic nitrification rates as a consequence of ocean acidification ». Proceedings of the National Academy of
Sciences 108 (1): 208 213. doi:10.1073/pnas.1011053108.
M
AN
US
CR
IP
T
AC
CE
PT
ED
32 phosphorus turnover rates in the coastal ocean ». J Org Chem 62: 2619 2621.Bonnet, S., and C. Guieu. 2006. « Atmospheric forcing on the annual iron cycle in the Western Mediterranean Sea: a 1-year survey ». Journal of Geophysical Research 111 (C9). doi:10.1029/2005JC003213.
Breitbarth, E., E. P. Achterberg., M. V. Ardelan, A. R. Baker, E. Bucciarelli., F. Chever, and C. Hassler.. 2010a. « Iron biogeochemistry across marine systems–progress from the past decade ». Biogeosciences 7(3), 1075-1097.
Breitbarth, E., R. J. Bellerby, C. C. Neill, M. V. Ardelan, M.l Meyerhöfer, E. Zöllner, P. Croot, and U. Riebesell. 2010b. « Ocean acidification affects iron speciation during a coastal seawater mesocosm experiment ». Biogeosciences 7 (3): 1065 1073.
Bressac, M., and C. Guieu. 2013. « Post-depositional processes: what really happens to new atmospheric iron in the ocean’s surface?». Global Biogeochemical Cycles 27 (3): 859
870. doi:10.1002/gbc.20076.
Bronk, D. A., J. H. See, P. Bradley, and L. Killberg. 2007. « DON as a source of bioavailable nitrogen for phytoplankton ». Biogeosciences 4 (3): 283 296.
Bruland, K. W., R. P. Franks, G. A. Knauer, and J. H. Martin. 1979. « Sampling and
analytical methods for the determination of copper, cadmium, zinc, and nickel at the nanogram per liter level in sea water ». Analytica Chimica Acta 105: 233 245.
Brussaard, C. P. D., G. J. Gast, F. C. Van Duyl, R. Riegman, and others. 1996. « Impact of phytoplankton bloom magnitude on a pelagic microbial food web ». Marine ecology
progress series. Oldendorf 14 (1): 211 221.
M
AN
US
CR
IP
T
AC
CE
PT
ED
33 Konstantinopoulou, A., Pitta, P., Tsiola, A., in press, this issue. « Ocean acidification effect on microbial metabolism in two different locations in the Mediterranean Sea ».Estuarine, Coastal and Shelf Science.
Ciais P, C. Sabine, G. Bala, L. Bopp, V. Brovkin, J. Canadell, A. Chhabra, R. DeFries, J. Galloway, M. Heimann, C. Jones, C. Le Quéré, R. B. Myneni, S. Piao, P. Thornton. 2013. « Carbon and Other Biogeochemical Cycles. » In: Climate Change 2013: The
Physical Science Basis Contribution of Working Group I to the Fifth Assessment
Report of the Intergovernmental Panel on Climate Change [Stocker TF, Qin D,
Plattner G-K, Tignor M, Allen SK, Boschung J, Nauels A, Xia Y, Bex V, Midgley PM (eds)]. Cambridge University Press, Cambridge, United Kingdom and New York, NY, USA.
CIESM, 2008. « Biogeochemical impacts of ocean acidification- emphasis on carbonate production and dissolution ». In CIESM Workshop Monographs. CIESM, Monaco. http://ciesm.org/online/monographs/36/WM_36_51_54.pdf.
Collins, M., R. Knutti, J. Arblaster, J.-L. Dufresne, T. Fichefet, P. Friedlingstein, X. Gao, W.J. Gutowski, T. Johns, G. Krinner, M. Shongwe, C. Tebaldi, A.J. Weaver and M. Wehner. 2013. « Long-term Climate Change: Projections, Commitments and
Irreversibility. » In: Climate Change 2013: The Physical Science Basis. Contribution
of Working Group I to the Fifth Assessment Report of the Intergovernmental Panel on
Climate Change [Stocker, T.F., D. Qin, G.-K. Plattner, M. Tignor, S.K. Allen, J.
Boschung, A. Nauels, Y. Xia, V. Bex and P.M. Midgley (eds.)]. Cambridge University Press, Cambridge, United Kingdom and New York, NY, USA.
Copin-Montégut, G., and B. Avril. 1993. « Vertical distribution and temporal variation of dissolved organic carbon in the North-Western Mediterranean Sea ». Deep Sea
M
AN
US
CR
IP
T
AC
CE
PT
ED
34Research Part I: Oceanographic Research Papers 40 (10): 1963 1972. doi:10.1016/0967-0637(93)90041-Z.
Coste, B., P. Le Corre, and H. J. Minas. 1988. « Re-evaluation of the nutrient exchanges in the strait of gibraltar ». Deep Sea Research Part A. Oceanographic Research Papers 35 (5): 767 775. doi:10.1016/0198-0149(88)90029-5.
De Rijck, G., and E. Schrevens. 1998. « Cationic speciation in nutrient solutions as a function of pH ». Journal of plant nutrition 21 (5): 861 870.
Diaz, F., P.Raimbault, B. Boudjellal, N.Garcia, and T. Moutin. 2001. « Early spring phosphorus limitation of primary productivity in a NW Mediterranean coastal zone (Gulf of Lions) ». Marine Ecology Progress Series 211: 51 62.
Dickson, A. G., C. L. Sabine, J. R. Christian. 2007. « Guide to best practices for ocean CO2
measurements ». Report. North Pacific Marine Science Organization.
Doney, S. C., V. J. Fabry, R. A. Feely, and J. A. Kleypas. 2009. « Ocean acidification: the other CO2 problem ». Annual Review of Marine Science 1 (1): 169 192.
doi:10.1146/annurev.marine.010908.163834.
D’Ortenzio, F., D. Antoine, and S. Marullo. 2008. « Satellite-driven modeling of the upper ocean mixed layer and air–sea CO2 flux in the Mediterranean Sea ». Deep Sea
Research Part I: Oceanographic Research Papers 55 (4): 405 434. doi:10.1016/j.dsr.2007.12.008.
Dyhrman, S. T., and K. C. Ruttenberg. 2006. « Presence and regulation of alkaline
phosphatase activity in eukaryotic phytoplankton from the coastal ocean: Implications for dissolved organic phosphorus remineralization ». Limnology and Oceanography
M
AN
US
CR
IP
T
AC
CE
PT
ED
35 51 (3): 1381 1390.Engel, A, B Delille, S Jacquet, U Riebesell, E Rochelle-Newall, A Terbrüggen, and I Zondervan. 2004. « Transparent exopolymer particles and dissolved organic carbon production by Emiliania huxleyi exposed to different CO2 concentrations: a mesocosm
experiment ». Aquatic Microbial Ecology 34: 93 104. doi:10.3354/ame034093.
Engel, A. 2002. « Direct relationship between CO2 uptake and transparent exopolymer
particles production in natural phytoplankton ». Journal of Plankton Research 24 (1): 49 53. doi:10.1093/plankt/24.1.49.
Engel, A., I. Zondervan, K. Aerts, L. Beaufort, A. Benthien, L. Chou, B. Delille, et al. 2005. « Testing the direct effect of CO2 concentration on a bloom of the coccolithophorid
Emiliania huxleyi in mesocosm experiments ». Limnology and Oceanography 50 (2):
493 507.
Engel, A., C. Borchard, J. Piontek, K. G. Schulz, U. Riebesell, and R. Bellerby. 2003. « CO2
increases 14C primary production in an Arctic plankton community ». Biogeosciences 10 (3): 1291-1308. doi:10.5194/bg-10-1291-2013.
Gazeau, F., A. Sallon, L. Maugendre, J. Louis, W. Dellisanti, M. Gaubert, P. Lejeune, S. Gobert, S. Alliouane, V. Taillandier, F. Louis, G. Obolensky, J.-M. Grisoni and C. Guieu, submitted, this issue-a. « First mesocosm experiments to study the impacts of ocean acidification on plankton communities in the NW Mediterranean Sea (MedSeA project) ». Estuarine, Coastal and Shelf Science.
Gazeau, F., A. Sallon, P. Pitta, M.-L. Pedrotti, S. Marro, and C. Guieu, C., submitted, this issue-b. « Effect of ocean acidification on the plankton community diversity and
M
AN
US
CR
IP
T
AC
CE
PT
ED
36 organic matter in the NW oligotrophic Mediterranean Sea: results from two mesocosm studies ». Estuarine, Coastal and Shelf Science.Grossart, H.-P., M. Allgaier, U. Passow, and U. Riebesell. 2006. « Testing the effect of CO2
concentration on dynamics of marine heterotrophic bacterioplankton ». Limnology and
oceanography 51 (1): 1 11.
Guieu, C., M. -D. Loÿe-Pilot, L. Benyahya, and A. Dufour. 2010. « Spatial variability of atmospheric fluxes of metals (Al, Fe, Cd, Zn and Pb) and phosphorus over the whole Mediterranean from a one-year monitoring experiment: Biogeochemical
implications ». Marine Chemistry, Aerosol chemistry and impacts on the ocean, 120 (1–4): 164-178. doi:10.1016/j.marchem.2009.02.004.
Guieu, C., F. Dulac, C. Ridame, and P. Pondaven. 2014. « Introduction to project DUNE, a DUst experiment in a low Nutrient, low chlorophyll Ecosystem ». Biogeosciences 11(2), 425-442.
Hartmann, D. L., A. M. G. Klein Tank, M. Rusicucci, L. V. Alexander, B. Broenniman, Y. Charabi, F. J. Dentener, et al. 2013. « Observations: atmosphere and surface ». In
Climate Change 2013: the physical science basis. Contribution of Working Group I to
the Fifth Assessment Report of the Intergovernmental Panel on Climate Change, édité
par T. F. Stocker, D. Qin, G.-K. Plattner, M. Tignor, S. K. Allen, J. Boschung, A. Nauels, Y. Xia, V. Bex, et P. M. Midgley, 159 254. Cambridge: Cambridge University
Hoffmann, L., E. Breitbarth, P. Boyd, and K. Hunter. 2012. « Influence of ocean warming and acidification on trace metal biogeochemistry ». Marine Ecology Progress Series 470 191 205. doi:10.3354/meps10082.
M
AN
US
CR
IP
T
AC
CE
PT
ED
37 Holland, H.D., W. H. Schlesinger, and K. K. Turekian. 2005. Biogeochemistry. GulfProfessional Publishing.
Hutchins, D. A., F.-X. Fu, Y. Zhang, M. E. Warner, Y. Feng, K. Portune, P. W. Bernhardt, and M. R. Mulholland. 2007. « CO2 control of Trichodesmium N2 Fixation,
photosynthesis, growth rates, and elemental ratios: implications for past, present, and future ocean biogeochemistry ». Limnology and Oceanography 52 (4): 1293-1304. doi:10.4319/lo.2007.52.4.1293.
Hutchins, D., M. Mulholland, and F. Fu. 2009. « Nutrient cycles and marine microbes in a CO2-enriched ocean ». Oceanography 22 (4): 128-145.
doi:10.5670/oceanog.2009.103.
Jackson, G. A., and P. M. Williams. 1985. « Importance of dissolved organic nitrogen and phosphorus to biological nutrient cycling ». Deep Sea Research Part A.
Oceanographic Research Papers 32 (2): 223 235.
Johnson, K. S., R. M. Gordon, and K.H. Coale. 1997. « What controls dissolved iron concentrations in the world ocean? ». Marine Chemistry 57 (3 4): 137 161. doi:10.1016/S0304-4203(97)00043-1.
Karl D.M., and K.M. Bjorkman. 2002. « Dymanics of DOP ». In DA Hansell, CA Carlson
(eds.), Biogeochemistry of marine dissolved organic matter: 249-366
Krom, M. D., N. Kress, S. Brenner, and L. I. Gordon. 1991. « Phosphorus limitation of primary productivity in the Eastern Mediterranean Sea ». Limnology and
Oceanography 36 (3): 424 432. doi:10.4319/lo.1991.36.3.0424.