HAL Id: hal-00303240
https://hal.archives-ouvertes.fr/hal-00303240
Submitted on 9 Jan 2008HAL is a multi-disciplinary open access
archive for the deposit and dissemination of sci-entific research documents, whether they are pub-lished or not. The documents may come from teaching and research institutions in France or abroad, or from public or private research centers.
L’archive ouverte pluridisciplinaire HAL, est destinée au dépôt et à la diffusion de documents scientifiques de niveau recherche, publiés ou non, émanant des établissements d’enseignement et de recherche français ou étrangers, des laboratoires publics ou privés.
Seven year particulate matter air quality assessment
from surface and satellite measurements
P. Gupta, S. A. Christopher
To cite this version:
P. Gupta, S. A. Christopher. Seven year particulate matter air quality assessment from surface and satellite measurements. Atmospheric Chemistry and Physics Discussions, European Geosciences Union, 2008, 8 (1), pp.327-365. �hal-00303240�
ACPD
8, 327–365, 2008
Particulate matter air quality P. Gupta and S. A. Christopher Title Page Abstract Introduction Conclusions References Tables Figures ◭ ◮ ◭ ◮ Back Close Full Screen / Esc
Printer-friendly Version Interactive Discussion
EGU
Atmos. Chem. Phys. Discuss., 8, 327–365, 2008 www.atmos-chem-phys-discuss.net/8/327/2008/ © Author(s) 2008. This work is licensed
under a Creative Commons License.
Atmospheric Chemistry and Physics Discussions
Seven year particulate matter air quality
assessment from surface and satellite
measurements
P. Gupta and S. A. Christopher
Department of Atmospheric Science, The University of Alabama in Huntsville, Huntsville, AL, USA
Received: 1 November 2007 – Accepted: 29 November 2007 – Published: 9 January 2008 Correspondence to: S. Christopher ([email protected])
ACPD
8, 327–365, 2008
Particulate matter air quality P. Gupta and S. A. Christopher Title Page Abstract Introduction Conclusions References Tables Figures ◭ ◮ ◭ ◮ Back Close Full Screen / Esc
Printer-friendly Version Interactive Discussion
EGU
Abstract
Using seven years of the Moderate Resolution Imaging Spectroradiometer (MODIS) aerosol optical thickness (AOT) data and ground measurements of particulate matter mass over one site in the Southeastern United States (33.55 N, 86.82 W) we present a comprehensive analysis of various aspects of particulate matter air quality. Monthly,
5
seasonal and inter-annual relationships are examined with emphasis on sampling bi-ases, quality indicators in the AOT product and various cloud clearing criteria. Our re-sults indicate that PM2.5mass concentration over Northern Birmingham has decreased
by about 23% in year 2006 when compared to year 2002 and air quality during summer months are poor when compared to winter months. MODIS-Terra AOT data was
avail-10
able only about 50% of the time due to cloud cover and favorable surface conditions. However, the mean difference in monthly mean PM2.5was less than 2.2 µgm
−3
derived using all the data and from only those days when satellite AOT was available indicating that satellite data does not have sampling issues. The correlation between PM2.5 and MODIS AOT increased from 0.52 to 0.62 when hourly PM2.5data were used instead of
15
daily mean PM2.5 data. Changing box size for satellite data around the ground station
during comparisons produced less than ±0.03 difference in mean AOT values for 90% of observations. Application of AOT quality flags reduced the sample size but does not affect AOT-PM2.5relationship significantly. We recommend using AOT quality flags
for daily analysis, whereas long time scale analysis can be performed without using
20
all AOT retrievals to obtain better sampling. Our analysis indicates that satellite data is a useful tool for monitoring particulate matter air quality especially in regions where ground measurements are not available.
1 Introduction
Particulate matter (PM or aerosols) is an important component of air pollution, having
25
ACPD
8, 327–365, 2008
Particulate matter air quality P. Gupta and S. A. Christopher Title Page Abstract Introduction Conclusions References Tables Figures ◭ ◮ ◭ ◮ Back Close Full Screen / Esc
Printer-friendly Version Interactive Discussion
EGU
lung and skin diseases, which sometimes leads to premature death (Krewski et al., 2000; Pope et al., 2000; HEI, 2004; Pope and Dockery, 2006). Particulate matter assessment is of major concern around the world and many environmental protection agencies are working towards continuous monitoring and assessment of air pollution from surface based stations.
5
Advancement in satellite remote sensing of aerosols since the launch of the Mod-erate Resolution Imaging SpectroRadiometer (MODIS) has provided a new area of research for monitoring global PM air quality (Gupta et al., 2006). Satellite-derived aerosol optical thickness (AOT) represents integrated atmospheric columnar loading of aerosols and can be used as a surrogate to assess surface particulate matter air
10
quality, especially when surface measurements are not available. Research studies (Engel Cox et al., 2006; Al-Saadi et al., 2005; Gupta et al., 2006, 2007; Pelletier et al., 2007) have shown the potential of using satellite derived AOT values to derive mass concentration of particulate matter with aerodynamic diameter less than 2.5 µm (PM2.5). Most of these studies have compared MODIS derived AOT with surface
mea-15
sured PM2.5 mass concentration and linear regression equations were formulated to
calculate PM2.5 mass concentration over regions where surface measurements were not available. Some studies have used local meteorological parameters along with satellite-derived products to form multiple regression equations that improve overall relationships (e.g. Liu et al., 2004). Other studies, have used the Goddard Earth
Ob-20
serving System (GEOS) Chemistry transport model (GEOS-CHEM) derived vertical profiles to obtain boundary layer aerosol optical thickness, which is converted to sur-face level PM2.5 mass concentration (Donkelaar et al., 2006).
Satellite remote sensing studies indicate that AOT data can be used to monitor PM2.5
pollution over global areas on a near daily basis (Gupta et al., 2006; Chu et al., 2003).
25
Currently, there are several satellites in polar and geostationary orbits that are capable of monitoring aerosols over land from global to regional scales with moderate spatial and temporal resolution. Satellite sensors such as MODIS on Terra and Aqua satel-lites, Multi-angle Imaging SpectroRadiometer (MISR), POLarization and Directionality
ACPD
8, 327–365, 2008
Particulate matter air quality P. Gupta and S. A. Christopher Title Page Abstract Introduction Conclusions References Tables Figures ◭ ◮ ◭ ◮ Back Close Full Screen / Esc
Printer-friendly Version Interactive Discussion
EGU
of the Earth’s Reflectances (POLDER), and Ozone Monitoring Instrument (OMI) are examples of polar orbiting sensors, which provide AOT at 10 to 20 km spatial reso-lution. Geostationary satellites such as GOES and METEOSAT have also shown the potential of providing aerosol information on much higher temporal resolution (e.g. Pra-dos et al., 2007). However, most studies use MODIS data, due to its good spatial
5
resolution, excellent ability to mask clouds, and due to its near-daily global coverage. Although MISR derived AOT values are better than MODIS over land (Abdou et al., 2005), MISR’s main limitation is its narrow swath (360 km), allowing for global cover-age only every 8 to 9 days thereby limiting its use for air quality studies that require information on daily time scales. Although the MODIS has near daily global coverage,
10
cloud cover and changes in surface properties with season limits the aerosol retrieval on a daily basis.
According to the latest American Lung Association annual air quality report card Birmingham, AL, is ranked as the 4th most polluted city of the United States for par-ticulate pollution. Therefore, we use MODIS (Terra) derived aerosol products along
15
with surface measured PM2.5 mass concentration over North Birmingham (NBHM) to
assess particulate matter quality from daily to yearly scales using various methods. We focus on a single location (NBHM) and provide detailed air quality analysis while considering different aspects of surface and satellite measurements over a seven year time period. Previous studies in this region or elsewhere used data for limited time
20
periods and primarily focused on estimation of relationship between PM2.5 and AOT
only. In addition to the PM2.5-AOT relationship, we also examine the differences in
surface and satellite observations on monthly and yearly time scales. This provides insights into the effects of aerosol quality flags and on data loss, and we finally provide recommendations on using satellite data to derive particulate matter air quality.
ACPD
8, 327–365, 2008
Particulate matter air quality P. Gupta and S. A. Christopher Title Page Abstract Introduction Conclusions References Tables Figures ◭ ◮ ◭ ◮ Back Close Full Screen / Esc
Printer-friendly Version Interactive Discussion
EGU
2 Data
The data sets used in current study can be categorized into satellite and surface ob-servations. The first is the Terra-MODIS AOT data product and the second is daily and 1 h mean PM2.5mass concentration obtained from NBHM. Both data sets are obtained for a seven-year time period (2000–2006).
5
2.1 MODIS
MODIS Level 2 aerosol data (MOD04, Collection 5) from 24 February 2000 to 30 June 2006 were obtained from the Atmosphere Archive and Distribution System (LAADS) at NASA’s Goddard Space Flight Center (GSFC). Each MOD04 granule contains the aerosol properties both over land and ocean retrieved from 5 min of MODIS
observa-10
tions using updated collection 5 operational algorithms. Detailed descriptions of these improved aerosol algorithms over land are provided by Levy et al. (2007a, b). The parameters used are the spectral aerosol optical thickness (AOT), Angstrom exponent (AE), Cloud fraction (CF), and quality flags related to AOT retrieval, cloud masking, and surface types (Table 1). We also apply various quality flags associated with cloud
15
masking and AOT retrieval to estimate the difference in mean AOT values with that obtained from standard collocation (Ichoku et al., 2002) and analysis methods (Wang and Christopher, 2003) that do not use quality flags. While obtaining coincident MODIS pixels with the PM2.5 measurements, nine different criteria are applied to evaluate the
AOT product for PM2.5 air quality applications (Table 2). To understand these criteria,
20
a brief discussion of MODIS collection 5 aerosol retrieval over land is provided.
The MODIS land aerosol algorithm initially retrieves AOT in two wavelengths (0.446 and 0.667 µm) and AOT at 0.55 µm is obtained by interpolating between these two wavelengths. The algorithm also uses the 2.1 µm channel along with the vegetation index to obtain surface reflectance (Levy et al., 2007a) and other channels to mask
25
cloudy pixels. Although the retrieved AOT values are reported at a 10×10 km2pixel res-olution, the algorithm initially uses radiance measurements at much higher resolution
ACPD
8, 327–365, 2008
Particulate matter air quality P. Gupta and S. A. Christopher Title Page Abstract Introduction Conclusions References Tables Figures ◭ ◮ ◭ ◮ Back Close Full Screen / Esc
Printer-friendly Version Interactive Discussion
EGU
of 0.5×0.5 km2. All 400 pixels (20×20 pixels), each having resolution of 0.5×0.5 km2 within the 10×10 km2 area, are first examined for cloud contamination (Martin et al., 2002). The MODIS internal cloud mask (Ackerman et al., 1998) at 1×1 km2 spatial resolution is also used to identify cirrus. All pixels identified as cloudy are removed and further analysis uses only cloud free pixels to retrieve AOT. Once cloud free pixels
5
are identified, the mean reflectance is calculated from these pixels to retrieve AOT. The measured mean reflectance is matched with lookup tables of calculated reflectance for various aerosol models to obtain aerosol properties for each 10×10 km2pixel. Levy et al. (2007a) provide further details.
The percentage of cloudy pixels in a 10×10 km2 grid is computed using 1×1 km2
10
cloud mask after applying specific thresholds that are represented in terms of cloud mask quality flags (Cloud Mask QA). This Cloud Mask QA (CMQA) flag is stored as 8-bit information, which includes percentage cloudy pixels, snow/ice flags and surface type information (Hubanks, 2007). In this study, we have used quality control flags listed in criterion 4 through 9 (Table 2) to determine the importance of cloud
contam-15
ination on AOT and how it affects AOT calculations for particulate matter air quality research. Aerosol retrieval quality flags (Quality Assurance Land or QAL) can also be an important factor on whether or not the retrieved AOT should be matched up with the PM2.5 measurements. This flag contains 40 bits of information, which includes
confi-dence level of retrieval, quality of AOT at both wavelengths (no conficonfi-dence, marginal,
20
good, or very good), surface reflectance criteria used in retrieval, aerosol types, thin cirrus detection, ozone, water vapor, and snow cover data sources, and other flags associated with the deep blue algorithm (Hsu et al., 2004). In this study, we have used product quality flags from QAL as criteria numbers 8 and 9 (Table 2), which indicates confidence level of AOT retrieval at two wavelengths.
ACPD
8, 327–365, 2008
Particulate matter air quality P. Gupta and S. A. Christopher Title Page Abstract Introduction Conclusions References Tables Figures ◭ ◮ ◭ ◮ Back Close Full Screen / Esc
Printer-friendly Version Interactive Discussion
EGU
2.2 Particulate matter mass (PM2.5)
Particulate matter mass concentration (µgm−3) with aerodynamic diameter less than 2.5 µm (PM2.5) is regularly monitored by United States Environment Protection Agency (USEPA). The particulate matter air quality in the Continental United States is evaluated based on the PM2.5mass concentration measured using a network of surface stations.
5
Generally, a Tapered Element Oscillating Microbalance (TEOM) instrument is used to measure the mass of PM2.5 particles in units of µgm
−3
. The EPA and its state partners maintain several air quality monitoring networks in the United States. These networks monitor the mass concentration and speciation (some sites) of gaseous and particulate air pollutants near the surface. PM2.5data from these networks include 24 h
10
average (daily) concentration data and continuous (hourly) PM2.5 mass concentration
measurements. We use PM2.5 data from the North Birmingham (NBHM, 33.55 N and 86.82 W) station located in Jefferson County, Alabama, which has a data availability of 85% for any given year. Figure 1 shows a detailed view of the stations along with larger view of the EPA region 4.
15
3 Methodology
To obtain coincident PM2.5and MODIS AOT, nine different criteria are applied (Table 2).
Mean AOT for each day and each criterion is obtained over almost a seven year time period. The spatial resolution of one MODIS AOT pixel is approximately 10×10 km2, whereas surface measurements are point values thereby making
inter-20
comparisons difficult. Even if the MODIS pixel was small enough, it does not represent the same viewing conditions due to differences between observation areas, varying path lengths through the atmosphere, and sensor sensitivity to aerosol properties. Ichoku et al. (2002) averaged level 2 MODIS AOT pixels using a 5×5 pixel box over the surface measurement locations and 15-min observations over one hour to
repre-25
ACPD
8, 327–365, 2008
Particulate matter air quality P. Gupta and S. A. Christopher Title Page Abstract Introduction Conclusions References Tables Figures ◭ ◮ ◭ ◮ Back Close Full Screen / Esc
Printer-friendly Version Interactive Discussion
EGU
normal speed of aerosol transport (50 km/h) in the mid-troposphere using animation of the Total Ozone Mapping Spectrometer (TOMS) imagery over the Atlantic Ocean. This method is used by most satellite aerosol retrieval comparisons with ground measure-ments (e.g. Remer et al., 2005; Kahn et al., 2005; Abdou et al., 2005).
In the current study, three different box sizes (Fig. 1) centered on NBHM are
evalu-5
ated to verify the assumptions used in Ichoku et al. (2002). Table 2 provides the nine criteria used to obtain MODIS AOT. Criteria numbers 1 to 3 represents box sizes of 5×5, 4×4, and 3×3 MODIS pixels around the surface station, respectively. It is impor-tant to note that in this section, AOT values are obtained for all three conditions without applying any quality flags on MODIS AOT since this is the standard practice in most
10
studies (e.g. Wang and Christopher, 2003).
Criteria numbers 4 to 9 use the 3×3 pixel box size and apply different quality flags on surface type, solar zenith angle, cloud mask quality and quality of retrieved AOT values. Criteria 4 ensures that all the pixels used in averaging AOT over surface sta-tions are retrieved over land surface with solar zenith angles less than 60◦. In some
15
instances there could be inland water pixels or highly reflecting surfaces that can create uncertainties in AOT values (Hutchinson et al., 2005).
Criteria numbers 5 to 7 include the quality flags associated with cloud cover (CMQA) in the 10×10 km2MODIS pixel. Cloud mask quality flags are associated with percent-age area of 10×10 km2 pixel covered with clouds based on MODIS 1 km operational
20
cloud mask product (Ackerman et al., 1998). Criteria 5 allows maximum MODIS pix-els for calculating mean value with up to 90% cloud cover, which is reduced to 60% and 30% for criteria 6 and 7, respectively. As the cloud cover criteria is made more stringent, the available number of pixels decreases for calculating mean AOT value, while at the same time the quality of the AOT value increases. However, reducing the
25
number of pixels may also introduce sampling bias in the mean AOT value.
Criteria number 8 corresponds to confidence levels in AOT retrieval, which is based on number of pixels (at 500 m resolution), used in retrieving AOT at 10 km resolution (QAL). Based on the number of pixels used in calculating mean reflectance to retrieve
ACPD
8, 327–365, 2008
Particulate matter air quality P. Gupta and S. A. Christopher Title Page Abstract Introduction Conclusions References Tables Figures ◭ ◮ ◭ ◮ Back Close Full Screen / Esc
Printer-friendly Version Interactive Discussion
EGU
AOT value, each AOT value is flagged as “Good” or “Very Good”. Good and Very Good retrievals for both 0.47 and 0.67 µm channels are considered for this criterion in addition to those used by criteria 4 (Table 2). Criteria number 9 applies all of the restrictions of criteria number 8 plus, it allows only those pixels for which cloud cover is less than 30%. Criteria 9 uses only the best retrieval situations with all quality flags
5
whereas criteria number 3 represents all retrievals with no quality flags applied to AOT. Collocated AOT values for each of these criteria are tested and correlated with surface measured PM2.5mass concentration to evaluate the long term changes in AOT values
as well as PM2.5 mass concentrations.
4 Results
10
Results are divided into 4 different sections. Section one discusses the multi-year trends in PM2.5 mass concentration, PM2.5 air quality and MODIS AOT over NBHM.
Daily, monthly, seasonal, and annual trends along with frequency distribution of air quality conditions over this site are rigorously examined. The next section explores the availability of MODIS-Terra AOT data over the entire study period and discusses
15
the differences due to satellite sampling in monthly, seasonal, and annual mean PM2.5
mass concentration. This section answers the question of how well satellite sampling (due to cloud cover and other issues) compares with surface measurements (that make continuous measurements regardless of cloud cover) on monthly to yearly time scales. Section three examines the relationship between MODIS AOT and PM2.5 mass
con-20
centration on hourly, daily, monthly, and annual basis. This section also evaluates the stability of AOT-PM2.5 relationships during different seasons and years. The final
section, which is unique to the current study, is evaluation of MODIS AOT for PM2.5 research by considering sampling issues as well as quality flags associated with each retrieved AOT pixel. This section also revisits the results of Sect. 1 to 3 under these
25
new criteria for obtaining satellite observations and discusses the differences in AOT and PM2.5that arise when using stringent quality flags.
ACPD
8, 327–365, 2008
Particulate matter air quality P. Gupta and S. A. Christopher Title Page Abstract Introduction Conclusions References Tables Figures ◭ ◮ ◭ ◮ Back Close Full Screen / Esc
Printer-friendly Version Interactive Discussion
EGU
4.1 Long term air quality trends over North Birmingham
PM2.5 mass concentrations from NBHM and MODIS AOT from the Terra spacecraft
are both continuously available starting in February 2000. Therefore, we have almost seven years of data to analyze daily, monthly, seasonal and annual trends in air qual-ity. Figure 2 shows the time series of 24-h mean PM2.5mass concentration along with
5
monthly and annual mean trends. Daily variations in PM2.5 mass are represented by
thin light gray line, which are mainly associated with local meteorological conditions and changes in local emissions of PM2.5 particles. High values could also be associated
with transport of pollution from surrounding areas. The background colors denote the air quality conditions as defined by USEPA based on mass concentration of aerosol
10
particles that are smaller than 2.5 µm in aerodynamic diameter. The horizontal red line corresponding to 15 µgm−3and 35 µgm−3 are the annual and 24 h mean national standards set by USEPA under National Ambient Air Quality Standards (NAAQS). The previous (prior to 17 December 2006) 24 h standard of 65 µgm−3 is also plotted for comparison purposes (Fig. 2). Our analysis indicates that NBHM often experiences
15
moderate to unhealthy air quality conditions for sensitive groups, but rarely reaches the unhealthy category even under the new guidelines. The maximum 24 h mean PM2.5
mass concentration of 75.3 µgm−3 was observed on 25 October 2000 whereas the average of all daily mean values is 18.7±9.7 µgm−3. The thick gray line presents the monthly mean PM2.5 mass concentration calculated using daily mean values. The
20
monthly mean values clearly show a seasonal trend with high values during spring-summer and low values in fall-winter months. High spring-spring-summer values partially correspond to increase in gas to particle conversion in the atmosphere with increasing available solar radiation, enhancing the photo chemical reactions responsible for such particle production. Similar conditions do not occur in the winter months, thereby
lim-25
iting PM2.5 production. Seasonal changes in local meteorology also affect the PM2.5
production and removal processes. The month-to-month variation is not the same for all the years and varies slightly with peak values around July–August. Monthly
ACPD
8, 327–365, 2008
Particulate matter air quality P. Gupta and S. A. Christopher Title Page Abstract Introduction Conclusions References Tables Figures ◭ ◮ ◭ ◮ Back Close Full Screen / Esc
Printer-friendly Version Interactive Discussion
EGU
mean PM2.5 mass peaks at 34.6 µgm −3
during October 2000 with a minimum value of 11.3 µgm−3 observed in January 2003. A weak decreasing trend in annual PM2.5 was noted with the highest and lowest PM2.5 mass concentration of 22.1 µgm
−3
and 17.0 µgm−3observed in 2002 and 2006, respectively.
Figure 3 presents similar analysis for MODIS AOT using criteria 1 from Table 2.
Re-5
call that this criterion includes all AOT data without any quality flags. The AOT shows similar trends as PM2.5 mass with high values during summer and low values during
winter months. Seasonal changes in AOT are more prominent compared to seasonal changes in PM2.5 mass concentration due to sensitivity of urban aerosols towards
rel-ative humidity (Wang et al., 2007). The absolute difference in PM2.5mass from winter
10
to summer is not as high (when compared to PM2.5 trends in Fig. 2) when compared to MODIS AOT. Recall that AOT is an optical property which is function of light scat-tering from the aerosol particle and it increases in size in summer time due to parti-cle growth under high relative humidity conditions (Hess et al., 1998). Therefore, the same aerosol mass can produce large AOT values during summer months compared
15
to winter months. On the other hand, PM2.5 mass does not change significantly due
to growth of particles as TEOM make measurement of dry particles under about 40% relative humidity conditions.
Figure 4 presents frequency distribution (days of occurrence) of air quality conditions during each month. Also shown are days of occurrence (%) for each month (secondary
20
y-axis) averaged over 7 years time and are shown as filled circle and interpolated lines. During October 2000, air quality conditions were unhealthy corresponding to the month of highest PM2.5 mass concentration. Frequency of a particular air quality condition shows large variability, but does indicate the presence of a seasonal cycle. Monthly means clearly show that December had the highest frequency of days with good air
25
quality (∼65%). The frequency of good air quality begins to decrease in January and generally continues to decrease until August. Moderate air quality conditions occurred 61–68% of the time during the months of July and August with the lowest (35–37%) occurring during December and January. Air quality degrades to unhealthy for sensitive
ACPD
8, 327–365, 2008
Particulate matter air quality P. Gupta and S. A. Christopher Title Page Abstract Introduction Conclusions References Tables Figures ◭ ◮ ◭ ◮ Back Close Full Screen / Esc
Printer-friendly Version Interactive Discussion
EGU
group (USG) category on rare occasions and accounts for 9% days during August, whereas it remains less than 2–3% for other months. Seasonal variations in primary emissions and secondary formation (gas to particle) rates lead to seasonal differences in PM2.5 concentration.
Day to day variations in PM2.5 mass concentrations is usually associated with
varia-5
tions in local meteorological conditions. Meteorological conditions that strongly control PM2.5mass concentration include change in available sunlight due to clouds and sea-son, vertical mixing of air pollution within atmospheric boundary layer, temperature, moisture, long and short range transport by winds and recirculation of air mass by lo-cal wind pattern. High levels of pollution can be observed during strong temperature
10
inversions near surface (Kukkonen et al., 2005) and the magnitude, vertical structure, and temporal evolution of inversions significantly influence the air quality (Hussein et al., 2006).
4.2 Availability of satellite data for air quality
Since the launch of MODIS onboard Terra, almost daily global coverage of AOT
re-15
trievals are available and has been used for various climate and air quality research applications. Retrieval of AOT is limited to a cloud-free atmosphere for certain surface conditions, since MODIS cannot retrieve AOT over bright targets such as desert and bright urban centers (Levy et al., 2007a). Advances in observation capabilities of satel-lites and improved retrieval techniques are slowly removing these limitations (Hsu et
20
al., 2004).
In this section we explore the following question: “How well can MODIS Terra AOT data represent monthly and yearly mean PM2.5 mass concentration over NBHM”. To
answer this question, we assume that PM2.5mass can be estimated using MODIS AOT data. To test this assumption, daily mean PM2.5 measurements are collocated with
25
MODIS AOT data according to criteria 1 as given in Table 2. Although the Terra satellite overpasses NBHM site almost every day around 10:30 a.m. local time, AOT retrieval may not be available on a daily basis due to clouds and other limitations (e.g. bright
ACPD
8, 327–365, 2008
Particulate matter air quality P. Gupta and S. A. Christopher Title Page Abstract Introduction Conclusions References Tables Figures ◭ ◮ ◭ ◮ Back Close Full Screen / Esc
Printer-friendly Version Interactive Discussion
EGU
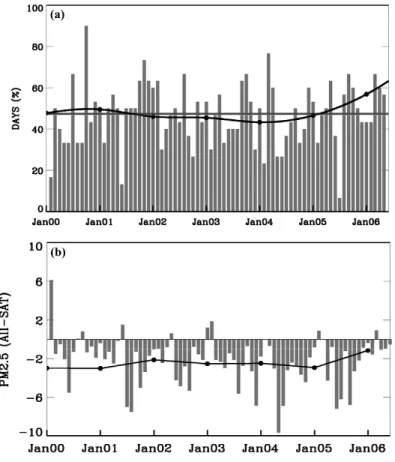
surface during certain seasons). Figure 5a presents the number of days (%) in each month for which AOT data available over the past seven years. The seven-year mean value is 47%, but with significant monthly variability. The numbers of available AOT days are mainly associated with cloud free days over the surface station. Terra-MODIS monthly mean daytime cloud cover data reveals that mean fractional cloud cover was
5
55% in the region. Over the entire study period the maximum number of available days was 90% during October 2000 whereas the minimum was about 7% during August 2005. Number of available days do not show significant seasonal trends but demon-strate high values during fall and winter and low values in spring and summer months. Month to month changes in available days vary from maximum of 57% during October
10
to minimum of 35% in February averaged over all seven year time period. Tracking number of days in each year is important while evaluating long term trends.
Figure 5b presents the monthly mean difference in PM2.5 mass concentration
be-tween all 24-h mean PM2.5measurements averaged for each month (ALL) and PM2.5 measurements averaged only when MODIS Terra AOT is available over the
measure-15
ment site (SAT). The purpose of this analysis is to evaluate how well satellite mea-surements can represent monthly and year mean values of PM2.5 mass. Negative differences indicate that using PM2.5data during the time of the satellite overpass
over-estimates PM2.5on monthly as well as yearly basis. This indicates that events with low
aerosol (or PM) loading over NBHM are being removed, possibly due to cloud cover.
20
This trend is consistent over the entire study period.
There is only 8 out of 77 months, when this difference is positive, and 50% of them are during the winter season. The mean difference is −2.2 µgm−3 with a maximum negative value of −9.7 µgm−3 during May 2004. The maximum positive difference of 6.1 µgm−3 was obtained during February 2000 since Terra-MODIS started
observa-25
tions on 24 February 2000 and only 5–6 days of data available during this month. Averaging each month separately over the entire seven year time period we find that January has minimum negative difference of −0.5 µgm−3whereas February has a pos-itive difference of 0.6 µgm−3 Again, summer months have large negative differences
ACPD
8, 327–365, 2008
Particulate matter air quality P. Gupta and S. A. Christopher Title Page Abstract Introduction Conclusions References Tables Figures ◭ ◮ ◭ ◮ Back Close Full Screen / Esc
Printer-friendly Version Interactive Discussion
EGU
compared to winter months, which corresponds to more number of available days in winter and less during summer months (Table 3). The solid line with dots in Fig. 4b shows the yearly mean values, which are always negative. The maximum difference (−3.0 µgm−3) in annual mean was in 2001 whereas minimum difference (−1.2 µgm−3) was during 2006.
5
4.3 Regression analysis between PM2.5and MODIS AOT
Particulate matter air quality monitoring from satellite is based on the relationship be-tween satellite derived AOT and surface measured PM2.5 mass concentration (Wang
and Christopher, 2003; Gupta et al., 2006). The accuracy of satellite estimated PM2.5 over any given location depends on the robustness of the regression relationship
be-10
tween AOT and PM2.5mass, which can depend on the accuracies of retrieved AOT and
other factors such as vertical distribution of aerosols. Local meteorological conditions also govern the PM2.5 mass concentration and hence their inclusion in the AOT-PM2.5
relationship can improve the overall accuracies in PM2.5mass estimation from satellite
observations (Gupta et al., 2006). However, we do not attempt to add
meteorologi-15
cal parameters to the analysis for the current paper. A separate manuscript is under preparation, which accounts for meteorological conditions and other ancillary data sets. Computation of a single-variate least-squares linear regression relationship between MODIS AOT and PM2.5 is performed. We now discuss the change in regression
co-efficient such as slope (m), intercepts (c), linear correlation coco-efficient (r) and
num-20
ber of collocated points (N) as a function of month, season and year over NBHM. Changes in these parameters between hourly averaged and 24 h averaged PM2.5 are
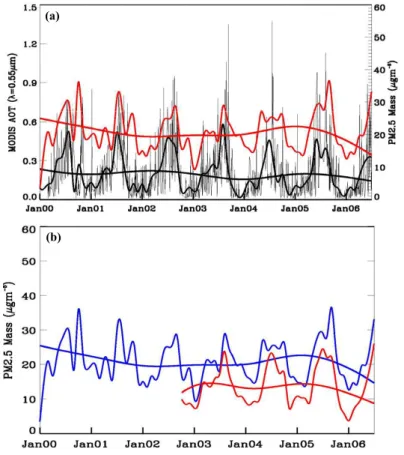
explored. Figure 6a presents the month to month and annual variations of MODIS AOT (primary y-axis) along with daily mean PM2.5 mass concentration (secondary y-axis). Both MODIS AOT and PM2.5 mass concentration follow similar trends on monthly and
25
yearly time scales as noted in Sect. 4.1. Figure 5b shows hourly averaged (red lines) PM2.5during Terra MODIS overpass time from 2000 to 2006 along with 24 h averaged PM2.5(blue lines). Both hourly and 24 h values follow similar variations on monthly and
ACPD
8, 327–365, 2008
Particulate matter air quality P. Gupta and S. A. Christopher Title Page Abstract Introduction Conclusions References Tables Figures ◭ ◮ ◭ ◮ Back Close Full Screen / Esc
Printer-friendly Version Interactive Discussion
EGU
yearly scales, but hourly averaged values are smaller compared to 24 h averaged val-ues. The mean ratio of monthly mean obtained using 24 h averages to mean obtained using hourly average PM2.5is 1.66±0.47.
The linear correlation coefficient between 24 h mean PM2.5mass concentration and
MODIS AOT is 0.52 with the regression relationship given by Eq. (1).
5
PM2.5= 15.8 + 27.5 × MODIS AOT (1)
When a similar analysis is performed on hourly averaged PM2.5 data, the correlation
increases to 0.62 and the corresponding regression equation becomes Eq. (2).
PM2.5= 8.8 + 29.4 × MODIS AOT (2)
These regression equations can be used to estimate the ground level PM2.5mass
con-10
centration. As expected, the instantaneous MODIS AOT correlate better with hourly averaged PM2.5 compared to 24 h averaged PM2.5 due to diurnal variations in PM2.5 mass measurements. National Air Quality Standards are set for 24 h mean PM2.5
mass concentration and it is an important parameter to monitor, hence further analysis is focused only on 24 h mean PM2.5 and despite its moderate correlation, these
rela-15
tionship can estimate daily air quality categories with a high degree of accuracy (Wang and Christopher et al., 2003).
Several studies have shown that the relationship between PM2.5 and AOT varies substantially with location and time (Engel-Cox et al., 2004; Gupta et al., 2006). To further explore this variability, regression coefficients for each month and year are
cal-20
culated and presented in Table 3. Yearly analysis shows that value of r over different years does not vary significantly and ranges between 0.46 in 2004 and 0.60 in 2006. Compared to yearly variations, r demonstrates more variation from month to month reflecting its dependence on season. Except for December, the correlation is positive and varies from minimum of 0.08 to maximum of 0.64. In December r=−0.11 and
cor-25
responds to very low AOT values (0.06). The negative correlation may be associated with large uncertainties in MODIS AOT, which can be more than 70% for AOT values
ACPD
8, 327–365, 2008
Particulate matter air quality P. Gupta and S. A. Christopher Title Page Abstract Introduction Conclusions References Tables Figures ◭ ◮ ◭ ◮ Back Close Full Screen / Esc
Printer-friendly Version Interactive Discussion
EGU
less than 0.1 over land (Remer et al., 2005; Levy et al., 2007a). These low AOT’s correspond to low PM2.5 concentrations and in general, summer and fall correlations
are higher compared to winter and spring. Highest correlations are associated with mean high AOT and PM2.5 mass concentration, which is consistent with our previous analysis in other parts of the world (Gupta et al., 2006; 2007).
5
Intercept in regression equation represents the background levels of PM2.5 mass
concentration in the absence of AOT (zero AOT). In other words, intercept represents the minimum level of particle concentration for which satellite derived AOT is sensitive. Below the level of intercept, satellite signals are weak and detection of aerosols is dif-ficult. Value of intercept is relatively constant as a function of time and only changes
10
between 13.7 and 16.6 µgm−3 with mean value of 15.6 µgm−3. In general, the inter-cept is greater in summer and fall months compared to winter and spring, which is also associated with high mean values of PM2.5 mass in respective months. The slope of
this relationship is an important parameter for converting AOT into surface PM2.5mass. The slope changes from 21.27 to 35.81 over different years with mean value of 27.48.
15
The variations in monthly slope values are large compared to yearly values and even becomes negative (−14.34) during December. Slope values could also be dependent on the local meteorological conditions as well as vertical distribution of the aerosols. Relative humidity could be an important parameter to observe while deriving these relationships because same dry PM2.5 mass concentration under different relative
hu-20
midity condition can produce different AOT due to changes in scattering properties of aerosols.
4.4 MODIS AOT, box size, and quality flags
Satellite aerosol retrieval algorithms convert the measured reflectance to a geophysical parameter related to aerosol concentration known as AOT. There are many quality flags
25
associated with the input data, processing methods and output data quality, which are reported in the MODIS AOT product. The MODIS science team recommends using these quality flags along with actual AOT values for research studies. Depending on
ACPD
8, 327–365, 2008
Particulate matter air quality P. Gupta and S. A. Christopher Title Page Abstract Introduction Conclusions References Tables Figures ◭ ◮ ◭ ◮ Back Close Full Screen / Esc
Printer-friendly Version Interactive Discussion
EGU
the application, the quality flag restriction could be relaxed or stringent. In the current study, the changes in mean AOT values due to various combinations of quality flags relevant for particulate matter air quality research are examined. The effect of box size (number of pixels in spatial collocation) around the ground station on mean AOT values is quantitatively estimated for three different box sizes. Table 2 presents all nine
5
criteria used to evaluate the change in mean AOT values at NBHM on daily, monthly and annual basis. The following discussion is separated into two parts; first, the effect of box size on mean AOT value is evaluated and then the effects of using different quality flags are discussed.
4.4.1 Varying box size around ground station
10
Criteria numbers 1 to 3 (CN1 to CN3) in Table 2 use all retrieved AOT values to obtain mean AOT value over NBHM without any quality flag restrictions, but for three different box size of 5×5 (0.5×0.5◦, AOT5), 4×4 (0.4×0.4◦, AOT4), and 3×3 (0.3×0.3◦, AOT3) pixels. Decreasing box size, decreases the number of pixels used to derive MODIS AOT values for NBHM, and may affect the overall mean AOT and these can change
15
PM2.5estimation from satellites due to change in spatial sampling of aerosols
(Hutchi-son et al., 2005). Larger box sizes generally indicates sampling of more heterogeneous type of aerosols compared to small box sizes, which can overestimate or under esti-mate AOT values compared to point measurements from ground stations. Ichoku et al. (2002) reported that a 5×5 box is a good approximation for AOT validation with 1 h
20
averaged AERONET AOT values, which is supported by arguing that average speed of aerosol transport in mid-troposphere is about 50 km/h based on analysis of TOMS aerosol index images over the Atlantic Ocean.
However, the current focus of the study is AOT for air quality applications, which is measured at the surface in the form of PM2.5 mass concentration. Since the average
25
travel speed of aerosols (air mass) near the surface (lowest few hundred meters) is much less (<4 ms−1) than mid-troposphere, one hour averaged PM2.5 measurements may not represent the air mass in the 50×50 km area sampled by MODIS instrument.
ACPD
8, 327–365, 2008
Particulate matter air quality P. Gupta and S. A. Christopher Title Page Abstract Introduction Conclusions References Tables Figures ◭ ◮ ◭ ◮ Back Close Full Screen / Esc
Printer-friendly Version Interactive Discussion
EGU
As a result, a smaller 3×3 pixel box size is considered while evaluating the effects of quality flags in second part of this section. Reducing box size further might result in a statistically insignificant number of pixels and may introduce additional uncertainties. Figure 7 presents differences in daily, monthly, and annual mean AOTs due to changes in box sizes. The inset in Fig. 7 contains the frequency distribution of differences in
5
AOT4 and AOT3 values from AOT5. The difference is larger between AOT5 and AOT3 compared to AOT5 and AOT4. Daily mean differences of AOT5-AOT4 and AOT5-AOT3 are −0.004 and −0.010 with ranges of −0.1 to 0.11 and −0.19 to 0.23 respectively for the entire time period. No specific trends on seasonal and annual time scales were observed when varying box sizes. Frequency distribution also shows that the
10
difference in AOTs between −0.03 and 0.03 is greater than 90% of the time that is well within uncertainty limits of MODIS AOT retrievals (Levy et al., 2007a, b). Further investigation reveals that the mean of AOT5 values for which the difference is between −0.05 to 0.05 is less than 0.3 whereas it is (AOT5) greater than 0.45 for differences larger than 0.05.
15
Therefore, it is clear that during high aerosol loading (AOT>0.3) the differences in instantaneous AOT due to changes in box size could be significant while the differ-ences are within retrieval uncertainties (0.05±0.15×AOT) when aerosol loading is low (AOT<0.3). AOT values do not change as a function of box size up to second digit of significance (Table 4). It is also important to note that, reducing box size from 5×5 to
20
3×3 reduces the number of available data by about 8%. The regression coefficients for the AOT-PM2.5 relationship (see Sect. 4.3) are recalculated and we found that they do
not change significantly as a function of box size and the number of data points. Slope values changed by less than 7%, intercept by less than 0.5% and linear correlation coefficient improved by less than 2%.
25
4.4.2 Applying quality flags
Criteria numbers 3 to 9 (CN3 to CN9) in Table 2 use a constant box size of 3×3 pixels around the PM2.5 station and only quality flags associated with MODIS AOT retrievals
ACPD
8, 327–365, 2008
Particulate matter air quality P. Gupta and S. A. Christopher Title Page Abstract Introduction Conclusions References Tables Figures ◭ ◮ ◭ ◮ Back Close Full Screen / Esc
Printer-friendly Version Interactive Discussion
EGU
over land are changed. The primary focus of this analysis is to determine importance of the quality flags for daily, monthly and yearly aerosol analysis. We examine how much bias or uncertainty can be introduce in the AOT values if one does not use any quality flags to represent the aerosol loading.
Criteria number 9 is the most stringent in terms of quality flags and uses only good
5
or very good retrievals, which are identified as land pixels with a solar zenith angle less than 60 degree under less than 30% cloud cover conditions. Mean AOT using CN9 are considered as best AOT (BAOT) value and all other criterions (CN3 to CN8) are evaluated with respect to CN9 (Table 5). A negative difference represents an overes-timation in AOT. Differences in daily (instantaneous) AOT values range from −0.11 to
10
0.08 while mean value varies from one criterion to other. Table 5 demonstrates that the mean difference is always negative in daily, monthly and yearly analysis, which indicates an overestimation of AOT values when quality flags are not used. Figure 8 indicates that AOT values on monthly and yearly scales are generally overestimated compared to BAOT. CN4 and CN5 represent two different cases with very minor
differ-15
ences. CN4 does not include any cloud flags whereas CN5 restricts cloud cover above 90%. AOT retrieval process and screening of unwanted pixels are such that most of the time CN4 and CN5 will have same AOT value. Differences in mean AOT values while using different criteria on daily basis are very small. The differences are larger in monthly and yearly mean values, which could arise due to sampling issues discussed
20
in the previous section. Table 6 presents these differences for each month separately to shows seasonal variability in AOT for different criteria. Overall, there is not much of a seasonal dependence, but summer months (May to July) have the maximum difference while using all criteria, which could be associated with changes in cloud cover.
Figure 9 presents the reanalysis of regression equations as discussed in Sect. 4.3
25
with application of quality flags on AOT. The main objective of this analysis is to under-stand the differences in regression coefficients that can occur due to the use of different quality flags. The effect on mean number of pixels is only visible from changing box size, and it decreases as box size reduces from CN1 to CN3. We only plot all time
ACPD
8, 327–365, 2008
Particulate matter air quality P. Gupta and S. A. Christopher Title Page Abstract Introduction Conclusions References Tables Figures ◭ ◮ ◭ ◮ Back Close Full Screen / Esc
Printer-friendly Version Interactive Discussion
EGU
mean values, but there could be differences in the number of pixels due to changes in quality flags over different time periods. The changes in number of pixels while us-ing CN3 to CN9 are mainly associated with changes in cloud cover. Slope generally increases from 27.47 to 32.08 for CN1 to CN9. This could be due to the decrease in mean AOT value from CN1 to CN9. Intercept is almost constant with mean value of
5
15.6, which represents a constant background PM2.5loading over the station through
out the study period. The number of days when data were available decreased from 47.0% for CN1 to 33.3% for CN9. However, correlation between PM2.5and AOT does not vary significantly and only improves from 0.52 to 0.55 from CN1 to CN9.
5 Summary
10
Seven year surface PM2.5mass concentration and MODIS-Terra derived aerosol opti-cal thickness data sets were collected over one location in Southeastern United States (NBHM) to assess different aspects of satellite monitoring of particulate matter air qual-ity. Surface and satellite data were analyzed to asses the long term air quality trends, availability of satellite data for air quality applications, the relationship between surface
15
measured PM2.5mass concentration and satellite derived integrated columnar aerosol
loading (AOT) with the new generation of Collection 5 MODIS aerosol products. The application of quality control flags on aerosol optical thickness values and effects on these flags on the PM2.5-AOT relationships were also examined.
Our results indicate that NBHM air quality has improved from 2000 to 2006 with
un-20
healthy conditions during summer when compared to other seasons. Since satellites can provide particulate matter air quality information only during cloud-free and favor-able surface conditions we calculated the availability of satellite data for this station. A significant conclusion of this study is that even though NBHM is sampled only 50% of the time by Terra-MODIS, the monthly, seasonal and yearly means are different only by
25
2 µgm−3when compared to using a 100% data availability rate from ground measure-ments. Our analysis of quality control flags and box sizes for evaluating PM2.5-AOT
ACPD
8, 327–365, 2008
Particulate matter air quality P. Gupta and S. A. Christopher Title Page Abstract Introduction Conclusions References Tables Figures ◭ ◮ ◭ ◮ Back Close Full Screen / Esc
Printer-friendly Version Interactive Discussion
EGU
relationships indicate that for daily analysis using quality control flags are critical but for monthly and yearly analysis these flags may not be necessary. Finally, quality flags also do not affect the PM2.5-AOT relationship significantly but reduces the available
satellite data by up to 14% from all retrievals to best retrievals. Hence depending on the requirement of sample size as well as accuracies, quality flags can be used or
ig-5
nored. These results indicate that satellite data can be a powerful tool for evaluating air quality in regions especially when ground measurements are not available.
Acknowledgements. This research is supported by NOAA Air quality projects at UAH
(NA06NES4400008 and NA07NES42800005). Pawan Gupta was supported by NASA Head-quarters under the Earth and Space Science Fellowship (NESSF) Grant. MODIS data were
10
obtained from the Level 1 and Atmosphere Archive and Distribution System (LAADS) at God-dard Space Flight Center (GSFC). PM2.5 data were obtained from EPA’s Air Quality System (AQS). We thank T. Jones for his editorial work and for a critical reading of this manuscript.
References
Abdou, W. A., Diner, D. J., Martonchik, J. V. Bruegge, C. J., Kahn, R. A., Gaitley, B. J., Crean,
15
K. A., Remer, L. A., and Holben, B.: Comparison of coincident Multiangle Imaging Spectro-radiometer and Moderate Resolution Imaging SpectroSpectro-radiometer aerosol optical depths over land and ocean scenes containing Aerosol Robotic Network sites, J. Geophys. Res. Atmos., 110(D10), D10S07, 11 967–11 976, 2005.
Ackerman, S., Strabala, K., Menzel, P., Frey, R., Moeller, C., and Gumley, L.: Discriminating
20
clear sky from clouds with MODIS, J. Geophys. Res., 103, 32 141–32 157, 1998.
Al-Saadi, J., Szykman, J., Pierce, R. B., Kittaka, C., Neil, D., Chu, D. A., Remer, L., Gumley, L., Prins, E., Weinstock, L., Macdonald, C., Wayland, R., Dimmick, F., and Fishman, J.: Im-proving National Air Quality Forecasts With Satellite Aerosol Observations, B. Am. Meteorol. Soc., 86, 9, 1249–1261, 2005.
25
Chu, D. A., Kaufman, Y. J., Zibordi, G., Chern, J. D., Mao, J., Li, C., and Holben, B. N.: Global monitoring of air pollution over land from the Earth Observing System-Terra Moderate Resolution Imaging Spectroradiometer (MODIS), J. Geophys. Res., 108, D21, doi:10.1029/2002JD003179, 2003.
ACPD
8, 327–365, 2008
Particulate matter air quality P. Gupta and S. A. Christopher Title Page Abstract Introduction Conclusions References Tables Figures ◭ ◮ ◭ ◮ Back Close Full Screen / Esc
Printer-friendly Version Interactive Discussion
EGU
Donkelaar, A., Martin, R. V., and Park, R. J.: Estimating ground-level PM2.5 using aerosol optical depth determined from satellite remote sensing, J. Geophys. Res., 111, D21201, doi:10.1029/2005JD006996, 2006.
Engel-Cox, J. A., Hoff, R. M., Rogers, R., Dimmick, F., Rush, A. C., Szykman, J. J., Al-Saadi, J., Chu, D. A., and Zell, E. R.: Integrating lidar and satellite optical depth with ambient monitoring
5
for 3-dimensional particulate characterization, Atmos. Environ., 40, 8056–8067, 2006. Engel-Cox, J. A., Christopher H. H., Coutant, B. W., and Hoff, R. M.: Qualitative and quantitative
evaluation of MODIS satellite sensor data for regional and urban scale air quality, Atmos. Environ., 38, 2495–2509, 2004.
Gupta, P., Christopher, S. A., Box , M. A., and Box, G. P.: Multi year satellite remote sensing
10
of particulate matter air quality over Sydney, Australia, Int. J. Remote Sens., 28, 4483–4498, doi:10.1080/01431160701241738, 2007.
Gupta, P., Christopher, S. A., Wang, J., Gehrig, R., Lee, Y.C., and Kumar, N.: 2006, Satellite remote sensing of particulate matter and air quality over global cities, Atmos. Environ., 40 (30), 5880–5892, 2006.
15
HEI: Health effects of outdoor air pollution in developing countries of Asia: a literature review, HEI International Oversight Committee, Boston, MA, Health Effects Institute (Special Report No. 15), 2004.
Hess, M., Koepke, P., and Schult, I.: Optical Properties of Aerosols and clouds: The software package OPAC, B. Am. Meteorol. Soc., 79, 831–844, 1998.
20
Hsu, N. C., Tsay, S. C., King, M. D., and Herman, J. R.: Aerosol retrievals over bright-reflecting source regions, IEEE Trans. Geosci. Remote Sens., 42, 557–569, 2004.
Hubanks, P. A.: MODIS Atmosphere QA Plan for Collection 005 (Deep Blue Aerosol Update), Version 3.5, April 2007. (http://modis-atmos.gsfc.nasa.gov/index.html).
Hussein, T., Karppinen, A., Kukkonen, J., H ¨ark ¨onen, J., Aalto, P. P., H ¨ameri K., Kerminen, V.,
25
and Kulmala, M.: Meteorological dependence of size-fractionated number concentrations of urban aerosol particles, Atmos. Environ., 40, 8, 1427–1440, 2006.
Hutchison, K. D., Smith, S., and Faruqui, S.: Correlating MODIS aerosol optical thickness data with ground-based PM2.5 observations across Texas for use in a real-time air quality prediction system, Atmos. Environ., 39, 37, 7190–7203, 2005.
30
Ichoku, C., Chu, D. A., Mattoo, S., Kaufman, Y. J., Remer, L. A., Tanr ´e, D., Slutsker, I., and Hol-ben, B. N.: A spatio-temporal approach for global validation and analysis of MODIS aerosol products, Geophys. Res. Lett., 29, doi:10.1029/2001GL013206, 2002.
ACPD
8, 327–365, 2008
Particulate matter air quality P. Gupta and S. A. Christopher Title Page Abstract Introduction Conclusions References Tables Figures ◭ ◮ ◭ ◮ Back Close Full Screen / Esc
Printer-friendly Version Interactive Discussion
EGU
Kahn, R. A., Gaitley, B. J., Martonchik, J. V., Diner, D. J., and Crean, K. A.: Multiangle Imaging Spectroradiometer (MISR) global aerosol optical depth validation based on 2 years of coin-cident Aerosol Robotic Network (AERONET) observations, J. Geophys. Res., 110, D10S04, doi:10.1029/2004JD004706, 2005.
Krewski, D., Burnett, R. T., Goldberg, M. S., Hoover, K., Siemiatycki, J., Jerrett, M.,
Abra-5
hamowicz, A., and White, W. H.: Reanalysis of the Harvard Six Cities Study and the Amer-ican Cancer Society Study of Particulate Air Pollution and Mortality, A Special Report of the Institute’s Particle Epidemiology Reanalysis Project, Health Effects Institute, Cambridge MA, 97 pp., 2000.
Kukkonen, J., Pohjola, M., Sokhi, R. S., Luhana, L., Kitwiroon, N., Fragkou, L., Rantam ¨aki, M.,
10
Berge, E., Ødegaard, V., and Slørdal, L. H.: Analysis and evaluation of selected local-scale PM10air pollution episodes in four European cities: Helsinki, London, Milan and Oslo, Atmos. Environ., 39, 2759–2773, 2005.
Levy, R. C., Remer, L. A., and Dubovik, O.: Global aerosol optical properties and application to Moderate Resolution Imaging Spectroradiometer aerosol retrieval over land, J. Geophys.
15
Res., 112, D13210, doi:10.1029/2006JD007815, 2007b.
Levy, R. C., Remer, L. A., Mattoo, S., Vermote, E. F., and Kaufman, Y. J.: Second-generation operational algorithm: Retrieval of aerosol properties over land from inversion of Moderate Resolution Imaging Spectroradiometer spectral reflectance, J. Geophys. Res., 112, D13211, doi:10.1029/2006JD007811, 2007a.
20
Liu, Y., Park, R. J., Jacob, D. J., Li, Q., Kilaru, V., and Sarnat, J. A.: Mapping an-nual mean ground-level PM2.5 concentrations using Multiangle Imaging Spectroradiometer aerosol optical thickness over the contiguous United States, J. Geophys. Res., 109, D22206, doi:10.1029/2004JD005025, 2004.
Martins, J. V., Tanr’e, D., Remer, L. A., Kaufman, Y. J., Mattoo, S., and Levy, R.: MODIS Cloud
25
screening for remote sensing of aerosol over oceans using spatial variability, Geophys. Res. Lett., 29, MOD04, doi:10.1029/2001GL013252, 2002.
Pelletier, B., Santer, R., and Vidot, J.: Retrieving of particulate matter from opti-cal measurements: A semiparametric approach, J. Geophys. Res., 112, D06208, doi:10.1029/2005JD006737, 2007.
30
Pope, C. A. III. and Dockery, D. W.: Health Effects of Fine Particulate Air Pollution: Lines that Connect, J. Air Waste Manage., 56, 709–742, 2006.
Mech-ACPD
8, 327–365, 2008
Particulate matter air quality P. Gupta and S. A. Christopher Title Page Abstract Introduction Conclusions References Tables Figures ◭ ◮ ◭ ◮ Back Close Full Screen / Esc
Printer-friendly Version Interactive Discussion
EGU
anisms and Who’s at Risk?, Env. Health Persp., (Supp. 4), 104, 713–723, 2000.
Pope, C. A., III., Burnett, R. T., Thun, M. J., Calle, E. E., Krewski, D., Ito, K., and Thurston, G. D.: Lung Cancer, Cardiopulmonary Mortality, and Long-Term Exposure to Fine Particulate Air Pollution, J. Am. Med. Assoc., 287, 1132–1141, 2002.
Prados, A. I., Kondragunta, S., Ciren, P., and Knapp K. R.: GOES Aerosol/Smoke Product
5
(GASP) over North America: Comparisons to AERONET and MODIS observations, J. Geo-phys. Res., 112, D15201, doi:10.1029/2006JD007968, 2007.
Remer, L. A., Kaufman, Y. J., Tanr ´e, D., Mattoo, S., Chu, D. A., Martins, J. V., Li, R.-R., Ichoku, C., Levy, R. C., Kleidman, R. G., Eck, T. F., Vermote, E., and Holben, B. N.: The MODIS Aerosol Algorithm, Products and Validation, J. Atmos. Sci., 62, 947–973, 2005.
10
Wang, J. and Christopher, S. A.: Intercomparison between satellite-derived aerosol optical thickness and PM2.5mass: implications for air quality studies, Geophys. Res. Lett., 30, 21, 2095, doi:10.1029/2003/GL018174, 2003.
Wang, J. and Martin, S. T.: Satellite characterization of urban aerosols: Importance of includ-ing hygroscopicity and mixinclud-ing state in the retrieval algorithms, J. Geophys. Res., 112, D17,
15
ACPD
8, 327–365, 2008
Particulate matter air quality P. Gupta and S. A. Christopher Title Page Abstract Introduction Conclusions References Tables Figures ◭ ◮ ◭ ◮ Back Close Full Screen / Esc
Printer-friendly Version Interactive Discussion
EGU
Table 1. MODIS aerosol parameters (MOD04, collection 5) used in the current study.
No. Parameter Description
1 Latitude Geodetic latitude of each AOT pixel 2 Longitude Geodetic longitude of each AOT pixel
3 Solar Zenith Solar zenith angle corresponding to each pixel 4 Optical Depth Land And Ocean Aerosol optical thickness at 0.55 µm
for both ocean (best) and land (corrected) 5 Cloud Fraction Land Cloud cover fraction for each pixel
determined by spatial technique (Martin et al., 2002) 6 Cloud Mask QA Cloud mask quality assurance originally derived at
1×1 km that is recomputed at 10×10 km spatial resolution to determine cloudy and clear pixels, land surface type, sun glint, day/night, and snow/ice. Stored as 1 byte SDS 7 Quality Assurance Land Run time quality assurance flag f,or AOT over land
contains product quality flags, retrieval processing flags and input data resource flags. Stores in 5 byte SDS.
ACPD
8, 327–365, 2008
Particulate matter air quality P. Gupta and S. A. Christopher Title Page Abstract Introduction Conclusions References Tables Figures ◭ ◮ ◭ ◮ Back Close Full Screen / Esc
Printer-friendly Version Interactive Discussion
EGU
Table 2. Criteria used to obtain coincident MODIS–Terra AOT data over PM2.5locations.
Quality Flags
Criteria Box size around Surface SZA AOT Cloud No. ground stations type (deg) Flag Flag 1 ±0.25 deg. (∼5×5 pixels) – – – – 2 ±0.20 deg. (∼4×4 pixels) – – – – 3 ±0.15 deg. (∼3×3 pixels) – – – – 4 ±0.15 deg. (∼3×3 pixels) Land ≤60 – – 5 ±0.15 deg. (∼3×3 pixels) Land ≤60 – 0–90 % 6 ±0.15 deg. (∼3×3 pixels) Land ≤60 – 0–60 % 7 ±0.15 deg. (∼3×3 pixels) Land ≤60 – 0–30 % 8 ±0.15 deg. (∼3×3 pixels) Land ≤60 G and VG – 9 ±0.15 deg. (∼3×3 pixels) Land ≤60 G and VG 0–30% SZA: Solar Zenith Angle, AOT: Aerosol Optical Thickness.
ACPD
8, 327–365, 2008
Particulate matter air quality P. Gupta and S. A. Christopher Title Page Abstract Introduction Conclusions References Tables Figures ◭ ◮ ◭ ◮ Back Close Full Screen / Esc
Printer-friendly Version Interactive Discussion
EGU
Table 3. Regression coefficients, mean and standard deviation (σ) of PM2.5and MODIS AOT.
Slope Intercept R Counts PM2.5 σ AOT σ
Year 2000 35.81 16.62 0.58 147 25.09 12.63 0.24 0.21 2001 28.95 16.39 0.50 181 22.02 10.95 0.20 0.19 2002 21.27 14.78 0.51 167 19.50 9.35 0.22 0.22 2003 22.36 15.43 0.50 165 19.88 9.65 0.20 0.22 2004 25.52 16.18 0.46 158 20.16 10.41 0.16 0.19 2005 32.13 16.33 0.57 169 22.67 11.71 0.20 0.21 2006 26.36 13.67 0.60 103 18.23 8.58 0.17 0.20 Mean 27.48 15.63 0.53 156 21.08 – 0.20 – Month 1 18.34 13.28 0.29 92 14.93 7.60 0.09 0.12 2 8.55 14.04 0.08 73 14.78 7.35 0.09 0.07 3 12.03 14.43 0.17 110 15.91 7.73 0.12 0.11 4 29.11 14.33 0.44 109 19.18 9.59 0.17 0.15 5 24.91 15.43 0.51 92 21.59 8.80 0.25 0.18 6 19.10 18.08 0.46 82 24.45 9.74 0.33 0.23 7 25.82 15.20 0.57 73 26.31 10.61 0.43 0.24 8 20.54 19.13 0.49 87 27.87 9.52 0.43 0.23 9 28.81 19.61 0.56 90 26.52 11.47 0.24 0.23 10 50.59 18.72 0.64 101 26.60 13.03 0.16 0.16 11 47.90 16.02 0.49 94 20.35 11.52 0.09 0.12 12 −14.34 17.98 −0.11 87 17.14 8.17 0.06 0.06 Mean 22.61 16.35 0.38 91 21.30 9.59 0.20 0.16
ACPD
8, 327–365, 2008
Particulate matter air quality P. Gupta and S. A. Christopher Title Page Abstract Introduction Conclusions References Tables Figures ◭ ◮ ◭ ◮ Back Close Full Screen / Esc
Printer-friendly Version Interactive Discussion
EGU
Table 4. Effect of box size on AOT values at daily, monthly and yearly scales.
Daily
Box Min. Max. Mean Std. Dev. Days (%) AOT5 0.010 1.370 0.198 0.205 45.049 AOT4 0.010 1.370 0.190 0.201 41.635 AOT3 0.010 1.410 0.185 0.197 37.000 Monthly AOT5 0.016 0.583 0.200 0.136 47.359 AOT4 0.019 0.610 0.196 0.138 43.680 AOT3 0.019 0.652 0.195 0.139 38.571 Yearly AOT5 0.156 0.235 0.196 0.027 42.818 AOT4 0.138 0.226 0.188 0.030 39.491 AOT3 0.142 0.228 0.184 0.027 34.873
ACPD
8, 327–365, 2008
Particulate matter air quality P. Gupta and S. A. Christopher Title Page Abstract Introduction Conclusions References Tables Figures ◭ ◮ ◭ ◮ Back Close Full Screen / Esc
Printer-friendly Version Interactive Discussion
EGU
Table 5. Effect of quality flags on mean AOT values over the stations. Daily, monthly and yearly
differences (BEST-AOT).
Daily
Difference Min. Max. Mean CN9-CN3 −0.0800 0.0800 −0.0028 CN9-CN4 −0.1100 0.0800 −0.0032 CN9-CN5 −0.1100 0.0800 −0.0032 CN9-CN6 −0.1100 0.0800 −0.0031 CN9-CN7 −0.0700 0.0800 −0.0022 CN9-CN8 −0.1100 0.0700 −0.0004 Monthly CN9-CN3 −0.1120 0.1333 −0.0149 CN9-CN4 −0.1158 0.1630 −0.0115 CN9-CN5 −0.1158 0.1630 −0.0115 CN9-CN6 −0.1158 0.1630 −0.0102 CN9-CN7 −0.0606 0.1450 −0.0034 CN9-CN8 −0.0545 0.0783 −0.0031 Yearly CN9-CN3 −0.0411 −0.0006 −0.0182 CN9-CN4 −0.0426 0.0003 −0.0179 CN9-CN5 −0.0426 0.0003 −0.0179 CN9-CN6 −0.0380 −0.0017 −0.0172 CN9-CN7 −0.0199 −0.0004 −0.0105 CN9-CN8 −0.0124 0.0017 −0.0041
ACPD
8, 327–365, 2008
Particulate matter air quality P. Gupta and S. A. Christopher Title Page Abstract Introduction Conclusions References Tables Figures ◭ ◮ ◭ ◮ Back Close Full Screen / Esc
Printer-friendly Version Interactive Discussion
EGU
Table 6. Difference in AOTs for each criterion averaged over each month separately over entire
time period. Month Difference CN9-CN3 CN9-CN4 CN9-CN5 CN9-CN6 CN9-CN7 CN9-CN8 1 −0.0122 −0.0045 −0.0045 −0.0058 −0.0006 −0.0034 2 −0.0149 −0.0151 −0.0151 −0.0087 −0.0025 −0.0057 3 −0.0131 −0.0097 −0.0097 −0.0095 −0.0079 −0.0079 4 −0.0171 −0.0174 −0.0174 −0.0177 −0.0051 −0.0106 5 −0.0225 −0.0210 −0.0210 −0.0208 −0.0134 0.0021 6 −0.0298 −0.0196 −0.0196 −0.0194 −0.0077 0.0001 7 −0.0155 −0.0041 −0.0041 −0.0041 0.0045 −0.0108 8 0.0060 0.0112 0.0112 0.0112 0.0155 0.0129 9 −0.0141 −0.0112 −0.0112 −0.0108 −0.0117 0.0010 10 −0.0182 −0.0175 −0.0175 −0.0131 −0.0075 −0.0009 11 −0.0179 −0.0188 −0.0188 −0.0143 −0.0013 −0.0089 12 −0.0080 −0.0073 −0.0073 −0.0072 −0.0003 −0.0039 Mean −0.0148 −0.0113 −0.0113 −0.0100 −0.0032 −0.0030
ACPD
8, 327–365, 2008
Particulate matter air quality P. Gupta and S. A. Christopher Title Page Abstract Introduction Conclusions References Tables Figures ◭ ◮ ◭ ◮ Back Close Full Screen / Esc
Printer-friendly Version Interactive Discussion
EGU
Fig. 1. Study area with location of PM2.5 ground stations in Birmingham, AL. Also shown is a zoomed satellite image (courtesy Google) of the region with three different box sizes (3×3, 4×4, and 5×5) used to collocate MODIS observations. Red colored boxes are just relative representation of box size and not drawn on actual pixel size scale.
ACPD
8, 327–365, 2008
Particulate matter air quality P. Gupta and S. A. Christopher Title Page Abstract Introduction Conclusions References Tables Figures ◭ ◮ ◭ ◮ Back Close Full Screen / Esc
Printer-friendly Version Interactive Discussion
EGU
Fig. 2. Time series analysis of PM2.5mass concentration over NBHM site starting from January 2000 to June 2006. Background colors show air quality categories. Daily variations are shown in thin light gray line, monthly mean in thick gray line and yearly means are shown in thick black line. Two red lines show new daily and annual national standard for PM2.5mass whereas dotted blue line shows old annual USEPA standards.
ACPD
8, 327–365, 2008
Particulate matter air quality P. Gupta and S. A. Christopher Title Page Abstract Introduction Conclusions References Tables Figures ◭ ◮ ◭ ◮ Back Close Full Screen / Esc
Printer-friendly Version Interactive Discussion
EGU
Fig. 3. Time series analysis of MODIS AOT over NBHM from 24 February 2000 to June 2006.
Daily variations are represented by thin light gray line, monthly mean represented by thick gray line and yearly means are shown as thick black line.
ACPD
8, 327–365, 2008
Particulate matter air quality P. Gupta and S. A. Christopher Title Page Abstract Introduction Conclusions References Tables Figures ◭ ◮ ◭ ◮ Back Close Full Screen / Esc
Printer-friendly Version Interactive Discussion
EGU
Fig. 4. Frequency distribution of number of days (%) falling in any particular air quality category
during each month over NBHM starting from February 2000 to June 2006. Air quality categories are derived from PM2.5mass concentration as defined by USEPA and represented by different colors. Green is good air quality, Yellow is moderate, Orange is unhealthy for sensitive groups, and Red is unhealthy. Mean frequency for each month over all years is presented as line and open circle for each air quality category and plotted on top axis. Solid line: Good, dotted line: Moderate, dash line: unhealthy for sensitive groups.
ACPD
8, 327–365, 2008
Particulate matter air quality P. Gupta and S. A. Christopher Title Page Abstract Introduction Conclusions References Tables Figures ◭ ◮ ◭ ◮ Back Close Full Screen / Esc
Printer-friendly Version Interactive Discussion EGU (a) (b) Fig. 5.
Fig. 5. Time series analysis of difference in PM2.5mass over NBHM site starting from February
2000 to June 2006. (a) number of days (%) MODIS AOT data are available over NBHAM and
(b) the monthly mean PM2.5 mass from all ground observation minus PM2.5 mass from only those days when MODIS AOT data are available. Solid line with filled circle shows yearly mean values. Horizontal thick black line in panel (a) is for all time mean values corresponding to 47.4%.