HAL Id: insu-03130581
https://hal-insu.archives-ouvertes.fr/insu-03130581
Submitted on 4 Feb 2021
HAL is a multi-disciplinary open access
archive for the deposit and dissemination of
sci-entific research documents, whether they are
pub-lished or not. The documents may come from
teaching and research institutions in France or
abroad, or from public or private research centers.
L’archive ouverte pluridisciplinaire HAL, est
destinée au dépôt et à la diffusion de documents
scientifiques de niveau recherche, publiés ou non,
émanant des établissements d’enseignement et de
recherche français ou étrangers, des laboratoires
publics ou privés.
Gravity wave spectra in the middle atmosphere as
observed by Rayleigh lidar
Richard Wilson, Alain Hauchecorne, Marie-Lise Chanin
To cite this version:
Richard Wilson, Alain Hauchecorne, Marie-Lise Chanin. Gravity wave spectra in the middle
atmo-sphere as observed by Rayleigh lidar. Geophysical Research Letters, American Geophysical Union,
1990, 17 (10), pp.1585-1588. �10.1029/GL017i010p01585�. �insu-03130581�
GEOPHYSICAL RESEARCH LETTERS, VOL. 17, NO. 10, PAGES 1585-!588, SEPTEMBER 1990
GRAVITY WAVE SPECTRA IN THE MIDDLE ATMOSPHERE AS OBSERVED
BY RAYI.EIGH LIDAR
R. Wilson, A. Hauchecorne, M.L. Chanin
Service d'A•ronomie du CNRS, Verderes !e Buisson Cedex, France
Abstract. Rayleigh lidar offers the unique ability to make routine measurements of temperature (or density) mesoscale fluctuations in the 30 to 75 km altitude range. Power spectra of density and temperature fluctuations, versus vertical wavenumber and (apparent) frequency, are derived from Iidar measurements. These spectra are interpreted in the framework of the gravity wave theory. Power spectral density increases from the stratosphere to the mesosphere in the entire accessible spectral range. Comparison with vertical spectra obtained with various sounding systems indicates a dispersion of the temperature power spectra in the stratosphere as an increase with altitude of the ratio of potential to kinetic energy.
Introduction
Experimental evidence indicates a large similarity, in both shape and amplitude, in the power spectral density (PSD) of the wind and temperature mesoscale fluctuations in the middle atmosphere. Wind and temperature (or density) fluctuations data have been collected in the middle atmosphere with various sounding systems: mainly by balloon borne instruments,
raxtar, lidar and rocket sounding. Nevertheless, the altitude range from 30 to 70 km is still unexplored, the vJind and temperature fluctuations being obtained mainly by sporadic rocket soundings. Rayleigh lidar offers the unique feature of
murine measurement in this altitude domain. Them are now
two operating Rayleigh lidars in southern France: at the Observatoire de Haute Provence (OHP) in the foothills of the Alps (44øN, 6øE), and at Biscarosse (BIS) on the Ariantic coast (44øN, IøW). Data from these two sites are used in this study.
The nature of the mesoscale fluctuation field in the middle
atmosphere is controversial. Van Zandt [!982] showed that the observed atmospheric spectrum of the mesoscale fluctuations can result, as in the ocean, from an internal gravity wave field, the so-called "universal spectrum". Another interpretation of the mesoscale variability of the atmosphere has been advanced by Gage [1979] who suggests that the horizontal wavenumber and frequency spectra of the horizontal wind fluctuations could result from two-dimensional (2D) turbulent eddies. No
conclusion on the nature of the mesoscale fluctuations can be
made from the measure of a single atmospheric parameter because both theories lead to similar predictions for some of the spectral characteristics of the motions. However, even if these two mechanisms coexist in the atmosphere, the density or temperature fluctuations observed by Rayleigh lidar are associated with vertical displacememt of the atmospheric fluid and thus should be less contaminated by 2D turbulence than horizontal wind measurements (pure 2D turbulence is constrained to horizontal planes). Therefore, the smallest vertical scale observable by Rayleigh !idar being of roughly one km, an a priori hypothesis of no contamination by 2I)
tt•ulence is made. The lidar data are thus interpreted in the framework of the gravity wave '•eo•.
Tl•e spectral characteristics of be mesoscale density (or tem•a•e) fluctuations 'm the stratosphere and mesosphere,
Copyright 199:0 by the AJaerican Geophysical Union.
Paper number 90GL0!525
009•-8276/90 / 90GL-01525 $03 ß O0
versus vertical wavenumber and apparent frequency, from a data set obtained by Rayleigh lidars, are presented. These spectra are then compared with temperature and horizontal wind spectra obtained by various sounding systems.
Data analysis
The backscattered light from a pulsed laser beam sent vertically into. the atmosphere is due, in the absence of aerosols, to Rayleigh scattering from neutral molecules and is thus directly proportional to the atmospheric density, p. The relative density fluctuations, p'/po, are estimated as the first order perturbation term of the vertical profile of log(p). The ab•oolute temperature can be deduced from the relative density measurements by using the ideal gas law, assuming hydrostatic equilibrium, and by fitting the temperature profile at the top of the measurement, i.e. where the statistical error on the number of counted photons is 15%, typically above 80 km (for more details see Chanin and Hauchecorne [1984]).
From the mean density, Po, estimated by low pass filtering, the static stability (characterized by the Brunt-V'•iis•.la frequency N) of the atmosphere is deduced. The available potential energy per unit mass, Ep, associated with a verti• displacement • of an air parcel is given by:
Ep
= 21--N2=
(1)High resolution measurements are performed to study gravity waves: the vertical integration is 300 m and the temporal integration 15 min. The altitude domain is di'vided as follows: the upper strato:sphere, from 30 to 45 km, the lower mesosphere, from 45 to 60 km, and the middle mesosphere,
either 55 to 70 km or 60 to 75 krn.
The perturbation temperatures or densities, from which vertical wavenumber spectra are derived, are extracted by subtracting from the raw vertical profile (or from its logarithm) a third order polynomial fit applied to the 15 km altitude domain. In the case of frequency analysis a linear trend is removed from the raw data at a given altitude level. In order to reduce boundary effects, a Harming window is applied to the spatial or temporal series, the spectrum being then normalized to the variance of the raw data. The mean vertical spectrum is
averaged
over
all the
spectra
resulting.
from
15 rain
integration
time of the signal obtained during a given period, whereas the mean frequency spectrum is averaged over the altitude levels in a given height range. The 2I) spectra are obtained by applying a frequency Fourier Transform over the successive v•cal wavenumber spectra. The 2D spectrum thus describes, for each wavenumber, the phase evolution of the sinusoidal functions, Fourier Transforms of the vertical profiles (resulting from 15 min integration time) of the density perturbations. The zero frequency term of the 2D specmma represents the PSD of the fluctuations of periods larger th• be measurement duration, such flucraafions being vertically resolved. The in•gradon over frequendes of the 2D s peemma gives the 1D spectrum (versus vertical waven••).
For the vertical wavenumber spectra, the pemn'bations .are
1586 Wilson et al.: C•avity Wave Spectra in the Middle Atmosphere
static stability and temperature conditions (see eq. 2). The pem•rbations, in the frequency decomposition, are defined as (g/N)(o'/po), whose variance is simply twice the available potential energy. It has been verified that spectra obtained from density or temperature measurements give identical results.
Power spectra of the normalized density fluctuations in the stratosphere and mesosphere
The PSD of the density fluctuations is interpreted in the framework of the gravity wave theory. In order to discuss the following results, we first briefly review the theoretical predictions about the power spectra of saturated density (or temperature) fluctuations. Furthermore, the comparison of density and horizontal wind spectra must necessarily rely on a spectral modelling of the wave field.
Using dimensional analysis, Dewan and Good [1986] and Smith et al. [1987] argued that the convective saturation of the wave motions lead to a relative density (or temperature) PSD
versus vertical wavenumber, m, of the form:
N 4
FSp,/po(m)
=_
FST7To(m)
= o•
g2m
3
(2)
The index s indicates saturation and 0t is a coefficient of the
order of unity. Smith et al. [1987] estimate the spectral limit due to convective saturation process assuming a vertical wavenumber spectrum of the form:
1
Fp./po(m)
--.
l+(m/m,)
3
(3)
where m* is a characteristic wave number. Integrating over wavenumbers, we obtain:
F0,/0o(m)
= 10m3
(4)
This estimate depends upon the chosen shape of the vertical spectrum (eq. 3) and upon the spectral width of the saturated wave field, expressed by ln(m,/mc), where _mc is the largest wavenumber contributing to saturation. The ratio m,/mc, assumed to be invariant with altitude, is equal to 200. The frequency and vertical wavenumber spectra are independent. Furthermore, the PSD in the saturated range is independent of
the frequency
energy
distribution
due to the hypothesis
that
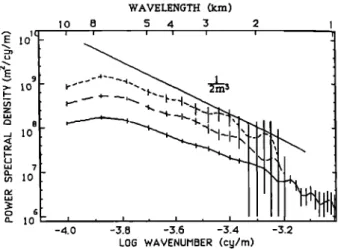
convective hastabilities are the only saturation mechanism. The normalized density fluctuations PSD versus vertical wavenumber in the upper stratosphere, lower mesosphere and middle mesosphere, are shown in figure 1. A straight line
1/2m
3 is plotted
for a direct
comparison
with the saturation
limit (eq.2). These spectra are monthly mean, averaged over
503 individual
spectra
(resulting
from 15 rain
integration
time
of the lidar signal), obtained during January 1989 at Biscarosse. The shape of these spectra remains very similar in the three height ranges, especially for low wavenumbers, the
slope
being
close
to -2 for vertical
scales
larger
than
3 or 4 km.
In the
upper
stratosphere,
from
30 to 45 km, the slope
of the
high
wavenumber
portion
of the spectrum,
for wavelengths
smaller than 3 km, is close to -3 as predicted by the saturation
theory,
whereas
the PSD
is a factor
of 2 below
the convective
limit of eq. 4 (a-1/20).
In the lower mesosphere (45 to 60 km) the PSD is larger than in the stratosphere in the entire accessible spectral range.
The high
wavenumber
portion
of the spectrum
is close
to the
saturation limit (eq.4) even if slighfiy larger (1/5<a<1/4). In the middle mesosphere (55 to 70 km) the PSD is again
larger
than
at lower
levels.
The
PSD
is close
to N2/2m
3
(1/3<a<1/2) for vertical wavelengths smaller than 4 km.
PSD versus
apparent
frequency
of the normalized
density
fluctuations are shown in figure 2. A -5/3 slope straight line is also plotted for comparison with proposed power law. These spectra are averaged over 5 long nights of measurements (11.5 hours), obtained during January 1989 at BIS. The spectral index p (the mean slope of the frequency spectrum), close to -2, does not change significantly from the stratosphere to the mesosphere. Nevertheless the contribution of large period modes (larger than 3 hours) seems to be comparatively more important in the stratosphere than at higher levels.
E lO •E >- lO • 10
,,, ø
m 1 6 a_ 10 WAVELENGTH (kin) l0 8 5 4 3 2 i i i i i i'*
- 0 -3.8 -3.6 -3.4 -3.2LOG WAVENUMBER (cy/rn)
Fig. 1 ' Power spectral density, versus vertical wavenumber,
of the relative
density
fluctuations
scaled
by g/N
2, in the
stratosphere (30-45 kin) [ .. ] , lower mesosphere (45-60 kin) [-- --] and middle mesosphere (55-70 km) [---]. A
straight
line
N2/2m
3 is plotted
for
comparison.
PERIOD (hours)
7 6 5 4 3 2 1
---.
_..,
..,.,.
-'T-""i'--.,t,.,
•
L
-4.4 -4.2 -4.0 -3.8 -3.6 LOG FREQUENCY (cy/s)
Fig. 2 ' Power
spectral
density
versus
apparent
frequency
of
the normalized density fluctuations observed in the
stratosphere
[
...
], lower
[-- --] and
middle
mesosp.
he•e
[-
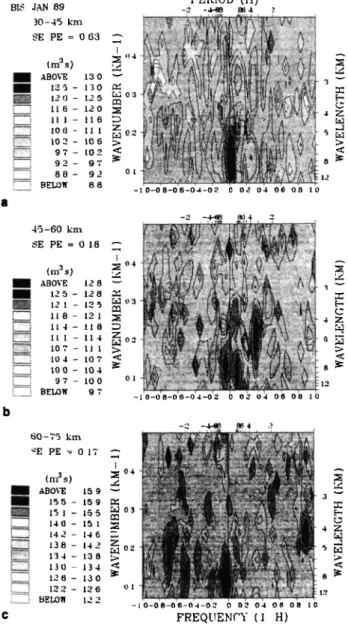
- -]. A straight line, of-5/3 slope, is plotted for comparison. The 2D spectra, versus vertical wavenumber and apparent
frequency
(figure
3), averaged
over
the same
nights
as the
frequency
spectra,
reveal
a change
with
altitude
of the
wave's
characteristics.
In the
upper
stratosphere
(30-45
km) most
of
the
energy
content
(63%)
lies
in stationary
modes
(or at least
of larger
period
than the measurement
time). In the
mesosphere
(45 to 60 km and
55 to 70 km)
the
"stationary"
modes
are
relatively
much
weaker
than
in the
stratosphere
(18
and 17% of the energy
content
respectively),
indicating
a
strong
damping
of low frequency
waves
in the mesosphere.
The existence of long period waves is confirmed by time-
height
plots
of the
temperature
fluctuations
which
show
quasi
Wilson
et al.: Gravity
Wave
Spectra
in the
Middle
Atmosphere
1587The observed increase with altitude of the normalized
density PSD is clearly in disagreement with the spectral limit advanced by Smith et al. [1987] (eq.4). The power spectra are
not
scaled
as
N 4 from
the
stratosphere
to the
mesosphere
The
disagreement could be due to some simplifications in the
spectral
modelling
of the wave
field,
mainly
to the neglect
of
inertial effects. The estimate of the saturation spectral limit from convective -Lastabilities induced by the wave field does not depend explicitly upon the frequency energy distribution.
The ratio me/m* may also vary significantly from the stratosphere to the mesosphere where the outer scale of turbulence mc -1, could reach a few hundreds meters [Hocking, 1985] and m* -] is observed to be of the order of 10 km. Furthermore, the assumption of a complete separability of the frequency and wavenumber spectra may be crude. Therefore, it is difficult to evaluate the effects of any change in the frequency distribution of the wave field (such as the damping of inertio-gravity waves in the mesosphere as suggested by the 2D spectra). This hypothesis call for further theoretical investigations.
PERIOD (H)
BI$ JAN 89 -2 -448 •4 2
:3o-4s
k,•
}\ •Z'
.''I!").
i"'
""
VV
' '
, • •- •2o • • 102 10 6 > • 92 - 97 • 88 - 92 0. t 1 • BELO• 8 8 _ 45-60 km
SE
PE
= 0 18
( m a s) ABOVE 12 8 "• 12 I - 125 • o 3 tts- t2t [• It 4 - tl 8 • 10.? - 11.1 104- 107•
100- 104
12• 97- ,oo
[--] BELO• 9 7 I ABOVE 15.9 • I t•- t•o • • ., ß ata
• - • • • ø• ":' -'•'•
• ' •0•
....
'• •'•
_
•
122
- 126 0.1
:'• '•,' ' ' ": " , ....
"
• BE•W
12
2
-10-08-•6-04-02•[
...
•,'{ilq,
0• 5 ,•'
O• 04 06 0.8FREQUENCY ( 1
Fig. 3: Two-dimension power spectra, function of the vertical wavenumber and apparent frequency, of the normalized density perturbations, in the stratosphere (a), lower (b) and mi'ddlc mesosphere (c).
Comparison with temperature and horizontal wind spectra
Temperature data have been obtained in the lower
stratosphere by mean of balloon borne instruments. Power spectra of relative temperature fluctuations (T/To) resulting from balloon measurements during November [Fritts et al.,
1988] and May [Sidi et al., 1988] in the 20.5-30 and 12-18 km height range respectively, and two lidar spectra (January and September 1989 at Biscarosse in the 30-45 km altitude domain) are superposed in figure 4. The monthly means of lanuary and September have been chosen because they are respectively representative of strong and weak wave activity, the seasonal variability of the wave activity being clearly annual in the stratosphere [Wilson et al., 1990]. Good agreement is found between these temperature spectra, taking into account the fact they have been obtained in various locations, time and altitude domains. Indeed, the spectral index is close to -3 in the high wavenumber portion of the spectra, the spectral amplitude ranging within a factor of four to five. Nevertheless, the variability from one spectrum to another appears to be significant. In the same height range the magnitude of the spectra obtained by lidar and in situ measurements ranges within a factor of 2 to 3, the higher energy levels occurring in the lower stratosphere.
E VERTICAL WAVELENGTH (km) 10 5 Z I .5 .2 . I L IO -1 •o lO .-4 -3 -2 I0 10 !0 VERTICAL WAVENUHBER
Fig. 4: Power spectral density of the relative temperature perturbations obtained by Rayleigh lidar during the months of January (Lj) and September (Ls) 1989 at Biscarosse, and by balloon borne instruments by Fritts et al. [1988] (F) and Sidi et al. [1988], (S).
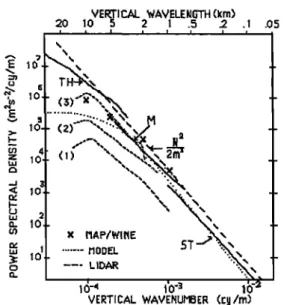
In figure 5, mean annual spectra of available potential energy in the upper stratosphere (30-45 km), lower mesosphere (45- 60 km) and middle mesosphere (60-75 km) are plotted with kinetic energy spectra obtained from smoke trail data in the stratosphere [Dewan et al. 1984], by rocket soundings [Hass and Mayer, 1987] and MST radars [Smith et al., 1987] in the
mesosphere,
and
by falling
spheres
in the
lower
thermosphere
[Smith et al., 1987]. The kinetic energy spectra are deduced from the zonal or the meridional wind perturbations (or a mean of the two components), whereas the available potential energy
spectra
are defined
as half of the PSD of the normalized
temperature
fluctuations
(g/N)(T'/To).
The potential
energy
spectra
are averaged
over
the
individual
spectra
obtained
by
Rayleigh lidar during four years at OHP, from 1984 to 1987. The PSD of available potential energy increases for all wavenumbers by roughly one order of magnitude from the
stratosphere
to the middle
mesosphere,
whereas
the kinetic
energy
PSD
does
not
change
significantly
in the same
height
range
(scaled
by N2). Such
a growth,
from
the upper
stratosphere
to the
lower
mesosphere,
of the
temperature
PSD
has also been observed by Shibata et al. [1988] (on the basis of 13 Rayleigh lidar profiles), whereas Tsuda et al. [1989]
1588 Wilson et al.: Gravity Wave Spectra in the Middle Atmosphere have shown, from MST radar measurements, that horizontal
wind
PSD
are
scaled
by N 2 in the
saturated
range.
.05
x MAP/WINE
...
MODEL
ST
_.2
...
•
---
LIDAR
'"•'•
,,,
VEETICAL WAVENUHBER (Ey/rn)
Fig. 5: Power spectral density of potential and kinetic energy versus vertical wavenumber in various altitude ranges (adapted from Smith et al., 1987). TH and M denote thermospheric and mesospheric horizontal velocity spectra [Smith et al., 1987]; ST denote stratospheric [Dewan et al., 1984]; X's represent a mean spectrum of the horizontal wind perturbations in the 30- 64 km altitude range, resulting from rocket soundings during the MAP-WINE campaign [Hass and Mayer, 1987]; short dashed lines are potential energy spectra deduced from lidar measurements, (1) in the stratosphere, (2) in the lower mesosphere and (3) in the middle mesosphere.
There is thus a significant increase in the ratio of potential to kinetic energy from the stratosphere to the mesosphere. This ratio, in the framework of the gravity wave theory, depends upon the frequency distribution of the wave field. Such an increasing ratio suggests a change in the frequency distribution of the waves, i.e. relatively lower frequency waves in the stratosphere than in the mesosphere. Selective transmission due to critical lines, wave generation or damping processes could modify the energy distribution versus frequency of the wave field. This assumption is supported by the 2D spectra (figure 3) which indicate a dominant contribution of low frequency modes in the stratosphere and of relatively higher frequency modes at higher levels. Dynamical instabilities should then be the main saturation process in the stratosphere whereas convective instabilities could be relatively more important in the mesosphere. Nevertheless the possibility that other processes, such as 2D turbulence, contribute to the mesoscale atmospheric variability cannot be excluded, even though it is not possible to reach a definitive conclusion from such a heterogeneous data set.
Conclusions
Some main features of the spectral energy distribution of the density (or temperature) fluctuations in the middle atmosphere have been described from Rayleigh lidar measurements. The PSD of the density fluctuations is observed to increase with altitude in the accessible spectral range. A large contribution in
the energy content of low frequency waves is observed in the
stratosphere,
these
long
period
waves
being
strongly
damped
in the lower
mesosphere.
In the stratosphere,
the temperature
fluctuations PSD versus vertical wavenumber vary within a
factor
of four,
in the
high
wavenumber
portion
of the
spectrmn
(assumed to be saturated), depending on season and altitude. An increase with altitude of the ratio of potential to kinetic energy is observed. Changes in the frequency distribution of the wave field with location, time and altitude could be the reason for •uch a dispersion of the temperature PSD in the stratosphere and for the observed increase with altitude of the ratio of potential to kinetic energy.
References
Chanin M.L. et A. Hauchecorne, Lidar studies of temperattire and density using Rayleigh scattering, MAP Handbook.
13, 87-99, 1984 -
Dewan E.M., N. Grossbard, A.F. Quesada and R.E. Good, Spectral analysis of 10 m resolution scalar velocity profiles in the stratosphere, Geophys. Res, Lett., 11, 80-83, 1984.
Correction, 11, 624, 1984.
Dewan E.M.and R.E. Good, Saturation and the "universal"
spectrum for vertical profile of horizontal scalar winds in the stratosphere, J. Geophys. Res, 91, 2742-2748, !986 Fritts D.C., T. Tsuda, T. Sato, S. Fukao and S. Karo;
Observational Evidence of a Saturated Gravity wave Spectrum in the troposphere and lower stratosphere, L
Atmos. Sci, 45, 1741-1759, 1988
Gage K.S., Evidence for k-5/3 law inertial range in mesoscale
two-dimensional turbulence, J. Atmos. Sci, 36. !950- 1954, 1979
1-Lass H. and Meyer W. Gravity wave field above Andoya, • Amos. Tom Phys., 49. 705-712., 1987.
Hocking W.K., Measurements of turbulent energy dissipation rates in the middle atmosphere by radar technique: A
review, Radio Sci, 20, 1403-1422, 1985
Shibata T., S. Ichimori, T. Narikiyo and M. Maeda, Spectral analysis of vertical temperature profiles observed by a lidar in the upper stratosphere and the lower mesosphcrc, J, Meteorol. Soc. Japan. 66, 1001-1005, 1988
Sidi C., J. Lefr•re, F. Dalaudier and J. Barat, An improved atmospheric buoyancy wave spectrum model,/ Geophys. Res., 93. 774-790, !988.
Smith S.A., D.C Fritts and T.E. Van Zandt: Evidence of a saturated spectrum of atmospheric gravity waves, J. Atrnos. Sci, 44, 1404-1010, 1987
Tsuda T., T. Inoue, D.C. Fritts, T.E. VanZandt, S. Kato, T. Sato and S. Fukao, MST radar observation of a saunated gravity wave spectrum, J. Amos. Sci, • 2440-2447,
1989
VanZandt T.E, A universal spectrum of buoyancy waves in the atmosphere, Geo_ohys. Res. Lett.. • 575-578, 1982 Wilson R., M.L. Chanin and A. Hauchecorne: Gravity waves
in the middle atmosphere observed by Rayleigh lidan Part 2: climatology, submitted to J. Geophys. Res. 1990 R. Wilson, M.L. Chanin, A. Hauchecorne, Service d'A•ronomie du CNRS, BP3, 91371 Verd•res-le-Buisson,
France
(Received January 4, 1990; revised March 22, 1990;