HAL Id: hal-02347537
https://hal.archives-ouvertes.fr/hal-02347537
Submitted on 28 Aug 2020
HAL is a multi-disciplinary open access
archive for the deposit and dissemination of
sci-entific research documents, whether they are
pub-lished or not. The documents may come from
teaching and research institutions in France or
abroad, or from public or private research centers.
L’archive ouverte pluridisciplinaire HAL, est
destinée au dépôt et à la diffusion de documents
scientifiques de niveau recherche, publiés ou non,
émanant des établissements d’enseignement et de
recherche français ou étrangers, des laboratoires
publics ou privés.
Distributed under a Creative Commons Attribution| 4.0 International License
compositions of South American and Southern African
aerosol sources to the South Atlantic Ocean
R. Khondoker, D. Weiss, T. van de Flierdt, M. Rehkamper, K. Kreissig, B.J.
Coles, S. Strekopytov, E. Humphreys-Williams, S. Dong, A. Bory, et al.
To cite this version:
R. Khondoker, D. Weiss, T. van de Flierdt, M. Rehkamper, K. Kreissig, et al.. New constraints
on elemental and Pb and Nd isotope compositions of South American and Southern African aerosol
sources to the South Atlantic Ocean. Applied Geochemistry, Elsevier, 2018, 78 (3), pp.372-384.
�10.1016/J.CHEMER.2018.05.001�. �hal-02347537�
Contents lists available atScienceDirect
Chemie der Erde
journal homepage:www.elsevier.com/locate/chemer
New constraints on elemental and Pb and Nd isotope compositions of South
American and Southern African aerosol sources to the South Atlantic Ocean
R. Khondoker
a, D. Weiss
a,⁎, T. van de Flierdt
a, M. Rehkämper
a, K. Kreissig
a, B.J. Coles
a,
S. Strekopytov
b, E. Humphreys-Williams
b, S. Dong
a,c, A. Bory
d, V. Bout-Roumazeilles
d,
P. Smichowski
e, P. Cid-Agüero
f, M. Babinski
g, R. Losno
h, F. Monna
iaDept. of Earth Science & Engineering, Imperial College London, SW7 2AZ, UK bNatural History Museum, London, SW7 5BD, UK
cCRPG, UMR-CNRS 7358, Vandœuvre les Nancy, France
dUniversity of Lille, CNRS, University of Littoral Côte d’Opale, UMR 8187, LOG, Laboratoire d’Orceanologie et de Géosciences, F 59000 Lille, France eNational Atomic Energy Commission, Av. Gral Paz 1499, Buenos Aires, Argentina
fUniversity of Magallanes, Avda. Bulnes, 01855, Punta Arenas, Chile gGeochronological Research Centre, University of São Paulo, São Paulo, Brazil hLISA Faculty of Science, University of Paris, Batiment P4 393, Paris, France iUniverisity of Bourgogne, Batiment Gabriel, Dijon, France
A R T I C L E I N F O
Handling Editor: Dewashish Upadhyay Keywords:
Isotopic and elemental composition Source characterisation
Geochemical assessment Aerosol
South America Southern Africa South Atlantic Ocean
A B S T R A C T
Improving the geochemical database available for characterising potential natural and anthropogenic aerosol sources from South America and Southern Africa is a critical precondition for studies aimed at understanding trace metal controls on the marine biogeochemical cycles of the South Atlantic Ocean. We here present new elemental and isotopic data for a wide range of sample types from South America and Southern Africa that are potentially important aerosol sources. This includes road dust from Buenos Aires and lichen samples from Johannesburg, soil dust from Patagonia, volcanic ash from the Andean volcanic belt, and aerosol samples from São Paulo. All samples were investigated for major (Al, Ca, Fe, Mg, Na, K, Mn) and trace element (Cd, Co, Cr, Cu, Ni, Pb, REE, Sc, Th, Y, V, Zn) concentrations and Nd and Pb isotopic compositions. We show that diagrams of
208Pb/207Pb vs.ε
Nd,208Pb/207Pb vs. Pb/Al, 1/[Pb], Zn/Al, Cd/Al, Cu/Al, andεNdvs. Pb/Al, and 1/[Nd] are best
suited to separate South American and South African source regions as well as natural and anthropogenic sources. A subset of samples from Patagonia and the Andes was additionally subjected to separation of afine (< 5μm) fraction and compared to the composition of the bulk sample. We show that differences in the geo-chemical signature of bulk samples between individual regions and source types are significantly larger than between grain sizes. Jointly, thesefindings present an important step forward towards a quantitative assessment of aeolian trace metal inputs to the South Atlantic Ocean.
1. Introduction
The atmosphere is a major pathway for delivering elements
essen-tial for primary production to surface waters (e.g.,Boyd et al., 2000;
Mahowald et al., 2005). Understanding the origin of aerosols that reach the ocean is a key challenge for deciphering marine biogeochemical processes and their possible impact on the global carbon cycle and on
the climate system (Morel et al., 2003; Mahowald et al., 2005). A
geographical area of particular interest is the South Atlantic, where the
source of nutrient supply has been discussed (e.g.,Boyd et al., 2000;
Galloway et al., 2004;Mahowald et al., 2005;Meskhidze et al., 2007;Li
et al., 2008), and where global dust models yield estimates on theflux
of nutrients that differ significantly (e.g., Prospero et al., 2002;
Mahowald et al., 2005, 2009;Gasso and Stein, 2007; Johnson et al., 2010).
Atmospheric modelling and satellite mapping indicate that Patagonia and the Puno-west Argentinian region are the main natural dust sources from South America to supply aerosols to the South
Atlantic Ocean (Prospero et al., 2002;Gasso and Stein, 2007). Large
arid regions such as the Namib, Sossusvlei and Kalahari deserts in South Africa are major dust sources on the other side of the South Atlantic (Chin, 2009). Due to the prevailing wind direction of the westerlies they
https://doi.org/10.1016/j.chemer.2018.05.001
Received 15 August 2016; Received in revised form 18 July 2017; Accepted 24 May 2018
⁎Corresponding author.
E-mail address:d.weiss@imperial.ac.uk(D. Weiss).
0009-2819/ © 2018 The Authors. Published by Elsevier GmbH. This is an open access article under the CC BY license (http://creativecommons.org/licenses/BY/4.0/).
however only deliver aerosols to the more proximal areas of the South
Atlantic (Piketh, 2002). Meanwhile, a study of geochemical
character-istics of aerosols over the South Atlantic Ocean (Witt et al., 2006)
re-vealed trace metal enrichment relative to the continental crust, asso-ciated with air mass back trajectories passing from South America
towards the South Atlantic. The data suggest a significant imprint of
South American anthropogenic sources on aerosols arriving at the
ocean (Witt et al., 2006). Dissolution studies furthermore imply that
anthropogenic aerosols typically release elements more readily into
seawater than natural particles (e.g., Spokes et al., 1994; Ebert and
Baechmann, 1998;Desboeufs et al., 2001;Sholkovitz et al., 2009;Hsu et al., 2010), an observation with far reaching implications for ocean biogeochemical cycles.
One way to distinguish natural and anthropogenic particulate
con-tributions in aerosols is by examining their geochemical fingerprint
alongside that of potential source regions (e.g.,Bollhöfer and Rosman,
2000; Monna et al., 2006;Gioia et al., 2010;Fujiwara et al., 2011). Variations in elemental and isotopic compositions of different source rock formations allows for source characterisation and thus provenance
assessment of aerosols (e.g.,Gaiero et al., 2003, 2004; Ferrat et al.,
2011). For example, Pb isotopes are useful provenance indicators due to
radioactive decay of232Th to208Pb,235U to207Pb and238U to206Pb
(e.g.Bollhöfer and Rosman, 2000;Gioia et al., 2010). It has been shown
that individual Pb-ore bodies carry distinct isotopic compositions de-pending on age and initial Th and U content of the source rock. This in turn allows depicting anthropogenic sources, which emit Pb from
dif-ferent ore bodies (e.g., Bollhöfer and Rosman, 2000and 2001).
Neo-dymium isotopes, on the other hand, are widely applied to distinguish
between natural sources exploiting the147Sm-143Nd decay system. The
Nd isotopic compositions are typically expressed asεNdvalues, which
denote the deviation of the143Nd/144Nd ratio of a rock from the bulk
earth value in parts per 10,000 (Jacobsen and Wasserburg, 1980).
Younger, mantle-derived rocks are thereby characterised by positive
εNd, whilst older, crustal rocks are characterised by negativeεNdvalues.
Numerous studies investigated the elemental and isotopic compo-sitions of natural sources, such as loess, volcanic deposits, and other rock formations, from the Andes and Patagonia in South America (e.g.,
Gaiero et al., 2003, 2004, 2007;GEOROC et al., 2003–2011GEOROC,
2018GEOROC et al., 2003–2011;Delmonte et al., 2004;Sugden et al.,
2009) and desert, ore deposit and volcanic regions across Southern
Africa (e.g., Condie and Hunter, 1976; Le Roex and Lanyon, 1998;
Janney et al., 2002;Le Roex et al., 2003;Ewart et al., 2004;Delmonte et al., 2004;GEOROC et al., 2003–2011GEOROC, 2018GEOROC et al., 2003–2011). In contrast, fewer studies on elemental or isotopic com-positions of anthropogenic aerosol sources from South America and Southern Africa have been conducted, resulting in limited data
avail-ability (e.g.,Bollhöfer and Rosman, 2000;Babinski et al., 2003;Monna
et al., 2006;Gioia et al., 2010;Gioia et al., 2017;Fujiwara et al., 2011). This study aims to extend the geochemical characterisation of po-tential natural and anthropogenic aerosol sources from South America and Southern Africa. A large range of samples were analysed for major and trace element concentrations, as well as for Pb and Nd isotope compositions. In detail, our study provides new data for road dust from Buenos Aires, lichen and tree bark from Johannesburg, additional bulk samples from Patagonia (mineral dust), the Andean Volcanic Belt (volcanic deposits), and São Paulo (urban aerosols). Moreover, we
analysed thefine grain size fraction (< 5 μm) of selected bulk samples
(samples that have not been particle size separated and include all gran sizes present at sampling site) to assess the importance of particle size
for geochemical source characterisation (Raes et al., 2000;Chang et al.,
2000;Honda et al., 2004;Feng et al., 2010;Ferrat et al., 2011). We use our new data, in conjunction with previously published results, to identify a suite of geochemical parameters, which are best suited to distinguish potential aerosol sources to the South Atlantic.
2. Methods 2.1. Study area
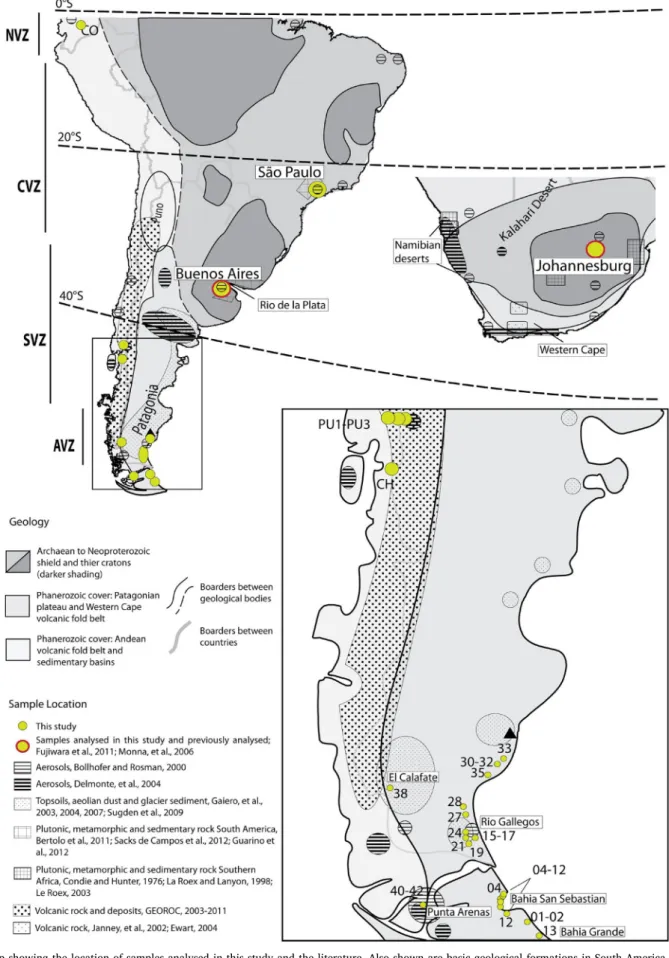
Fig. 1shows simplified geological maps of relevant potential source
areas for aerosols in South America and Southern Africa. South America can be divided into the northern and central Archean/Neoproterozoic shield area, known as the South American Platform, the Phanerozoic covers of the Patagonian plateau, and the Andean volcanic fold belt and sedimentary basins along the western margin of the continent. The South American Platform is composed of metamorphic rocks in am-phibolite to granulite facies and igneous, granitic complexes. It is constrained by volcanic and sedimentary formations along the eastern
margin resulting from the Brasiliano/Pan African extension (Almeida
et al., 2000;Brito Neves and Fuck, 2013). Patagonia is dominated by volcanic rocks (basalts, andesites, rhyolites) and plutons, as well as
sediment that overlies a granitic basement of Mesozoic age (Almeida
et al., 2000;Alkmim et al., 2001; Ducart et al., 2006; Rosello et al., 2008;Marfil and Maiza, 2012;Brito Neves and Fuck, 2013). The Andes can be subdivided into four volcanic zones: the northern volcanic zone (NVZ; > 10°S), central volcanic zone (CVZ; 10–34°S), southern
vol-canic zone (SVZ; 32–40°S) and austral volcanic zone (AVZ; 40–52°S).
They are composed of Cenozoic volcanism of silicic composition,
in-termediate to basic lavaflows along a volcanic arc to the west, and
basaltic back arc lavaflows across the east (Jakes and White, 1972;
Dostal et al., 1977;Grunder, 1987;Rapela and Kay, 1988;Kay et al., 2006;Stern and Kilian, 1996).
Southern Africa is largely composed of an Archean to
Neoproterozoic shield of intermediate to basic volcanic and
meta-morphic formations (Condie and Hunter, 1976;Le Roex et al., 2003;
Begg et al., 2009;Fig. 1). Phanerozoic covers (typically mafic, olivine
basaltic lavaflows and sedimentary basins) characterise the area to the
south of the shield, across the southern coastline of South Africa and
along the coastline of Namibia (Le Roex and Lanyon, 1998;Ewart et al.,
2004;Janney et al., 2002;Begg et al., 2009).
2.2. Sampling strategy and sample descriptions
The locations of samples selected for this study are shown inTable 1
andFig. 1alongside additional relevant samples from the literature. Also highlighted are samples from Buenos Aires and Johannesburg that were previously analysed for elemental or isotopic compositions.
Topsoil and riverbed sediments were collected in southern Patagonia in 2012 from Rio Santa Cruz, Bahia San Sebastian, Rio
Gallegos, El Calafate and Punta Arenas National Parks (34–55°S) to
represent potential mineral dust sources from Patagonia. Volcanic te-phra and clast deposits were collected from the volcanic slopes of Chaiten volcano in 2008 and the Puyehue volcano in 2011, to char-acterise the southern volcanic zone of Patagonia. Note that some of our results on the Chaiten volcano have also been reported by. One volcanic topsoil sample was obtained from Cotopaxi volcano in the northern volcanic zone in 2010, to cover a potential source area that may impact the South Atlantic during unusual atmospheric circulation patterns or large volcanic eruptions.
Size fraction samples (50–75 μm, and 75–100 μm) of road dusts
were collected in Buenos Aires between 2006 and 2007, to characterise
an important potential source for urban aerosols (Fujiwara et al., 2011).
A dustpan and brush were used to collect dust at pavement edges that accumulated over a two-month period, covering an area of about 7 × 12 km. Following collection, samples were sieved to remove large debris, such as leaves and brick, dried at 100 °C for 24 h and then sieved again. The samples were obtained from urban zones with different traffic patterns and urban characteristics, but were not collected
Fig. 1. Map showing the location of samples analysed in this study and the literature. Also shown are basic geological formations in South America (taken from
Table 1
Sample location and sample types from South America and Southern Africa.
Sample ID Sample Location Sample Type Longitude (°) Latitude (°) South America
Argentina Bulk
4a Bahia San Sebastian, Southern Patagonia Topsoil −68.39 −52.99
5 Bahia San Sebastian, Southern Patagonia Topsoil −68.39 −53.04 8 Bahia San Sebastian, Southern Patagonia Topsoil −68.50 −53.14 9 Bahia San Sebastian, Southern Patagonia Topsoil −68.57 −53.17 10 Bahia San Sebastian, Southern Patagonia Topsoil −68.57 −53.20 11 Bahia San Sebastian, Southern Patagonia Topsoil −68.57 −53.23 12 Bahia San Sebastian, Southern Patagonia Topsoil −68.52 −53.32 19 Rio Gallegos, Southern Patagonia Topsoil −69.53 −51.81 21 Rio Gallegos, Southern Patagonia Topsoil −69.60 −51.71 35 Rio Santa Cruz, Southern Patagonia Topsoil −68.94 −50.24 40 Punta Arenas, Southern Patagonia Topsoil −71.11 −53.29 42a Punta Arenas, Southern Patagonia Topsoil −71.11 −53.29
1 Rio Grande, Southern Patagonia Lagoon sediment −68.07 −53.59 2 Rio Grande, Southern Patagonia Lagoon sediment −68.07 −53.59 13 Rio Grande, Southern Patagonia Topsoil/Bed sediment −67.80 −53.83 15 Rio Grande, Southern Patagonia Topsoil/Bed sediment −69.28 −51.73 17 Rio Grande, Southern Patagonia Topsoil/Bed sediment −69.28 −51.73 24 Rio Grande, Southern Patagonia Topsoil/Bed sediment −69.64 −51.63 27 Bahia Grande, Southern Patagonia Topsoil/Bed sediment −69.51 −51.16 28 Bahia Grande, Southern Patagonia Topsoil/Bed sediment −69.53 −51.09 30 Rio Santa Cruz, Southern Patagonia Bed Sediment −68.90 −49.97 32a Rio Santa Cruz, Southern Patagonia Bed Sediment −68.90 −49.97
33 Rio Santa Cruz, Southern Patagonia Bed Sediment −68.56 −49.83 38 Argentino Lake, Southern Patagonia Bed Sediment −72.17 −50.31 50–75 μm
3C Urban Area, Buenos Aires Road dust −58.51 −34.60 9C Urban Area, Buenos Aires Road dust −58.48 −34.59 110C Urban Area, Buenos Aires Road dust −58.49 −34.65 112C Urban Area, Buenos Aires Road dust −58.49 −34.65 75–100 μm
3D Urban Area, Buenos Aires Road dust −58.51 −34.60 9D Urban Area, Buenos Aires Road dust −58.48 −34.59 110D Urban Area, Buenos Aires Road dust −58.49 −34.65 112D Urban Area, Buenos Aires Road dust −58.49 −34.65 Sample ID Sample Location Sample Type Longitude (°) Latitude (°) Brazil
< 10μm
631 Urban Area, São Paulo Aerosol −46.72 −23.56
648 Urban Area, São Paulo Aerosol −46.72 −23.56
649 Urban Area, São Paulo Aerosol −46.72 −23.56
650 Urban Area, São Paulo Aerosol −46.72 −23.56
660 Urban Area, São Paulo Aerosol −46.72 −23.56
665 Urban Area, São Paulo Aerosol −46.72 −23.56
Chile Bulk
CHa Chaiten Volcano, Southern Volcanic Zone Volcanic tephra −71.03 −43.02
PU1 Puyehue Volcano, Southern Volcanic Zone Volcanic tephra −71.16 −40.62 PU2a Puyehue Volcano, Southern Volcanic Zone Volcanic tephra −71.16 −41.06
PU3 Puyehue Volcano, lakeside near La Angostura Volcanic clast deposits −71.64 −40.76 Ecuador
Bulk
CO Cotopaxi Volcano, Northern Volcanic Zone Volcanic topsoil −78.44 −0.68 Southern Africa
South Africa Bulk
PILA Rural Area, Johannesburg Lichen 28.00 −26.00
Bulk
RIV Urban Area, Johannesburg Lichen 28.06 −26.06
DEL Urban Area, Johannesburg Lichen 28.00 −26.00
CMG Urban Area, Johannesburg Lichen 28.03 −26.20
EMER Urban Area, Johannesburg Lichen 28.01 −26.16
HUDD Urban Area, Johannesburg Lichen 28.11 −26.11
BOT2 Urban Area, Johannesburg Lichen 27.99 −26.15
Bulk
DRD-TB Mine Dump Site, Johannesburg Tree bark 27.88 −26.18
Aerosol samples (PM10) from São Paulo were selected to char-acterise emissions from an additional urban environment. These aerosol samples were collected at the University of São Paulo over a four-day period in the winter of 2005 using methods described in detail in
Babinski et al. (2003). The sampling area was located 500 m south of a
beltway with intense traffic. Stacked filter units were used to collect
aerosol on 47 mm diameter Teflon membranes, during 24 h, sampling
a < 10μm aerosol fraction, with an airflow rate of ∼ 16 l min−1.
The lichen and tree bark were collected in Johannesburg between 2001 and 2003, to characterise potential aerosols originating from
South Africa (Monna et al., 2006). Five lichen samples are from urban
areas, one lichen is from a rural area, whilst the single tree bark sample was collected adjacent to a mine dump site. Details of the sampling
locations and methods are given inMonna et al. (2006). In brief, lichen
growing on trees was collected between 1 and 3 m above ground level by means of pre-cleaned plastic knives. In the lab, remaining leaf debris were removed and the samples dried at 80 °C over a period of 2 days. 2.3. Sample digestion
Fifty milligrams of bulk topsoil, riverbed sediment, and volcanic samples were weighed into 14.7 ml screw top Savillex PTFE vessels and digested on a hotplate for 48 h in a mixture of 1 ml concentrated HF
(30 M) and 0.25 ml concentrated HNO3(15.6 M) at 120 °C with daily
ultrasonication following the digestion method of Yu et al. (2001).
Samples were then evaporated to dryness and re-fluxed twice in 0.5 ml
15.6 M HNO3to dissolve any solidfluorides that may have formed due
to excess HF, as insolublefluorides will affect the recovery of the rare
earth elements (REEs) and other trace metals.
Aerosolfilters from São Paulo (half a circular Teflon filter; 4.7 cm in
diameter) were acid washed with 5 ml 15.6 M HNO3at 120 °C for 24 h
in 14.7 ml screw top Savillex PTFE vessels to remove particulates. Following evaporation, these samples were then digested using the hotplate digestion procedure described above.
Fifty milligrams of lichen and tree bark from Johannesburg were weighed into 14.7 ml screw top Savillex PTFE vessels and treated with a
mixture of 2 ml concentrated HClO4(11 M) and 1 ml 15.6 M HNO3on a
hotplate for 1–3 h at 90 °C, then 1 h each at 110 °C, 140 °C, 180 °C and
220 °C in order to break down organics. The Savillex vials were un-capped throughout this procedure. Following this initial step, the samples were evaporated to dryness and then underwent the same HF/
HNO3digestion procedure described above.
After digestion, all samples were taken up in nitric acid to
ob-tain∼ 4 ml of sample solution in ∼ 0.8 M HNO3. From this solution,
1.5 ml were taken for Pb and Nd isotope ratio measurements, 1.5 ml for determination of elemental concentrations and 1 ml were archived. The
concentration aliquot was further diluted to 5 ml∼ 0.8 M HNO3prior
to analysis.
2.4. Elemental analysis
Major (Al, Ca, Fe, Mg, Na, K, Mn) and some trace element (Cd, Co, Cr, Cu, Ni, Pb, V, Zn) concentrations were determined by inductively coupled plasma atomic emission spectroscopy (ICP-AES) using a Thermo iCap 6500 Duo at the Natural History Museum (NHM) in London. Scandium, Th, Y, and REE concentrations were determined by quadrupole inductively coupled plasma mass spectrometry (ICP-MS) using an Agilent 7700 x instrument at the NHM. Detection limits for all elements were calculated after each run based on the signal intensity and standard deviation measurements of the calibration blank relative
to a calibration standard and were at or below the ng ml−1level for all
elements studied (see Supplementary Table S1). Procedural blank so-lutions were prepared with similar acid mixtures and under identical experimental conditions as the source samples and yielded concentra-tions below detection limits for all elements of interest. Supplementary Table S2 and S3 show the major, trace and rare earth elemental
concentration data.
Data quality, including total dissolution of samples, was monitored with the reference material USGS G-2 granite (n = 12). The con-centration data for G-2 are listed in supplementary Tables S2 and S3 alongside the results for samples. The reproducibility (expressed as ± 1 RSD, relative standard deviation) was better than 5% for major ele-ments, better than 3% for REEs, and better than 8% for other trace elements except Cd (< 23%) and Yb (< 13%). As the G-2 granite contains refractory phases, the results provide a measure for the max-imum uncertainty introduced by sample digestion.
2.5. Lead and Nd isotope analysis
Lead was isolated from the sample matrix by ion exchange
chro-matography using Eichrom Sr spec resin (Weiss et al., 2004).
Neody-mium was isolated using a two-step column procedure (Pin and
Zalduegui, 1997). The REE fraction was separated from the sample matrix using Eichrom TRU spec resin, followed by isolation of the Nd fraction from the other REEs using Eichrom Ln spec resin on volume-trically calibrated Teflon columns. Lead and Nd isotopic compositions were analysed on a Nu Plasma (Nu Instruments Limited, UK) MC-ICP-MS (multiple collector inductively coupled plasma mass spectrometer) instrument, to which samples were introduced with a DSN-100 Deso-lvation Nebulizer System and a PTFE nebulizer.
For Pb isotope analysis, samples and NIST SRM 981 Pb standards were doped with NIST SRM 997 Tl to a Pb/Tl ratio of 3:1 for correction of the instrumental mass bias using the technique of external
normal-isation (Weiss et al., 2004). The precision and accuracy of the Pb
iso-tope measurements were assessed using reference material USGS G-2
granite. Over afive-month period, repeated analyses yielded the
fol-lowing ratios and associated 2sd uncertainties:
206Pb/204Pb = 18.399 ± 0.016, 207Pb/204Pb = 15.640 ± 0.014, and
208Pb/204Pb = 38.902 ± 0.044 (n = 22). These results for USGS G-2
are in agreement with published data (18.396 ± 0.023,
15.636 ± 0.005, 38.900 ± 0.019, respectively, Weis et al., 2006).
Procedural blanks were negligible at < 50 pg.
For Nd isotope analysis, samples and the JNdi-1 Nd isotope standard
were corrected for mass fractionation by normalising to
146Nd/144Nd = 0.7219. Repeated analysis of the JNdi-1 yielded
143
Nd/144Nd ratios of 0.512147 ± 0.000016 (n = 26). All sample
re-sults were normalised to the recommended value of
0.512115 ± 0.000007 (Tanaka et al., 2000). Repeated analyses of the
USGS G-2 granite (n = 22) yielded 143Nd/144Nd ratios of
0.512230 ± 0.000025, in agreement with literature results
(143Nd/144Nd = 0.512235 ± 0.000015; Weis et al., 2006).
Neody-mium blanks were negligible at < 10 pg.
Lead and Nd isotopic compositions of the samples and the G-2 re-ference material are listed in supplementary Table S4.
2.6. Separation of a < 5μm diameter particle size fraction from South
American topsoils and riverbed sediments
Afine fraction (< 5 μm diameter) was separated from three topsoils
and riverbed sediments collected from Rio Gallegos, Bahia San Sebastian and Punta Arenas in southern Patagonia, and two volcanic tephra samples from the Chaiten and Puyehue volcanoes in the Andean volcanic belt, within western Patagonia (marked with an asterix in
Table 1).
Bulk samples were wet sieved with ultraclean (MQ) water through
60μm nylon mesh into 90 ml Savillex beakers. The supernatant was
siphoned off from the < 60 μm fraction using acid cleaned pipettes.
The < 60μm fraction was then transferred to 15 ml centrifuge tubes,
10 ml of MQ water was added, and samples were shaken with a vortex shaker and left to stand for 45 min to allow for gravimetric separation
of the < 5μm fraction. In water of 20 °C, a 5 μm diameter particle
containing the < 5μm fraction was subsequently siphoned into a
se-parate 15 ml centrifuge tube. The < 60μm fraction was re-filled with
MQ to 10 ml, shaken and left to stand for 45 min. This step was repeated
by up to 4 times until the complete < 5μm fraction was removed from
the < 60μm fraction. The < 5 μm fraction was then centrifuged for
45 min, the supernatant was removed, and thefine fraction sediment
was left to dry in a laminarflow hood. The resulting < 5 μm fractions
were digested and processed following the methods described in
Sections2.3–2.5.
The elemental concentrations and isotope compositions determined
for the < 5μm fine fraction samples are listed in supplementary Tables
S2 to S4.
3. Results and discussion
3.1. Geochemical characteristics of the sources
Following a detailed regression analysis of all available data (Tables S2 to S4), a number of element and isotope ratios were empirically
identified as providing the best available parameters for characterising
the various distinct source regions and types of aerosols. In detail, these are, Pb/Al, Zn/Al, Cu/Al, Cd/Al, V/Al, Ni/Al, Cr/Al, Co/Al, 1/[Pb], 1/
[Nd], and206Pb/207Pb,208Pb/207Pb andε
Nd(seeFig. 2).
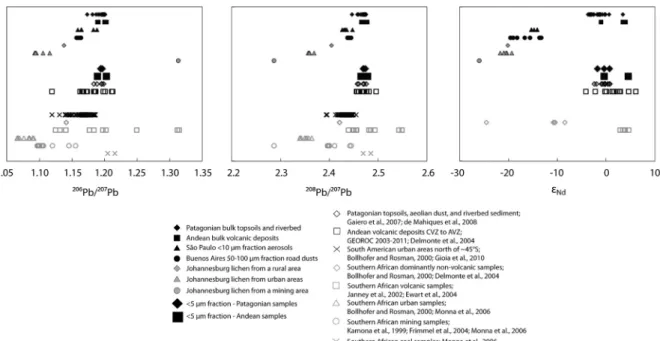
3.1.1. Patagonian top-soils and riverbed sediments
Trace element/Al ratios are low in the sediments from Patagonia, e.g., Pb/Al × 1000 ratios range from 0.1 to 0.3 and Zn/Al × 1000 ranges from 0.8 to 2. These results fall within the range of previously reported dust, topsoil, and riverbed sediment from across Patagonia (Gaiero et al., 2003, 2004;Fig. 2), suggesting that the samples are re-presentative of natural mineral dust sources from within Patagonia. The elemental compositions are, however, more homogenous than
pre-viously analysed samples from this region (Gaiero et al., 2003, 2004),
most likely due to the smaller geographical coverage. The 1/[Pb] and
1/[Nd] ratios and Pb and Nd isotope compositions expand beyond the
data ranges of previous studies (Figs. 2 and 3;Gaiero et al., 2003, 2004;
Gaiero et al., 2007;Mahiques et al., 2008), which suggests that our new results may be of value for defining the compositional endmembers of Patagonian dust sources. The Pb and Nd isotopic compositions are in
accord with the young age of the Patagonian range (Fig. 3).
To our knowledge, no Cd data have been previously reported for sediments from Patagonia. Our new results show very low Cd/
Al × 1000 ratios, in the range of 0.0007–0.006 (Fig. 2). Such ratios may
be a key elemental characteristic of loess samples from Patagonia and
may reflect Cd removal by aqueous processes (e.g.,Prokop et al., 2003).
3.1.2. Andean volcanic deposits
The volcanic deposits from the NVZ and SVZ show similar and low trace element/Al ratios as well as radiogenic isotopic compositions re-lative to previously reported data for basaltic to andesitic volcanic rocks
from across the CVZ to AVZ (GEOROC, 2003–2011GEOROC,
2018GEOROC, 2003–2011;Gaiero et al., 2003, 2004, 2007;Figs. 2 and
3). The isotopic results are in accord with the young age of the volcanic
deposits along the Andean belt. All assessed elemental and isotopic ratios, except for V/Al, exhibit a narrower range of values than litera-ture data. This narrower range may reflect that our samples represent a smaller selection of rock types and formations compared to those stu-died previously from across the Andean volcanic zones. V/Al ratios on the other hand show a broader range of values, which may be due to the limited data published for V. Our work hence expands the V/Al
end-member characterisation of Andean volcanics (Fig. 2). Lastly, although
the overall ranges in Cd/Al, Ni/Al, Co/Al and 1/[Pb] ratios defined by the samples are smaller than found in previous studies, for each ratio our samples expand the overall data range. For example, the Ni/ Al × 1000 ratios of our samples range from 0.005 to 0.4 whilst the literature range is from 0.02 to 3. Thus, an updated range for the Ni/
Al × 1000 ratios of Andean volcanic deposits is 0.005–3 (Fig. 2).
Fig. 2. Selected trace element/Al ratios, and 1/[Pb], 1/[Nd] data for samples from this study (filled symbols) and the literature (open symbols). All measurement uncertainties are smaller than the size of the symbols.
3.1.3. Aerosols from São paulo
To our knowledge, there is no previously published multi-element dataset for aerosols from São Paulo. The Pb/Al, Zn/Al, Cu/Al, Cr/Al ratios are generally higher for these aerosols than for natural rocks and
sediments from the São Paulo region (Fig. 2). For example Pb/
Al × 1000 ranges from 50 to 100 and Zn/Al × 1000 span values from
300 to 900 for the aerosols (Fig. 2). In contrast, ore deposits exposed at
São Paulo State, composed of lamprophyre, dioritic, carbonatitic and
magnetitic rock types, exhibit Pb/Al × 1000 ratios of 1.5–60 and Zn/
Al × 1000 ratios of 1–50 (Bertolo et al., 2011;Fig. 2). The208Pb/207Pb
ratios are low and in agreement with aerosols analysed between 1994
and 2005 from São Paulo (Bollhöfer and Rosman, 2000;Gioia et al.,
2010;Fig. 3,Gioia et al., 2017). Lead, Zn, Cu and Cd are all chalcophile metals with similar geochemical behaviour and distribution, whilst Cr is a lithophile transition element generally associated with oxide phases. Enrichments in Pb, Zn, Cu, Cd and Cr and low Pb isotope ratios compared to natural sources are typical of industrial emissions, such as non-ferrous metal processing, smelting, waste incineration, and
bio-mass, coal and oil combustion (e.g.,Nriagu and Pacyna, 1988;Pacyna
and Pacyna, 2001;Ulke and Andrade, 2001). Relatively low Pb isotope ratios have been found to correlate with some industrial and auto-mobile emissions from São Paulo and other major cities in South
America north of ∼45°S (Bollhöfer and Rosman, 2000; Gioia et al.,
2010; Gioia et al., 2017). This implies that Pb, Zn, Cu, Cd and Cr compositions exhibited by the aerosol samples from São Paulo are due to anthropogenic sources. The results also suggest that the main sources of anthropogenic aerosols in São Paulo have not changed significantly since 2005. As such, this study also provides improved constraints on the geochemical characteristics of anthropogenic aerosol sources in São Paulo.
Similarly, Nd isotope compositions have not been reported before for aerosols from São Paulo. We observe generally higher 1/[Nd] values
for the aerosols compared to natural sources (Fig. 2) as well as lowεNd
values of between−14.1 and −15.3 (Fig. 3). These results suggest that
the aerosols derived from re-suspension of soils generated by the al-teration of old Archean to Neoproterozoic rocks; supporting that the Nd values have been observed in re-worked particulates such as road dusts which can contain anthropogenic materials. It should be noted,
how-ever, that the lowεNdvalues reflect differences in regional geology and
are not of direct anthropogenic origin.
3.1.4. Road dusts from Buenos Aires
The Pb/Al, Zn/Al, Cu/Al and Cd/Al ratios are fairly high in the
selected size fractions of the road dust (50–75 μm and 75–100 μm), e.g.,
Pb/Al × 1000 ranges from 5 to 10 (Fig. 2). These elemental
composi-tions overlap with previously reported data for < 50 to 100μm grain
size separates (Fujiwara et al., 2011;Fig. 2). This implies that there is
no significant grain size effect on the Pb, Zn, Cu, and Cd concentrations
of road dust from Buenos Aires, at least for grain sizes < 100μm. The
samples show distinctively higher Zn/Al, Cu/Al, and Cr/Al ratios than
rocks from Buenos Aires (deCampos et al., 2012;Fig. 2). The high
metal/Al ratios of the samples, compared to natural sources, support the interpretation that road dusts are generally a mixture of
anthro-pogenic materials (i.e. traffic debris as well as vehicle and industrial
emissions) in line with the study byFujiwara et al. (2011).
To our knowledge Cr, V, Co, Sc, Y, Th, and REE data have not been previously reported for road dust from Buenos Aires. The high Cr/ Al × 1000 ratios of 8–40 are most likely derived from anthropogenic sources, as they are accompanied by enrichments in other pollutant trace metals. Meanwhile, Co/Al, Ni/Al and V/Al ratios are comparable
to geogenic rocks (Campos et al., 2012;Fig. 2), which suggest that not
all metals in Buenos Aires road dust are affected by anthropogenic sources.
The Pb isotope analyses of the road dust samples yielded 208
Pb/207Pb and206Pb/207Pb ratios of between 2.4391 and 2.4448, and
1.1605–1.1626, respectively (Fig. 3), in line with aerosols from other
major cities in South America and industrial and vehicle emissions from
north of∼45° S (Bollhöfer and Rosman, 2000;Gioia et al., 2010, 2017;
Fig. 3). Similarly, the Buenos Aires road dust displaysεNdvalues of
between −13.3 and −19.6 (Fig. 3), which resemblesεNdvalues of
aerosols from São Paulo. These similarities likely reflect that particu-lates in the road dust derived from rock with similar composition, of similar ages.
3.1.5. Lichen from a rural area from johannesburg
The lichen sample from a rural area near Johannesburg generally shows high trace element/Al ratios and high 1/[Pb] (with Pb/
Al × 1000 = 2.5;Fig. 2) as well as unradiogenic Pb and very lowεNd
values (e.g.,208Pb/207Pb = 2.4043;ε
Nd=−20.1;Fig. 3). This
compo-sition is within the range reported for non-volcanic rocks from around Johannesburg, central South Africa, and Namibia (Archean granitic
Fig. 3. Lead and Nd isotope compositions for samples from this study (filled symbols) and the literature (open symbols). All 2SD error bars are smaller than the size of the symbols.
rocks, ultramafic lavas, and metasedimentary rocks from the Barberton
Region in South Africa; Condie and Hunter, 1976; lamprophyre and
calk-alkaline formations, and lamprophyres and carbonatites from
Da-maraland in northern Namibia; Le Roex and Lanyon, 1998; aerosols
from the Namib desert;Bollhöfer and Rosman, 2000; kimberlitic
for-mations SW of Johannesburg from the Archean shield,Le Roex et al.,
2003;Figs. 2 and 3).
Volcanic rocks from Southern Africa (e.g., mafic to ultramafic vol-canics from the Etendeka Province in Namibia and along the Western
Cape Province in South Africa;Janney et al., 2002;Ewart et al., 2004;
Fig. 3) exhibit similar elemental compositions, but show more radio-genic Pb and Nd isotopic compositions than the rural lichen sample (Fig. 3). This suggests that the composition of the rural lichen
pre-dominantly records the Archean to Neoproterozoic geology (Tohver
et al., 2006;Begg et al., 2009,Fig. 1). Little more can be inferred as only a single sample was analysed. To our knowledge, there are no reported Cd data for rural lichen samples from South Africa and our
measure-ments suggest a Cd/Al × 1000 ratio of 0.03 (Fig. 2).
3.1.6. Lichen samples from an urban area of johannesburg
The lichen samples from urban areas of Johannesburg show high
trace element/Al ratios (e.g., Pb/Al × 1000 and Zn/Al × 1000 range
from 8 to 20;Fig. 2), except for V/Al and Co/Al. The208Pb/207Pb and
206Pb/207Pb ratios are very low and vary from 2.3573 to 2.3692, and
1.0936–1.1162, respectively (Fig. 3). The trace element/Al ratios and
1/[Pb] are within the range of data for non-volcanic and volcanic
re-gional rocks (Fig. 2). However, the Pb isotope ratios are lower than
those of natural samples (Fig. 3), and are similar to previously
pub-lished results for lichens from urban areas of Johannesburg (Monna
et al., 2006) and aerosols from major cities across South Africa (Bollhöfer and Rosman, 2000) (Fig. 3). This demonstrates that Pb iso-topic compositions reflect the Pb ores used in anthropogenic activities
in South Africa, as acknowledged byMonna et al. (2006)andBollhöfer
and Rosman (2000), and suggests that they are useful indicators of anthropogenic sources. It is also evident that trace element/Al ratios are unable to clearly distinguish between anthropogenic and natural aerosol sources in Southern Africa, in contrast to the observations made
for South America (Fig. 2).
3.1.7. Tree bark from a mining area from Johannesburg
To our knowledge, we here report thefirst multi-element data that
characterises aerosol emissions from mining regions of Southern Africa
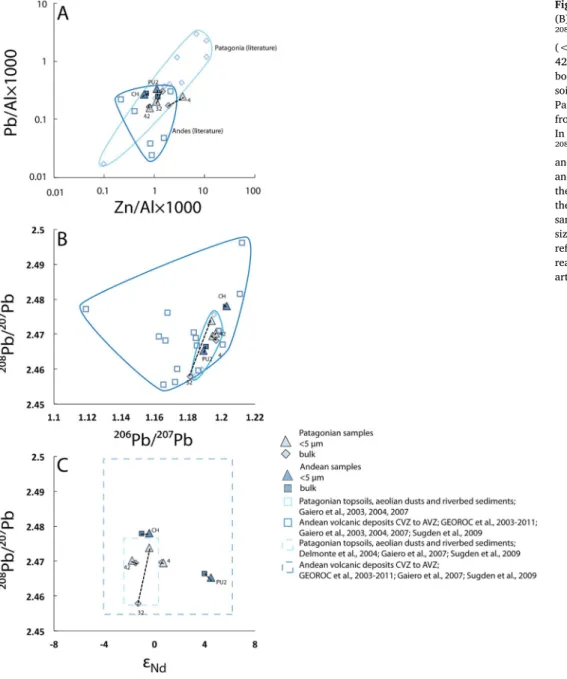
Fig. 4. (A) Pb/Al × 1000 vs. Zn/Al × 1000, (B) 208Pb/207Pb vs. 206Pb/207Pb, and (C) 208
Pb/207Pb vs. εNd for the fine fractions
(< 5μm) and bulk powders of samples 4, 32, 42, CH, and PU2 from this study (filled sym-bols). Also shown are literature data for top-soils, riverbed sediments and dust from Patagonia, as well as volcanic rock and tephra from the Andean volcanic belt (open symbols). InFig. 4C, the range of literature values for
208Pb/207Pb andε
Ndis denoted by light blue
and blue dashed boxes, respectively, as the Pb and Nd isotope results do not originate from the same studies. Dashed black lines connect thefine fractions and bulk powders of the same sample. All 1SD error bars are smaller than the size of the symbols. (For interpretation of the references to colour in thisfigure legend, the reader is referred to the web version of this article.)
(Table S2-S3). Trace element/Al ratios are high for tree bark sample
from a mine dump site in Johannesburg (e.g., Pb/Al × 1000≈ 8;
Fig. 2). These ratios, as well as 1/[Pb] ratios, are either within the range
or slightly elevated compared to regional source rocks (Fig. 2), whereby
the trace element enrichments may be linked to emissions from the mine dump. For example, Pb/Al is higher than previously reported for non-volcanic rocks but in line with the upper range reported for
vol-canic rocks (Fig. 2). The Zn/Al ratio is in accord with previously
re-ported data for non-volcanic rocks but higher than for regional volcanic
rocks (Fig. 2). The208Pb/207Pb ratio for the tree bark from the mine
dump site is very low at 2.2866, while the206Pb/207Pb ratio is relatively
high at 1.3133 (Fig. 3). Notably, 208Pb/207Pb agrees well with
pre-viously reported values for South African mining samples (Monna et al.,
2006), but the206Pb/207Pb ratio is higher than data previously reported
for a number of other regions (i.e. ore deposits from carbonate-hosted
sulphide deposits in Kabwe, Tsumeb and Kipushi, Namibia; Kamona
et al., 1999; ore deposits from Rosh Pinah Mine, Namibia;Frimmel et al., 2004). The differences in Pb isotopic compositions between
mining areas are most likely due to variations in the ages and U-Th/Pb
ratios of ores. For example, the high206Pb/207Pb ratio of the tree bark
sample analysed here may reflect the high uranium levels associated
with the Witwatersrand goldfields 5 km west of Johannesburg (Monna
et al., 2006).
The lichen from rural and urban areas, and tree bark from the
mining area presentεNdvalues between about−19 and −26, which
are generally lower than results reported for regional rocks (Fig. 3).
This is most likely because the Nd derived from relatively older rock formations as observed in South America.
3.2. Particle size effect on elemental and isotopic composition
Two topsoil samples, one riverbed sediment from Patagonia, and two volcanic tephra samples from the Chaiten and Puyehue volcanoes were chosen to explore whether element ratios and isotopic
composi-tions show a difference between the fine ( < 5 μm) fractions and bulk
powders of source samples. Results for Pb/Al and Zn/Al ratios, and Nd
and Pb isotopic compositions are shown inFig. 4.
Overall, differences that exceed the analytical uncertainties can be
observed for both, elemental concentrations and isotopic compositions.
For example, the Pb/Al × 1000 ratios offine fractions and bulk samples
differ by ∼0.05 to 0.10 for samples 4, 32 and PU2 (Fig. 4A). The
ob-served differences are, however, not unidirectional and are element
specific. Sample 32 exhibits the greatest difference in Pb/Al × 1000, whilst sample 4 shows the biggest difference in the Zn/Al × 1000 ratio (Fig. 4A). Differences in Pb isotope compositions between fine fractions and bulk samples range between 0.0003 and 0.0160, exceeding the
analytical uncertainty (Fig. 4B). The observed differences in element
ratios and Pb isotopic compositions between fine fractions and bulk
powders are expected, as different minerals can show distinct elemental
compositions, including variable U/Pb and Th/Pb ratios (e.g., Feng
et al., 2010). This in turn results in particle size control on sample compositions and/or elemental/isotopic heterogeneity in individual
samples. TheεNdvalues offine fractions and bulk samples show
dif-ferences of between 0.3 and 0.9, which are notable but not clearly
re-solvable, given the analytical uncertainty (Fig. 4C). In line with recent
literature, particle size hence does not significantly affect the εNdvalues
of rural and volcanic aerosol source regions in South America (e.g.,
Feng et al., 2009;Meyer et al., 2011).
The Pb/Al, Zn/Al, 208Pb/207Pb ratios and ε
Nd values of the fine
fractions and bulk samples fall within the range of previously reported
data forfine fractions and bulk powder samples from similar rural areas
(fine and < 63 μm fractions of topsoils, riverbed sediment and dust;
Fig. 4) and volcanic sources (fine fractions and bulk volcanic rock and
tephra;Fig. 4) from South America (e.g., 1.1191–1.2124 in206Pb/207Pb
and 2.4555–2.4964 in 208Pb/207Pb for volcanic sources from South
America,Fig. 4B;εNdvalues of−8.9 to +8.3 and of −4.2 to +6.1 for
rural and volcanic sources from South America,Fig. 4C). Given the
observed variations in elemental and isotopic compositions between the fine fractions and bulk samples from Patagonia and the Andes, it is important to note that these differences are significantly smaller than the variability of elemental and isotopic compositions for various sampling sites across South America. In particular, the variability as-sociated with particle size is smaller than compositional differences between samples of anthropogenic versus natural origin, for example between samples from Patagonia and the Andes versus samples from
São Paulo and Buenos Aires (Fig. 2). This suggests that the effect of
particle size on composition does not significantly affect the ability of
key geochemical parameters to discriminate between different aerosol
sources.
3.3. Summary of regions delineated by new and published geochemical data from South America and Southern Africa
Our new data provide important insights into source characteristics of key aerosol source regions of South America and South Africa. For example, the data for Patagonia and the Andes provide novel insights into the Cd concentrations of these natural sources and we also present
thefirst set of combined multi-element and isotopic data for
anthro-pogenic aerosols from São Paulo, to supplement the existing database of anthropogenic sources from South America. A further example is the Pb isotope signal of urban sources from Southern Africa, collected before the ban of leaded fuel. The current Pb isotope signal for urban sources from Southern Africa may trend towards a more natural source signal than we report in this study. However, the limited number of samples, as well as the geographical bias inherent to a small sample set, prevents application of the new results as a stand-alone dataset for characterising the aerosol sources of the South Atlantic Ocean. In conjunction with literature data, however, the geochemical characterisation of South American and South African sources can be revisited and suitable
tra-cers for key source areas and types of materials can be identified.
The NVZ is beyond the range of typical westerly wind circulation across South America, which carries aerosols to the South Atlantic. However, seasonal and unusual weather patterns may be associated with transports of volcanic particulates from the NVZ to the South Atlantic. We hence consider the geochemical characterisation of vol-canic deposits from the NVZ an important addition to existing data sets.
Patagonia and the Andes can be classified as a single major source
re-gion for natural aerosols in South America, as it is difficult to distin-guish the two areas based on elemental or isotopic compositions (Fig. 2). This reflects the occurrence and dispersal of similar volcanic deposits and rocks with Phanerozoic and younger age across Patagonia
and the Andes (Almeida et al., 2000).
Urban regions situated north of∼45°S in South America can be
collectively termed as the most significant anthropogenic aerosol source of South America, whereby the anthropogenic signal is primarily
de-rived from industrial and vehicle emissions (Bollhöfer and Rosman,
2000;Fujiwara et al., 2011). The elements Pb, Zn, Cu and Cd are hence most likely to show elevated concentrations due to the anthropogenic activities in these urban areas.
For Southern Africa, the natural aerosol sources fall into two groups that feature distinct elemental and isotopic signatures. One of these is dominated by the old continental crust of the Archean shield, which is primarily non-volcanic. In contrast, the other group is mainly re-presented by volcanic deposits of younger Phanerozoic age. The an-thropogenic aerosol sources of Southern Africa can be sub-divided into urban as well as mining- and coal-related sources. Industrial and vehicle emissions as well as mining and coal combustion are important an-thropogenic activities in Southern Africa and that some geochemical
data is available for such sources from previous work (e.g.,Bollhöfer
Table 2 Proposed characteristic elemental and isotopic composition of potential aerosol sources from South America and Southern Africa. Continent Category Sub-category Pb/Al x1000 Zn/Al x1000 Cu/Al x1000 Cd/Al x1000 V/Al x1000 Ni/Al x1000 Cr/Al x1000 South America Natural 0.02 − 3 0.1 − 10 0.04 − 3 0.0006 − 0.008 0.06 − 3 0.005 − 4 0.1 − 10 Anthropogenic urban 4 − 100 8 − 900 2 − 60 0.01 − 5 0.9 − 20 0.3 − 20 8 − 900 South Africa Natural non-volcanic 0.06 − 3 0.5 − 20 0.07 − 10 0.03 0.4 − 10 0.1 − 400 0.5 − 20 volcanic 0.03 − 61 − 22 − 3 0.001 − 0.006 3 − 5 0.6 − 31 − 2 Anthropogenic urban 8 − 20 10 − 20 3 − 6 0.02 − 0.05 2 − 31 − 21 0 − 20 mine 8 30 7 0.1 3 6 30 coal Continent Category Sub-category Co/Al x1000 1/[Pb] 1/[ μ g/g] 1/[Nd] 1/[ μ g/g] 208 Pb/ 207 Pb 206 Pb/ 207 Pb εNd South America Natural 0.02 − 20 0.0004 − 0.4 0.02 − 0.2 2.4465 − 2.4962 1.1191 − 1.2111 -4.2 to +6.1 Anthropogenic urban 0.1 − 3 0.0002 − 0.01 0.02 − 0.8 2.3950 − 2.4548 1.1190 − 1.1887 -19.6 to − 13.3 South Africa Natural non-volcanic 0.05 − 30 0.02 − 2 0.003 − 0.3 2.4043 − 2.4210 1.1380 − 1.1410 -24.5 to − 8.4 volcanic 0.05 − 0.07 0.002 − 0.4 0.01 − 0.06 2.4390 − 2.5493 1.1245 − 1.3149 +2.9 to +4.6 Anthropogenic urban 0.3 − 0.4 0.003 − 0.02 0.2 − 0.4 2.3420 − 2.4472 1.0690 − 1.1162 -21.7 to − 19.4 mine 5 0.004 − 0.1 0.6 2.3994 − 2.4420 1.0965 − 1.1556 − 26.0 2.2865 − 2.2866 1.3133 coal 0.06 − 0.1 2.4691 − 2.4853 a 1.2050 − 1.2190 a a Data taken from – Monna et al., 2006 .
3.4. Recommendations on geochemical proxies to distinguish aerosol sources from South America and Southern Africa
The elemental and isotopic data for natural and anthropogenic
aerosol sources that were acquired in this study (Table 2) and compiled
from the literature is of utility to studies that aim to constrain the origin
of marine aerosols, particularly from the South Atlantic Ocean.Fig. 5
shows the geochemical parameters that are best suited to distinguish (i) natural from anthropogenic aerosol sources, and (ii) South American from Southern African sources.
In South America, anthropogenic aerosol sources are characterised by relatively high Pb/Al, Cd/Al, Zn/Al, and Cu/Al ratios as well as
lower Pb isotope ratios compared to the major natural sources (Fig. 5),
and have shown association with lowεNdvalues. Important natural and
anthropogenic aerosol sources of South America are well separated in
bi-variant plots of208Pb/207Pb vs.εNd,208Pb/207Pb vs. Pb/Al, 1/[Pb],
Zn/Al, Cd/Al, Cu/Al, and plots ofεNdvs. Pb/Al, and 1/[Nd] (Fig. 5).
Pb/Al, Zn/Al, Cu/Al and Cd/Al ratios of aerosols in São Paulo are distinctly higher than in Buenos Aires aerosols. Whilst this may be re-lated to the distinct origins of the aerosols from the two cities, it may
also reflect the higher levels of anthropogenic activity in São Paulo, as a
consequence of the much larger area and population of São Paulo
(approx. 1500 km2 with 11 million inhabitants) in comparison to
Buenos Aires (approx. 200 km2with 3 million inhabitants).
Further-more, the higher 1/[Nd] values of São Paulo versus Buenos Aires aerosols separate the two urban source regions, whereby the aerosol Nd concentrations may reflect the distinct characteristics (e.g., mineralogy)
of the respective source emissions and/or areas (e.g.,Gallet et al., 1996;
Chang et al., 2000;Zdanowicz et al., 2006;Ferrat et al., 2011). In Southern Africa, the non-volcanic aerosol sources display lower
Pb isotope ratios (e.g.,208Pb/207Pb) andε
Ndvalues than the volcanic
sources (Fig. 5). Literature data for coal samples from Johannesburg
were included inFig. 4to constrain the likely geochemical variation
between coal-related and other sources from Southern Africa. However, the sample numbers are limited (n = 2) and the only geochemical data
available are Pb concentration and isotopic compositions (Monna et al.,
2006).Fig. 4suggests that South African natural sources have lower Pb/Al and higher Pb isotope ratios than urban and mining-related sources of Southern Africa. Non-volcanic and volcanic rocks display higher 1/[Pb] than lichen and other urban samples in Southern Africa (Fig. 5), which confirms that higher Pb concentrations are generally associated with the emission of anthropogenic Pb in urban areas. The volcanic and coal-related aerosol sources of Southern Africa show si-milar Pb isotope ratios, which are generally higher than the Pb isotope
ratios of urban and mining-related source areas (Fig. 5). This difference
presumably reflects that anthropogenic Pb is primarily associated with older ore deposits that record a long-term evolution with low U/Pb and Th/Pb ratios. Similarly, volcanic rocks can be discriminated from lichen
and ores by higherεNdvalues (Fig. 5), but keeping in mind that these
variations inεNdare of geological and not of anthropogenic origin.
The urban sources of South America are separated from the
Southern African urban sources by the higher 206Pb/207Pb and
208
Pb/207Pb ratios of the former (Fig. 5). This suggests that
anthro-pogenic sources of Pb in South America are derived from younger ore bodies than in Southern Africa. Southern African non-volcanic, urban, and mine-related, and South American urban aerosol sources can be distinguished from the volcanic sources of Southern Africa and non-volcanic and non-volcanic sources of South America by the less radiogenic
εNdvalues of the former (Fig. 5). Finally, plots of208Pb/207Pb vs. 1/[Pb]
separate the Southern African rural, volcanic as well as mine- and
coal-related sources from the South American urban sources (Fig. 5).
4. Conclusions
This study significantly expands the elemental (major, trace and
rare earth elements) and isotopic (Pb and Nd isotope) data that is
Fig. 5. Bivariate plots of elemental and isotopic compositions for the suggested natural (nat) and anthropogenic (anthro) aerosol sources of South America (SAM) and Southern Africa (SAf). Other abbreviations: v = volcanic, n-v = non-volcanic, u = urban, m-1 = mining group 1, m-2 = mining group 2, and c = coal sources. The symbols denote data from this study, whilst the stippled boxes outline the geochemical signature of a source, which was determined from our new data and literature results. All 2SD error bars are smaller than the size of the symbols.
available to characterise and discriminate between important South American and South African aerosol sources to the South Atlantic Ocean. This was achieved by analysing a wide range of natural and anthropogenic samples, including road dust from Buenos Aires, aerosols from São Paulo, soil dust from Patagonia, and volcanic deposits from the Andean volcanic belt as well as various lichen from urban and rural
areas of South Africa. A geochemical comparison of the fine fraction
(< 5μm) and bulk powder samples of selected mineral dust samples
from Patagonia and the Andes suggest a significant impact of particle
size on composition. The effect is however small when compared to
observed geochemical variations between the different aerosol sources of South America and Southern Africa.
Based on a detailed evaluation of our new aerosol source data and comprehensive compilation of relevant data from the literature, we propose a set of geochemical parameters that is able to distinguish between natural and anthropogenic aerosols that reach the South Atlantic Ocean from both, South America and Southern Africa. These
encompass discrimination plots of208Pb/207Pb vs.εNd,208Pb/207Pb vs.
Pb/Al, 1/[Pb], Zn/Al, Cd/Al, Cu/Al, and diagrams ofεNdvs. Pb/Al and
1/[Nd]. As such, our study has developed new and powerful tools for future studies that aim to trace and quantify the trace metal and nu-trient inputs from aerosols to the South Atlantic Ocean.
Acknowledgements
This study was supported by the NERC grant NE/H005390/1. We
would like to acknowledge the CLIM-Amazon project for theirfinancial
support of RK (GA no. 295091–project Inco-LAB FP7 supported by the
EC).
Appendix A. Supplementary data
Supplementary data associated with this article can be found, in the
online version, athttps://doi.org/10.1016/j.chemer.2018.05.001.
References
Alkmim, F.F., Marshak, S., Fonseca, M.A., 2001. Assembling west gondwana in the neoproterozoic: clues from the São francisco craton region, Brazil. Geology 29 (4), 319–322.http://dx.doi.org/10.1130/0091-7613(2001)029<0319:awgitn>2.0.co;2.
Almeida, F.F.M., Neves, B.B.D., Carneiro, C.D., 2000. The origin and evolution of the South American Platform. Earth Sci. Rev. 50 (1–2), 77–111.
Babinski, M., Aily, C., Ruiz, I.R., Sato, K., 2003. Pb isotopic signatures of the atmosphere of the São Paulo city, Brazil. J. De Physique IV 107 (1), 87–90.
Begg, G.C., Griffin, W.L., Natapov, L.M., O'Reilly, S.Y., Grand, S.P., O'Neill, C.J., Bowden, P., 2009. The lithospheric architecture of Africa: seismic tomography, mantle pet-rology, and tectonic evolution. Geosphere 5 (1), 23–50.http://dx.doi.org/10.1130/ ges00179.1.
Bertolo, R., Bourotte, C., Marcolan, L., Oliveira, S., Hirata, R., 2011. Anomalous content of chromium in a Cretaceous sandstone aquifer of the Bauru Basin, state of São Paulo Brazil. J. South Amer. Earth Sci. 31, 69–80.
Bollhöfer, A., Rosman, K.J.R., 2000. Isotopic source signatures for atmospheric lead: the Southern Hemisphere. Geochim. Cosmochim. Acta 64 (19), 3251–3262.http://dx. doi.org/10.1016/s0016-7037(00)00436-1.
Boyd, P.W., Watson, A.J., Law, C.S., Abraham, E.R., Trull, T., Murdoch, R., Zeldis, J., 2000. A mesoscale phytoplankton bloom in the polar Southern Ocean stimulated by iron fertilisation. Nature 407 (6805), 695–702.http://dx.doi.org/10.1038/ 35037500.
Brito Neves, B.B., Fuck, R.A., 2013. Neoproterozoic evolution of the basement of the South-American platform. J. South Am. Earth Sci. 47, 72–89.http://dx.doi.org/10. 1016/j.jsames.2013.04.005.
Campos, R.S., Philipp, R.P., Massonne, H.-J., Chemale Jr, F., 2012. Early post-collisional Brasiliano magmatism in Botuverá region, Santa Catarina, Southern Brazil: evidence from petrology, geochemistry, isotope geology and geochronology of the diabase and lamprophyre dikes. J. South Am. Earth Sci. 37, 266–278.
Chang, Q., Mishima, T., Yabuki, S., Takahashi, Y., Shimizu, H., 2000. Sr and Nd isotope ratios and REE abundances of moraines in the mountain areas surrounding the Taklimakan Desert, NW China. Geochem. J. 34 (6), 407–427.
Chin, M., 2009. Dust Emission, Transport and Effects on Air Quality: A Global Model Simulation and Comparison with Multi-platform Data. NASA Goddard Space Flight.
Condie, K., Hunter, D., 1976. Trace element geochemistry of Archean granitic rocks from the Barberton region, South Africa. Earth Planet. Sci. Lett. 29 (2), 389–400. Delmonte, B., Basile-Doelsch, I., Petit, J.R., Maggi, V., Revel-Rolland, M., Michard, A.,
Grousset, F., 2004. Comparing the Epica and Vostok dust records during the last
220,000 years: stratigraphical correlation and provenance in glacial periods. Earth Sci. Rev. 66 (1–2), 63–87.http://dx.doi.org/10.1016/j.earscirev.2003.10.004. Desboeufs, K.V., Losno, R., Colin, J.L., 2001. Factors influencing aerosol solubility during
cloud processes. Atmos. Environ. 35 (20), 3529–3537.http://dx.doi.org/10.1016/ s1352-2310(00)00472-6.
Dostal, J., Zentilli, M., Caelles, J.C., Clark, A.h., 1977. Geochemistry and origin of vol-canic rocks of the Andes (26–28S). Contrib. Miner. Petrol. 63, 113–128. Ducart, D.F., Crosta, A.P., Souza Filho, C.R., Coniclio, J., 2006. Alteration mineralogy at
the Cerro La Mina epithermal prospect, Patagonia Argentina:field mapping, short-wave infrared spectroscopy, and ASTER images. Econ. Geol. 101 (5), 981–996.
http://dx.doi.org/10.2113/gsecongeo.101.5.981.
Ebert, P., Baechmann, K., 1998. Solubility of lead in precipitation as a function of rain-drop size. Atmos. Environ. 32 (4), 767–771. http://dx.doi.org/10.1016/s1352-2310(97)00344-0.
Ewart, A., Marsh, J.S., Milner, S.C., Duncan, A.R., Kamber, B.S., Armstrong, R.A., 2004. Petrology and geochemistry of early cretaceous bimodal continentalflood volcanism of the NW Etendeka, Namibia. Part 1: Introduction, mafic lavas and re-evaluation of mantle source components. J. Petrol. 45 (1), 59–105.http://dx.doi.org/10.1093/ petrology/egg083.
Feng, J.-L., Zhu, L.-P., Zhen, X.-L., Hu, Z.-G., 2009. Grain size effect on Sr and Nd isotopic compositions in eolian dust: implications for tracing dust provenance and Nd model age. Geochem. J. 43, 123–131.
Feng, J.-L., Hu, Z.G., Cui, J.Y., Zhu, L.P., 2010. Distributions of lead isotopes with grain size in aeolian deposits. Terra Nova 22 (4), 257–263.http://dx.doi.org/10.1111/j. 1365-3121.2010.00941.x.
Ferrat, M., Weiss, D.J., Strekopytov, S., Dong, S., Chen, H., Najorka, J., Sinha, R., 2011. Improved provenance tracing of Asian dust sources using rare earth elements and selected trace elements for palaeomonsoon studies on the eastern Tibetan Plateau. Geochim. Cosmochim. Acta 75 (21), 6374–6399.http://dx.doi.org/10.1016/j.gca. 2011.08.025.
Frimmel, H.E., Jonasson, I.R., Mubita, P., 2004. An Eburnean base metal source for se-diment-hosted zinc-lead deposits in Neoproterozoic units of Namibia: lead isotopic and geochemical evidence. Miner. Deposita 39 (3), 328–343.http://dx.doi.org/10. 1007/s00126-004-0410-7.
Fujiwara, F., Rebagliati, R.J., Dawidowski, L., Gómez, D., Polla, G., Pereyra, V., Smichowski, P., 2011. Spatial and chemical patterns of size fractionated road dust collected in a megacitiy. Atmos. Environ. 45 (8), 1497–1505.http://dx.doi.org/10. 1016/j.atmosenv.2010.12.053.
GEOROC (2003–2011). Geochemistry of Rocks of the Oceans and Continents. Website (http://www.georoc.mpch-mainz.gwdg.de/georoc/).
Gaiero, D.M., Probst, J.L., Depetris, P.J., Bidart, S.M., Leleyter, L., 2003. Iron and other transition metals in Patagonian riverborne and windborne materials: geochemical control and transport to the southern South Atlantic Ocean. Geochim. Cosmochim. Acta 67 (19), 3603–3623.http://dx.doi.org/10.1016/s0016-7037(03)00211-4.
Gaiero, D.M., Depetris, P.J., Probst, J.-L., Bidart, S.M., Leleyter, L., 2004. The Signature of River- and Wind-Borne Material Exported from Patagonia to the Southern Latitudes: A View from REEs and Implications for Paleoclimatic Interpretations. GCA. Gaiero, D.M., Brunet, F., Probst, J.-L., Depetris, P.J., 2007. A uniform isotopic and
che-mical signature of dust exported from Patagonia: rock sources and occurrence in southern environments. Chem. Geol. 238 (1–2), 107–120.http://dx.doi.org/10. 1016/j.chemgeo.2006.11.003.
Gallet, S., Jahn, B.M., Torii, M., 1996. Geochemical characterisation of the Luochuan loess-paleosol sequence, China: and paleoclimatic implications. Chem. Geol. 133, 67–88.
Galloway, J.N., Dentener, F.J., Capone, D.G., Boyer, E.W., Howarth, R.W., Seitzinger, S.P., Vorosmarty, C.J., 2004. Nitrogen cycles: past, present, and future. Biogeochemistry 70 (2), 153–226.http://dx.doi.org/10.1007/s10533-004-0370-0. Gasso, S., Stein, A.F., 2007. Does dust from Patagonia reach the sub-Antarctic Atlantic
ocean? Geophys. Res. Lett. 34 (1).http://dx.doi.org/10.1029/2006gl027693. Gioia, S.M.C.L., Babinski, M., Weiss, D.J., Kerr, A.A.F.S., 2010. Insights into the dynamics
and sources of atmospheric lead and particulate matter in São Paulo Brazil, from high temporal resolution sampling. Atmos. Res. 98 (2–4), 478–485.http://dx.doi.org/10. 1016/j.atmosres.2010.08.016.
Gioia, S.M.C.L., Babinski, M., Weiss, D.J., Spiro, B., Kerr, A., Veríssimo, T.G., Ruiz, I.R., Prates, J.C.M., 2017. An isotopic study of atmospheric lead in a megacity after phasing out of leaded gasoline. Atmos. Environ. 149, 70–83.
Grunder, A.L., 1987. Low delta-O-18 silicic volcanic-rocks at the calabozos caldera complex, Southern Andes− Evidence for Upper-Crustal contamination. Contrib. Miner. Petrol. 95 (1), 71–81.http://dx.doi.org/10.1007/bf00518031.
Honda, M., Yabuki, S., Shimizu, H., 2004. Geochemical and isotopic studies of aeolian sediments in China. Sedimentology 51 (2), 211–230.http://dx.doi.org/10.1046/j. 1365-3091.2003.00618.x.
Hsu, S.-C., Wong, G.T.F., Gong, G.-C., Shiah, F.-K., Huang, Y.-T., Kao, S.-J., Tseng, C.-M., 2010. Sources, solubility, and dry deposition of aerosol trace elements over the East China Sea. Mar. Chem. 120 (1–4), 116–127.http://dx.doi.org/10.1016/j.marchem. 2008.10.003.
Jacobsen, S.B., Wasserburg, G.J., 1980. Sm-Nd isotopic evolution of chondrites. Earth Planet. Sci. Lett. 50 (1), 139–155.http://dx.doi.org/10.1016/0012-821x(80) 90125-9.
Jakes, P., White, A.J.R., 1972. Hornblendes from calc-alkaline volcanic-rocks of island arcs and continental margins. Am. Mineral. 57 (5–6), 887.
Janney, P.E., Le Roex, A.P., Carlson, R.W., Viljoen, K.S., 2002. A chemical and multi-isotope study of the Western Cape olivine melilitite province, South Africa: im-plications for the sources of kimberlites and the origin of the HIMU signature in Africa. J. Petrol. 43 (12), 2339–2370.http://dx.doi.org/10.1093/petrology/43.12. 2339.
![Fig. 2. Selected trace element/Al ratios, and 1/[Pb], 1/[Nd] data for samples from this study ( fi lled symbols) and the literature (open symbols)](https://thumb-eu.123doks.com/thumbv2/123doknet/14778666.595160/7.892.117.774.82.512/selected-trace-element-ratios-samples-symbols-literature-symbols.webp)