DIFFERENTIAL STRAIN ANALYSIS: APPLICATION TO SHOCK INDUCED MICROFRACTURES
by
ROBERT WAYNE SIEGFRIED, II
B.S., California Institute of Technology (1972)
SUBMITTED IN PARTIAL FULFILLMENT OF THE REQUIREMENTS FOR THE
DEGREE OF
DOCTOR OF PHILOSOPHY ~at the
MASSACHUSETTS INSTITUTE OF TECHNOLOGY (February, 1977)
Signature of Author ....- ~ ~ ~ ~ . . . . Department 4V-EartY and' Planetary*Sciences
/2
December 28, 1976 Certified byThesis Supervisor
Chairman, Departmental Committee oh Graduate Students
DIFFERENTIAL STRAIN ANALYSIS: APPLICATION TO SHOCK INDUCED MICROFRACTURES
by
ROBERT WAYNE SIEGFRIED, II
Submitted to the Department of Earth and Planetary Sciences on December 28, 1976 in partial fulfillment of the requirements
for the Degree of Doctor of Philosophy
ABSTRACT
Microcracks control the behavior of many physical pro-perties of rocks at pressures below a few kilobars, corre-sponding to depths of about 10 km on the earth and up to 50 km on the moon. The differential strain analysis (DSA) technique was developed to characterize microcracks with respect to
closure pressure and orientation. The DSA technique allows detailed study of the crack distributions produced by various processes, and the effect of these cracks on elastic
properties.
The crack distributions in two suites of rock samples that had been subjected to known conditions of shock loading were characterized with DSA. The qualitative effect of parameters such as mineralogy, grain size, initial crack
distribution, shock pressure, and shock duration on the shock-induced crack distribution in a rock sample was determined.
Comparison of the crack distributions in six returned lunar samples with those of the experimentally shocked samples indicates that the crack distribution in situ in the lunar crust is likely to be different than that in the returned samples. Thus, measurements of the elastic properties of returned lunar samples as a function of pressure should not be used directly to estimate the variation of elastic pro-perties with depth in the moon.
Name and Title of Thesis Supervisor: Gene Simmons,
TABLE OF CONTENTS
Page
Abstract 2
Table of Contents 3
Chapter 1: Introduction 4
Chapter 2: Characterization of Oriented Cracks
with Differential Strain Analysis 11 Chapter 3: Shock-Induced Microfractures in Six
Terrestrial Igneous Rocks Characterized with
Differential Strain Analysis 50
Chapter 4: Microfractures Produced by a Laboratory
Scale Hypervelocity Impact into Granite 102 Chapter 5: Are the Microcracks in Lunar Samples
Representative of Those In Situ in the
Lunar Crust? 138
Acknowledgements 155
4
Chapter 1
One primary aim of the study of physical properties of rocks, especially as a function of pressure and temperature, is to interpret measurements made in situ of such parameters as velocity of elastic waves, temperature, and electrical con-ductivity in terms of rock type and physical state. In order to apply meaningfully laboratory measurements to the inter-pretation of field data, the oarameters that control particular physical properties must be discovered and characterized both in the lab and in the field.
The physical properties of rocks are controlled both by the properties of their constituent minerals and the textural manner in which these minerals are assembled to form a rock. Voids in the form of pores and cracks exert a particularly large in-fluence on elastic properties (e.g. elastic wave velocities, compressibility) since the elastic properties of common rock forming minerals differ little from each other as compared to the contrast in properties between these minerals and an air or liquid filled void. Adams and Williamson (1923) were first to attribute the strong pressure dependence of elastic veloci-ties to the presence of cracks, and several subsequent authors have reaffirmed the importance of cracks in controlling the physical properties of rocks at low pressures (e.g. Thill et al., 1969; Brace, 1965; Simmons, 1964a and b; Birch, 1960 and 1961).
analysis (DSA) for characterizing the cracks in rocks in terms of porosity, closure pressure, and orientation. The technique is described in Simmons et al. (1974) and more fully in Chapter 2 of this thesis.
Simmons et al. (1975) use the DSA technique to show that the crack distributions in the returned lunar samples differ substantially from the distributions in typical terrestrial igneous rocks, including some shocked samples. Possible causes for this difference include multiple shocking on the lunar
surface, differences in the duration and intensity of lunar and terrestrial shock processes, differences in the pre-shock crack distributions of lunar and terrestrial rocks, and the presence in the returned lunar samples of cracks formed when the sample was excavated by a shock event. If the latter effect is
important, the crack distributions in the returned samples could differ significantly from the crack distribution in situ on the moon. Thus, the procedure of directly applying
labora-tory physical property measurements to the interpretation of lunar seismic data, as practiced by Toksoz et al. (1973), Trice et al. (1974), Simmons et al. (1973) and others might be inappropriate.
In order to help assess the importance of the various crack producing processes operating on the moon, we have
attempted to determine the relation between shock induced micro-crack distributions and such factors as pre-shock porosity,
grain size, shock pressure, shock duration, and mineralogy. A qualitative knowledge of the way in which these parameters
affect shock-induced microfractures will allow us to make a meaningful interpretation of the crack distributions in lunar samples.
Shock effects in rocks, including shock induced micro-cracks, have been used for the recognition and study of terres-trial impact craters, as well as the study of the effects of underground nuclear explosions (Dence et al., 1968; Short,
1966, 1968; Borg, 1973). The correct interpretation of micro-fractures produced in such field situations requires knowledge of the parameters controlling shock induced microcrack distri-butions that can only be gained through experiments with con-trolled shock conditions and well characterized samples.
We have used the DSA technique to characterize the micro-fracture distributions in two sets of samples shocked under controlled conditions. In Chapter 3 we describe the micro-cracks produced in a set of samples having a range of initial crack porosity, mineralogy, and grain size that were subjected to similar shock conditions with an explosive driver plate apparatus. These experiments were performed to allow us to assess qualitatively the effect of various preshock sample parameters on shock induced crack distributions.
The samples studied in Chapter 4 are taken from a granite block shocked in a laboratory scale hypervelocity impact exper-iment. The rock samples are taken at various distances from the impact point so that the effect of shock pressures in the range from two to twenty kilobars on samples having identical initial characteristics can be determined.
8
Chapters 2 through 5 of this thesis have been prepared as individual manuscripts. Citations among the various chapters are therefore in manuscript form, including appropriate co-authors. All citations dated 1977 refer to various chapters of this thesis, as indicated below:
Siegfried and Simmons, 1977 Chapter 2
Siegfried, McQueen, and Simmons, 1977 Chapter 3 Siegfried, Horz, and Simmons, 1977 Chapter 4
REFERENCES
Adams, L.H. and E.D. Williamson, On the compressibility of minerals and rocks at high pressures, Franklin Inst. J.,
195, 475-529, 1923.
Birch, F., The velocity of compressional waves in rocks to 10 kilobars, part 1, J. Geophys. Res., 65, 1083-1102, 1960.
Birch, F., The velocity of compressional waves in rocks to 10 kilobars, part 2, J. Geophys. Res., 66, 2199-2224, 1961.
Borg, I.Y., Extent of pervasive fracturing around underground nuclear explosions, Int. J. Rock Mech. Min. Sci., 10, 11-18, 1973.
Brace, W.F., Some new measurements of linear compressibility of rocks, J. Geophys. Res., 70, 391-398, 1965.
Dence, M.R., M.J.S. Innes and P.B. Robertson, Recent geological and geophysical studies of Canadian craters, in Shock
Metamorphism of Natural Materials, edited by B.M. French and N.M. Short, 339-362, Mono, Baltimore, Md., 1968. Short, N.M., Effects of shock pressures from a nuclear
explo-sion on mechanical and optical properties of granodiorite, J. Geophys. Res., 71, 1195-1215, 1966.
Short, N.M., Nuclear-explosion-induced mocrodeformation of rocks: An aid to the recognition of meteorite impact structures, in Shock Metamorphism of Natural Materials,
edited by B.M. French and N.M. Short, 185-210, Mono, Baltimore, Md.,1968.
Simmons, G., Velocity of compressional waves in various min-erals at pressures to 10 kilobars, J. Geophys. Res., 69, 1117-1121, 1964a.
Simmons, G., Velocity of shear waves in rocks to 10 kilobars, 1, J. Geophys. Res., 69, 1123-1130, 1964b.
Simmons, G., T. Todd, and H. Wang, The 25-km discontinuity: implications for lunar history, Science, 182, 158-161, 1973.
Simmons, G., R. Siegfried, and D. Richter, Characteristics of microcracks in lunar samples, Proc. Sixth Lunar Sci. Conf., 3, 3227-3254, 1975.
Simmons, G., R. Siegfried, and M. Feves, Differential strain analysis: a new method for examining cracks in rocks, J. Geophys. Res., 79, 4383-4385, 1974.
Thill, R.E., R.J. Willard, and T.R. Bur, Correlation of longi-tudinal velocity variation with rock fabric, J. Geophys.
Res., 74, 4897-4909, 1969.
Toks8z, M.N., A.M. Dainty, S.C. Solomon, and K.R. Anderson, Velocity structure and evolution of the moon, Proc. Fourth
Lunar Sci. Conf., Geochim. Cosmochim. Acta, suppl. 4, vol. 3, 2529-2547, 1973.
Trice, R., N. Warren, and O.L. Anderson, Rock elastic properties and near-surface structure at Taurus-Littrow, Proc. Fifth Lunar Sci. Conf., Geochim. Cosmochim. Acta, suppl. 5, vol. 3, 2903-2911, 1974.
Chapter 2
Characterization of Oriented Cracks with Differential Strain Analysis
INTRODUCTION
The precise characterization of microcracks in rocks is important in geology and geophysics for several reasons. Many workers have shown previously that microcracks dominate the
be-haviour of the physical properties of rocks at pressures below several kilobars (Adams and Williamson, 1923; Thill et al., 1969; Brace, 1965; Simmons, 1964a and b; Birch, 1960 and 1961; for example). Knowledge of the nature of the crack population with depth in situ is essential in correctly interpreting field measurements of such physical properties as seismic velocity and electrical conductivity. In addition, microcracks in a rock can be used to study its past history (Simmons and Richter,
1976; Richter et al., 1976; Batzle and Simmons, 1976).
The new technique,differential strain analysis (DSA) (Simmons, et al., 1974),,was developed to characterize the distribution of crack porosity with crack closure pressure in a rock sample. We have used it on about 75 samples and have extended it to ob-tain information about crack orientation as a function of closure pressure. In this paper, we describe its present state.
In differential strain analysis, linear strain under hydro-static loading is measured in several directions with very high precision. The surfaces of a sample are handlapped and BLH SR-4
foil electric resistance strain gauges are mounted directly on the sample surface with Tra-Con 2101 epoxy. The sample is vacuum dried at 400C and 10- 2torr and then vented with dry nitrogen and
encapsulated in Dow-Corning sylgard 186 to exclude the pressure medium (hydraulic oil). A fused silica sample is prepared similar-ly to the rock sample and exposed to the same pressure conditions. The strain in the fused silica sample is then subtracted (during data processing) from the strain in the rock sample in order to
eliminate errors due to instrument drift, variations in lead
resistance, etc. If the actual strain curve of the rock is desired, it can be calculated from the differential strain curve using
measurements of the compressibility of fused silica vs. pressure (Peselnick et al., 1967).
Walsh (1965) derived expressions relating volumetric crack porosity and crack aspect ratio to compressibility. Morlier
(1971) used Walsh's results to show that the distribution function for crack porosity vs. aspect ratio could be obtained from the strain vs. pressure curve. Both Walsh and Morlier used ellip-tical and penny-shaped models for cracks. Because we have not observed any elliptical or penny-shaped cracks in the thirty rocks that we have examined with scanning electron microscopes, we pre-fer to describe our results using parameters which are independent of a specific model for crack shape. Instead of aspect ratio, we use closure pressure, defined as the pressure at which a
crack closes completely. For elliptical and penny-shaped models, closure pressure (Pc) is related to aspect ratio (a) by the
relation:
where E is the matrix Young's modulus and n is a dimensionless constant on the order of 1, which depends on whether a plane
stress, plane strain, or penny-shaped model is used (Walsh, 1965). The basic quantity obtained from DSA data is the zero pres-sure strain tensor in a sample due to the presence of cracks that close at a given pressure. The trace of this tensor is the volu-metric strain (or crack porosity) due to cracks that close at the particular pressure. The volumetric strain can be determined with only three orthogonal gauges on a sample. One gauge on a
sample allows determination of the zero pressure linear strain in the direction of the gauge due to cracks closing at a given pressure.
THEORETICAL BASIS OF DSA
Walsh (1965) calculated volumetric compressibility for a rock containing elliptical or penny-shaped cracks. We have ex-tended his method to the calculation of the compressibility tensor, replacing the penny-shaped or elliptical crack models with the more general assumption of linear crack closure. Linear
crack closure means that strain is linear over any pressure range in which no cracks close completely. This assumption is veri-fied experimentally (at least for low-porosity igneous rocks)
by the observation that the strain curves of some rocks are linear over pressure ranges of several hundred bars. The other assump-tions include a homogeneous distribution of non-interacting
cracks in a homogeneous, isotropic matrix. We use this approach rather than those approaches which include crack interactions
(e.g., the self-consistent approach of O'Connell and Budiansky, (1974)) due to the simplicity involved in inverting the strain data to obtain crack parameters. We believe that this approach is satisfactory in igneous rocks where crack porosities are at
most a few percent.
Definition of terms:
c.. = strain tensor of cracked solid
1J
= differential strain tensor
1J
eT. = average matrix strain of solid 1J
rj.. = strain due to the presence of cracks
1J
c. (P ) = zero pressure strain due to the presence of
1) c cracks closing completely at P < Pc
v. . (P )dP = zero pressure strain due to the presence of
1) C c cracks closing between Pc and Pc
+ dPc (V.. = dC ./dP )
8.j = compressibility tensor of cracked solid
am = volumetric compressibility of matrix material
v
If a pressure increment 6P is applied to a solid, the incre-mental strain due to the presence of cracks is the difference between the observed strain and the average matrix strain:
6n. = 6 - 6rE . (1)
Betti's reciprocal theorem (Love, 1927) allows us to calculate the average matrix strain of a porous solid under hydrostatic pressure P. Consider a volume (V) of solid containing one pore under two states of stress (figure 1). In the first state (un-primed) the solid is under hydrostatic pressure 6P at the
outer boundary and zero pressure at the pore boundary. The resulting strain field is 6c.j. In the second stress state
(primed) surface tractions are applied so that the single stress component 6o' is uniform throighout the solid and all other stress components vanish. The subscripts I and J correspond to the aver-age matrix strain component 6c which is to be calculated. The resultant strain is 6c!. The reciprocal theorem states that the strain energy of a given stress field acting through the displace-ment produced by a second stress field is equal to the strain
energy of the second stress field acting through the displacement produced by the first stress field; or in this case:
fff6e d6a !dV =
ff6an6E'dS
(2)matrix S
17
P=u P 1
S
P=0 0'
OEj
Figure 1. Stress states for calculation of average matrix
where the volume integral is over the matrix volume and the sur-face integral is over the outer sursur-face S. 6an and 6e' are the normal stresses and strains on S. Since the stress in the unprimed case is hydrostatic,
ffda
6W'dS = -6PAV' (3)S n n
where AV' is the volume change due to the displacement at the outer boundary of the solid under uniform stress 6a' . From simple elasticity theory,
AV' = V6aG (S1 1 1 + S22IJ + S33IJ) (4)
where S.iii are components of the elastic compliance tensor. If the matrix is isotropic, (3) and (4) yield:
ff6an6edS = -6PV6a - 6
nJ v 13(5)
where 6 is the Kronecker delta. Since 6a 1 is constant
through-out the matrix volume, we can combine (2) and (5) to yield:
6af dedV = -6PV6cJ 1 (6) matrix or dfff6E dV = -6P!S 6 7) matrix m ,The left hand side of (7) is just the average matrix strain 6c . so
mef. = -6Plm.. (8)
iJ 3 v 1( From (1),
de../dP = de. /dP + dal /dP (9)
1) 1) ij
or
.. = ~m6 .. - dr. ./dP (10)
since
B.. = -de. ./dP (11)
If a component of strain due to the cracks that close at some pressure Pc increases linearly from P = 0 to P = Pc (linear crack closure), we can express n. (P) in terms of the distribution
IJ
function vj (Pc)dPc:
n (P) = f(1-- )v (P )dP (12)
This expression merely sums up the contributions due to all cracks that remain partially open at pressure P. We can dif-ferentiate (12) with respect to P to obtain:
d. ./dP = -v. (P) - fm Vi(Pc )dPc + P- v (P) (13)
=
-p
-
v
(P
)dP
(14)
C i c c From (10) 5 =6 6.. + f-v (P )dP (15) ij 3 vij Cp Vij c c(5 Differentiating (15) again: dS. ./dP = (P) (16) v. .(P) = -P(d6. ./dP) (17) or, in terms of strain:v. . (P) = P(d 2E. ./dP 2 (18) From the definition of C. .(P), we have
(P) = fPv. (P )dP (19)
= fP (d 2. ./dP 2)dP (20) o c iJ c c
Integration by parts yields:
1..(P) = P(de../dP) - fp(de. ./dP )dP (21)
= P(de. ./dP) - E..(P) (22)
iJ JJ
Cr..
has a simple geometric interpretation as the zero pressure 1)intercept of the tangent to the strain curve (c vs. P) at pressure P, as shown in figure 2.
If all cracks in a sample are closed above some pressure Pmax'
then from the definitiorns of C and q,
Cij (P ma ) = i (0) (23)
If strain data are available to Pmax' r1. (P) can be calculated.
Equation (9) is integrated to yield:
E. (P) - C. (0) = EM.(P) - m (0) + T..(P) - T..(0) (24)
i) iJ iJ iJ iJ 13
m
From (23), and since e. (0) = .. (0) = 0,
13 13
m
rj. (P) = E. (P) + C. (P ) - (P) (25)
1 1 i max 13
For an elastic matrix,
de.. C. (P) = P (26)
13LdP
m max thus, de.. T1. (P) = C. .(P) + C. (P - P 1 (27) 13 13 ij max) dP m max dc..The term - d is the 'intrinsic compressibility' of the sample dP
(m ).max
The graphical interpretation of this expression is shown in figure 3. n. . (P) is merely the difference at pressure P between the strain curve and the tangent to the curve at Pmax'
Our actual data consist of differential strain, the dif-ference between the strain in a sample and that of a fused silica reference exposed to the same pressure. If we assume that the
com-Figure 2. Interpretation of DSA data. 2a is the differential strain ( (P), sample strain minus strain in the fused silica reference sample) vs. pressure (P). Linear strain is given in three directions, denoted by the numbers next to the curves. The dashed line tangent to the curve (3) at .35kb is the strain curve that would have been obtained if all of the cracks that have closed by .35kb were not present in the sample. Thus, C(.35kb) is the zero pressure strain due to cracks closing at P < 0.35kb (or, in the volumetric
case, the crack porosity due to cracks closing at P < 0.35kb). 2b is the curve of C
vs. closure pressure (PC) derived from 2a. 2c is the distribution function for Pc, which we term crack spectrum. The close spacing of data points below 100
bars results in uncertainties in the strain data causing large fluctuations in dc/dPc. In order to
ascertain whether peaks below 100 bars are real, it is necessary to refer to the actual strain data (fig-ure 2a). In this case, although the strain appears linear to 50 bars, we calculate dc/dPc < 0 for
Pc < 50 bars. This negative spike is spurious and is an artifact of the curve fitting technique that appears when the data are very closely spaced. The sample is a shocked granodiorite from the site of the Piledriver nuclear test. (After Simmons et al., 1975.)
P (kb) Piledriver 216 X 0 T. x x 0. J.) 10 Pc(kb) Pc (kb) Piledriver 216
Pressure
z
H-Figure 3. Determination of crack porosity vs. P. The strain due to cracks (n) at any pressure is the difference between the actual strain curve and that for a crack-free solid at that pressure.
pressibility of fused silica is linear for pressures below 2 kbar, we have
2. = E.. + 6( -SFSP 28)
where 2.. is the differential strain tensor, and aFS is the fused silica compressibility. If we write C..(P) in terms of ^.., we
IJ 1J
have (from equation (22))
C..(P) iJ = p dP -( ij . - 6iJ . FSP) - iJ . + 6iJ. FSP (29) do..
dP
which is in the same form as (22) with E.. substituted for e...
1J 1J
Therefore, the calculations of C.. and v.. can be done directly from the differential strain measurements, if the fused silica strain is linear with pressure. In our previous work (Simmons et al., 1974; Simmons et al., 1975), we assumed linearity; how-ever, in the present work, we have corrected for the fused silica compressibility pressure dependence using the data of Peselnick et al. (1967). Their measurements show that the linear compres-sibility of fused silica varies from .913 x 10-6 bar~ at P = 0
to .945 x 10-6 bar~- at 2 kbar. The actual sample strain is cal-culated by adding to the differential strain the fused silica
strain calculated from Peselnick's data. Then, in order to expand the strain scale on plots, and to facilitate comparison with pre-vious differential strain data, a linear strain curve with a slope equal to the zero pressure fused silica compressibility determined by Peselnick et al. is subtracted from the actual strain curve. Thus, the differential strains plotted in this paper can be
con-verted to true strain with the formula:
= .. - aP6.. (31)
where B = .913 x 106 bar
We can calculate as a function of pressure the principal axes and values of 2.., C , v.j and q... Plots of the orienta-tion of the principal axes of v.., and the corresponding principal values, are most valuable, as they allow one to estimate the
orientations of cracks with different closure pressures. Two examples of such a calculation are given in the RESULTS section of this paper. Volumetric parameters are merely scalar invariants
of the corresponding tensors, for example
INTERPRETATION OF DSA DATA
At the present stage of development of the DSA technique, we are able to obtain the following parameters from a complete set of data:
1. The complete linear compressibility tensor as a function of pressure.
2. The total crack porosity as a function of pressure.
3. The crack porosity due to each individual set of cracks, as a function of pressure.
4. The distribution of crack closure pressures.
5. Orientation information for cracks of different closure pressures.
6. Contribution of each set of cracks to C,
cv'
' v as a function of pressure.Even partial sets of DSA are useful, however. Strains measured in three orthogonal directions yield the following:
1. The total crack porosity as a function of pressure. 2. The crack porosity due to individual sets of cracks
as a function of pressure.
3. The volumetric distribution of crack closure pressures. 4. The presence or absence of strongly oriented cracks. Strain measured in a single direction yields values of crack closure pressures, even though the strain due to these cracks is known in only one direction.
inter-preted for a set of three orthogonal strain measurements.
The sample is a shocked granodiorite from the Piledriver site. If 9, C, and v were tensor components or volumetric quantities, the method of interpretation would be identical. Figure 2a shows the way in which C is determined from 9 vs. P. (see
equation (22)). Figure 2b is a plot of C vs. Pc, and figure 2c is a plot of v = dC/dP vs. Pc'
The calculation of v(P) requires two differentiations of the 9 vs. P. data. C(P) is calculated from ds/dP, and then dif-ferentiated to yield v(P). Our present method for calculating derivatives involves fitting a quadratic through each point and the n adjacent points on each side of it. (We use n = 2 when the data spacing is >50 bars; n = 3 when the spacing is 50 bars or less.) The derivative of the quadratic at the particular pressure is then taken as the derivative of the function. The derivative at the n lowest pressure points is taken from the quadratic used to fit the (n+l)th point. Due to the large variations in C(P) caused by small changes in (dc/dP), the
derivatives at the n highest pressure points are calculated from a straight line fit through the last (2n - 1) points. Compara-tively large scatter in C(P) and v(P) still results near the ends of the data set.
In order to illustrate the resolution of the DSA technique and our data analysis methods, synthetic data were generated
of .05% closing at one kbar. Random strain errors in the range + 5 x 10⁻⁶ (an upper limit for the scatter that we observe in 2) were superimposed upon these exact 'data'. Figure 4 shows the
results of analysis of both the exact and randomized data. The delta-function crack distribution is smoothed into a peak with a width of 300 bars at half-maximum amplitude. The scatter
in the data is not enough to impair resolution in this case! how-ever, end effects are very apparent at the high closure pressures.
If the strain tensor is being calculated, the strain measurements in six or more directions at each pressure are
inverted using a least-squares matrix inversion technique (Mendenhall, 1968; Nye, 1957) to yield the six independent components of the differential strain tensor, E . Each com-ponent of . and v is then calculated as shown in Figure 2. The principal values and axes of , C , and v i are then
calculated at each pressure using the iterative method described by Nye (1957).
29 9 0.3 0 2 P(k bar) 2 P, (kbar) Z'o 1.0X P (kbar)
Figure 4. DSA analysis of synthetic data. Figure 4a shows e(P) for synthetic strain data generated to represent
a population of .05% crack porosity closing at one kilobar. The circles represent the exact data, and the triangles represent data with random variations in the range ± 5 x 10⁻⁶ superimposed. Figures 4b and c show C(P c) and v(P ) for both sets of synthetic data.
SOURCES OF ERROR IN DSA
The sources of error in the DSA technique can be divided into two categories - errors in the measurement of the strain tensor, and systematic errors resulting from inapplicability of the models used to interpret the results. Errors due to
temperature fluctuations, random instrumental variations, and inaccuracy of pressure measurement fall into the first category. These errors are minimized by the differential technique using a fused silica reference sample. From the degree of scatter observed in the data, we estimate that we achieve a precision as high as 2 x 10⁻⁶ in strain.
The most significant potential source of systematic error for a DSA measurement in a single direction is non-linear crack behaviour. Our work up to this time has primarily been done on
low porosity igneous rocks, where we have often observed portions of strain curves that are linear over ranges of several hundred bars. Thus, we conclude that non-linear effects are of minor importance in the very flat cracks in igneous rock that close at the relatively low pressures of 2 kbar or less.
Sources of error in the determination of the strain tensor are individual variations in gauges, sample inhomogeneity,
anisotropy in the rock matrix, and errors in the measurement of the orientations of strain gauges. Elastic anisotropy of the rock matrix is indistinguishable from an anisotropic distribution of cracks closing above the maximum pressure at which strain
31
data were obtained. DSA parameters are thus unaffected by matrix anisotropy. By using data from more than six gauges,
the effect of the remaining sources of error above can be estimated. Following the method described by Mendenhall (1968, chapter 7),
the probable error in each of the components of is calculated from measurements on up to twelve strain gauges.
RESULTS
Various parameters obtained from the DSA data for Westerly (RI) granite and Twin Sisters (WA) dunite are recorded in Table 1. Linear parameters are given in the three directions (x 1, x2 ' x3 used as the reference axes in subsequent tensor calculations. Westerly granite (MIT 1134) is a quartz monzonite similar to USGS sample G-2 described by Chayes (1967). Twin Sisters dunite is a massive, coarse grained (1 to 5 mm) dunite with some shear features.
Figure 5 displays the results of strain tensor calculations on a sample of Westerly granite. Figure 5a is a plot of each component of the differential strain tensor ( as a function of pressure, relative to the axes (x1, x2,' x3), shown in figure
5c. Note that the off-diagonal components of the differential strain tensor are equal to those of the actual strain tensor. The error bars in figure 5a represent the probable error in the
tensor components estimated from the nine strain gauges used to calculate the six independent components. Figure 5b is a plot of the three principal values of 2 as a function of hydrostatic pressure. In figure 5c, the orientations of the principal axes are plotted on an equal area projection. Un-fortunately, we have not developed an effective system for dis-playing the pressure to which each point corresponds on such a plot. The points bunched together on figure 5c near the x1 , x2' and x3 axes correspond to pressures below 500 bars. At higher
Table 1. DSA Parameters Westerly granite Twin Sisters dunite ii (2kb) x 106 [±25] 11 22 33 275 215 165 0 0 370 6 (2kb) (Mb ) [±.010] 11 22 33 .667 .717 .699 .352 .357 .393
Figure 5. Differential strain of Westerly granite vs. P. Figure 5a shows the components of the differential strain tensor,
e
(P). Error bars are shown only for 2 . The errors in the other five components are similar. Figures 5b and c show the principal valuesand principal axes of . (P). (In this and subsequent projections, points are plotted on the lower hemisphere, and x3 is out of the paper.)
35 P(kbor) A 0 0 aA 9Oe a A O -O28 008 11 2 P(k bar) 0.3
0.2
0 - r-,OGpressures, the orientations of the greatest and intermediate principal strains rotate roughly counterclockwise around x3' while the axis of least principal strain moves toward x1 with
increasing pressure. The interpretation of the variations
in orientation of the principal strain axes is fairly straight-forward. At pressures below 500 bars, most of the strain is due to crack closure, and the principal strain axes reflect
the principal axes of the crack distribution which are apparently fairly constant. Above 500 bars, where the strain curves
are more linear, the strain is due mainly to mineral deformation or deformation of pores closing at pressures higher than 2 kbar, and the principal strain axes begin to reflect this high pressure anisotropy.
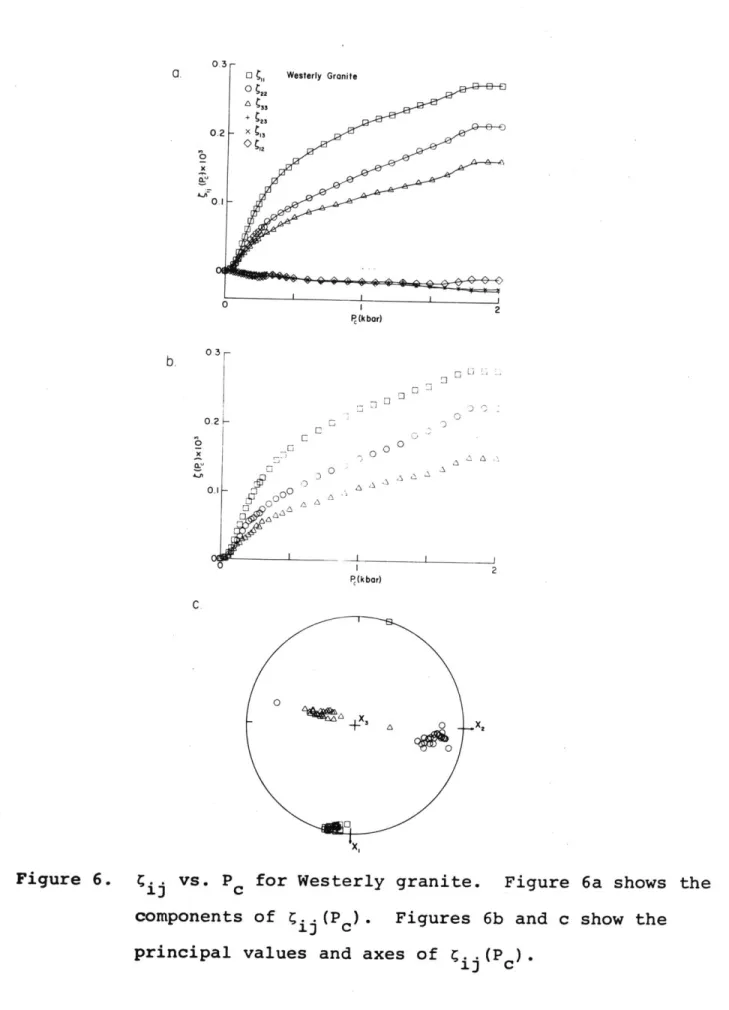
Figures 6a, b, and c show the tensor
C;
(P ) (the zero pressure strain tensor due to cracks closing at P < P ) in the same way in which figures 5a, b, and c illustrate . (P). The principal axes of C. (P ) are fairly constant in orientation for13 c
all P less than 2 kbar, as expected since
C.
(P) reflects thec 1
strain due to cracks closing at P < 2 kbar, independent of
mineral strains or strains due to cracks that close above 2 kbar. There is no evidence of variation of crack orientation with
closure pressure in
c..(P
) of the Westerly granite.13 c
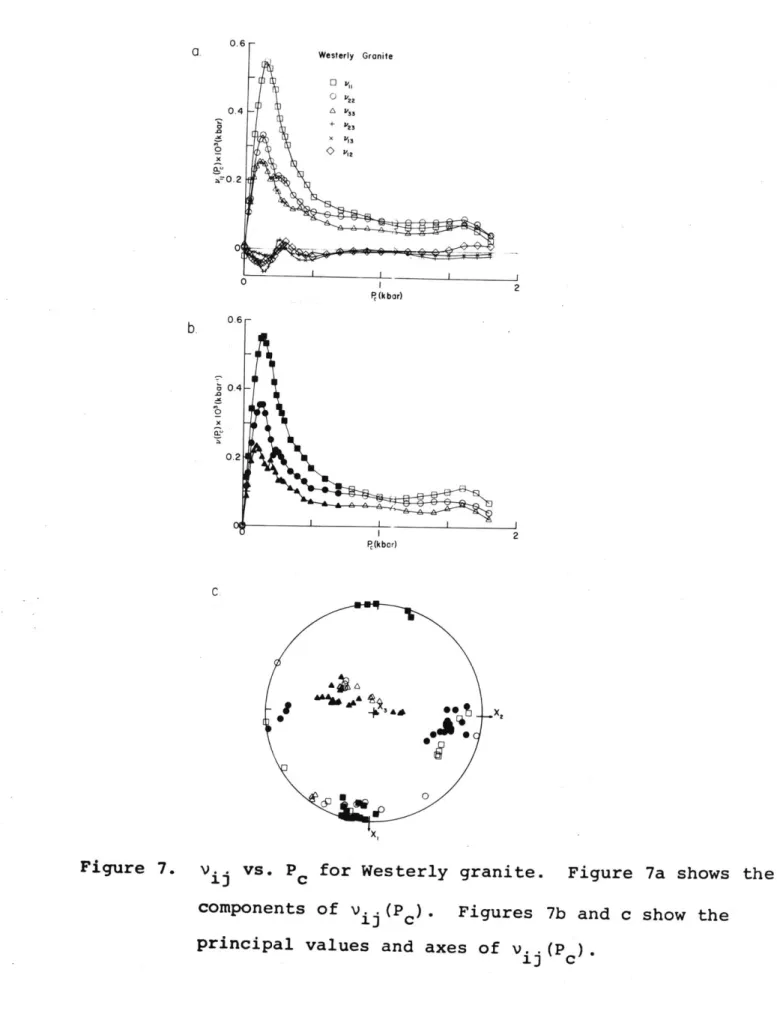
Figures 7a, b, and c illustrate the tensor v. (P ) obtained
13 c
by differentiating C. .(P ). As v. .(P )dP is the zero pressure
1s c c c
strain tensor due to cracks that close between P and P + dP ,
0.2 0.1 P(kbar) 0 00 C D 0 2 P(k bar)
Figure 6. C.. vs. P for Westerly granite. Figure 6a shows the components of 4 (Pc). Figures 6b and c show the principal values and axes of C (P *
Westerly Granite El &,,, O 22 X 33 + 112 3 X 11 2 P (kbar) P(kbar)
Figure 7. v.. vs. P for Westerly granite. Figure 7a shows the
1)
components of vj (Pc). Figures 7b and c show the principal values and axes of v..(P ).
13 c
0
examination of v. (P ) affords the best opportunity to characterize the orientations of cracks closing at various pressures. The
principal axis orientations shown in figure 7c have somewhat more scatter than those shown in figures 5c and 6c, due to the scatter in v induced by the two differentiations of ij
which are necessary to calculate v. In addition, the principal values of v..(P ) are very nearly equal for values of P greater
i] c c
than 800 bars, causing the orientations of the principal axes to be poorly constrained. The principal axes of vi (Pc) for
P < 700 bars are fairly well defined, as shown by the solid points on figures 7b and 7c. The principal axes of v show no correlation with pressure for Pc< 700 bars, indicating that the cracks that contribute most to the crack porosity of this sample have similar orientation distributions, despite their variation in closure pressures, which range from near zero to about 800 bars. A more isotropically oriented set of cracks closing at pressures up to 2 kbar appears to be present, as v. (P ) remains distinctly positive over the entire pressure
1J c
range. An indication of the importance of cracks closing
at pressures higher than the maximum (in this case, 2 kbar) can be obtained by comparing the linear compressibilities observed on the sample at high pressures with those calculated for a crack-free aggregate of the same composition. The mineral composition of our sample of Westerly granite (MIT 1134) is given in table 2. Feves and Simmons (1976) compare the
Table 2.
Modes of Westerly Granite and Component Bulk Moduli
Mineral MIT 1134 K(Mbar)
Quartz 22.5 .381 K-feldspar 30.7 .542 Plagioclase (An 17) 39.2 .595 Biotite 5.0 .487 Muscovite 0.7 .506 Opaques 0.7 1.62 Secondary 0.4 Others 0.8 Total 100.0 Number of points 1000 Density 2.644 g/cc
composition of MIT 1134 to other samples of Westerly granite. The Voigt and Reuss bounds (Hill, 1952) on the bulk modulus (K) were calculated for an isotropic aggregate having the composition and component moduli listed in table 2, with the result that
.510 < K < .531. The linear compressibility (SL) in any direction for such an aggregate is (3K) 1, so .628 < L < .654. The small difference between the isotropic aggregate SL and the (no summation) in table lsuggests that most cracks are closed by 2kb, and the differences among the are probably due to anisotropy
in the rock matrix.
The reference axes for the Westerly granite sample were chosen in relation to the macroscopic fabric of our sample. In quarrying terminology, the x -direction is normal to the rift plane, the x2-direction is normal to the grain plane, and the x 3-direction is normal to the hardway plane. The data in figure 7a indicate that x1 is near the direction of maximum zero pressure crack strain, as anticipated if rift cracks are preferentially oriented normal to x . The absence of any systematic change in
the principal directions of v with pressure suggests that most of the crack porosity in the sample was produced by the erosional unloading that presumably caused the rift cracks (Jahns, 1943).
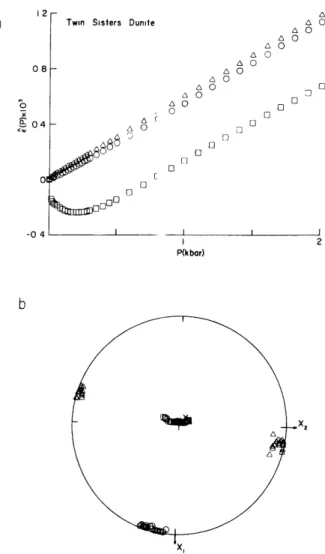
The differential strain tensor (. i) for the Twin Sisters (WA) dunite is shown in figure 8. In this sample, essentially all microcracks are oriented normal to the x 3-direction. The intermediate and least principal strains are roughly aligned
Twin Sisters Dunite ACo On 0 n 0 AC AC AC AC A A ACo A AO o 9CEC C C 2 P(kbar)
Figure 8. . vs. P for Twin Sisters dunite. Figure 8a shows the principal values of E. . (P). Figure 8b shows the
IJ principal axes of 2. .(P). 1J 08 -0 04 01 -04
with x1 and x2, respectively, but are very close in value.
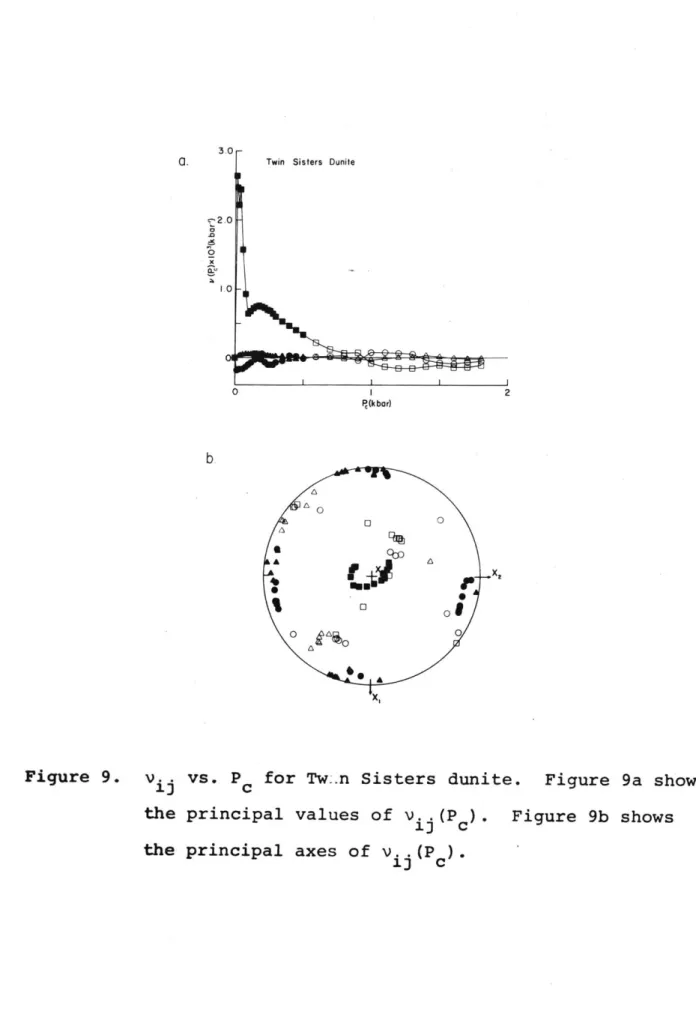
Figure 9 shows the crack distribution tensor (v. .) 1)
calculated from the strain tensor in figure 8. At pressures above ~500 bars, all cracks are closed, so that v. . = 0 and the principal axes of v . are unconstrained. For P < 500 bars (shown by the filled-in points in figure 9), the cracks are oriented normal to x , as was determined from 2 in this case. The closure pressure distribution contains a very sharp spike
for P < 20 bars superimposed upon a relatively smooth distribution to P = 500 bars.
Twin Sisters Dunite
Figure 9. v .j vs. P for Tw:.n Sisters dunite. Figure 9a shows the principal values of v. .(P ). Figure 9b shows
the principal axes of v. .(P ).
1) C
-2.0
to
CONCLUSIONS
The DSA technique allows evaluation of important crack parameters. The porosity distribution of crack closure pressures is obtained, as well as the principal axes of the crack distribution at each closure pressure. In addition, the crack distribution and porosity as a function of pressure can be calculated. Detailed characterization of cracks as described
in this paper should be useful for predicting in situ properties from laboratory data in cases where the in situ crack distribut-ion might differ from that in laboratory samples.
ACKNOWLEDGEMENTS
We benefited from discussions with Herman Cooper, Mike Feves, and Dorothy Richter. Mike Batzle, Mike Feves, Mike Fehler, Herman Cooper, and Ann Harlow helped obtain the DSA data presented herein. We would like to thank Ann Harlow and Lucille Foley for much nonstop typing. This work was supported by the Office of Naval Research contract N00014-76-C-0478 and
National Aeronautics and Space Administration contract NGR-22-009-540.
REFERENCES
Adams, L.H. and E.D. Williamson, On the compressibility of minerals and rocks at high pressures, Franklin Inst. J., 195, 475-529, 1923.
Batzle, M.L. and G. Simmons, Microfractures in rocks from two geothermal areas, Earth Planet. Fci. Lett., 30, 71-93, 1976.
Birch, F., The velocity of compressional waves in rocks to 10 kilobars, part 1, J. Geophys. Res., 65, 1083-1102, 1960. Birch, F., The velocity of compressional waves in rocks to 10
kilobars, part 2, J. Geophys. Res., 66, 2199-2224, 1961. Brace, W.F., Some new measurements of linear compressibility
of rocks, J. Geophys. Res., 70, 391-398, 1965.
Chayes, F., Modal composition of USGS reference sample G-2, Geochem. et Cosmochim.Acta, 31, 463-464, 1967.
Feves, M. and G. Simmons, Effects of stress on cracks in Westerly granite, Bull. Seism. Soc. Am., in press, 1976.
Hill, R., The elastic behaviour of a crystalline aggregate, Proc. Phys. Soc. London (A), 65, 349-354, 1952.
Jahns, R.H., Sheet structure in granites: its origin and use as a measure of glacial erosion in New England, J. Geol., 60, 71-98, 1943.
Love, A.E.H., A Treatise on the Mathematical Theory of Elasticity, Cambridge University Press, London, 643 pp., 1927.
and Analysis of Experiments, Duxbury Press, Belmont, Cali-fornia, 465 pp., 1968.
Morlier, P., Description de l'etat de fissuration d'une roche a partir d'essais non-destructifs simples, Rock Mech., 3, 125-138, 1971.
Nye, J.F., Physical Properties of Crystals, Oxford University Press, London, 322 pp., 1957.
O'Connell, R.J. and B. Budiansky, Seismic velocities in dry and saturated cracked solids, J. Geophys. Res., 79, 5412-5426, 1974.
Peselnick, L., R. Meister, and W.H. Wilson, Pressure derivatives of elastic moduli of fused quartz to 10 kb, J. Phys. Chem. Solids, 28, 635-639, 1967.
Richter, D., G. Simmons, and R. Siegfried, Microcracks, micro-pores, and their petrologic interpretation for 72415 and 15418, Proc. Seventh Lunar Sci. Conf., in press, 1976.
Simmons, G., Velocity of compressional waves in various minerals at pressures to 10 kilobars, J. Geophys. Res., 69, 1117-1121, 1964a.
Simmons, G., Velocity of shear waves in rocks to 10 kilobars, 1, J. Geophys. Res., 69, 1123-1130, 1964b.
Simmons, G. and D. Richter, Microcracks in rocks, in: The Physics and Chemistry of Minerals and Rocks, edited by R.G.J. Strens, Wiley-Interscience, New York, 105-137, 1976.
microcracks in lunar samples, Proc. Sixth Lunar Sci. Conf., 3, 3227-3254, 1975.
Simmons, G., R. Siegfried, and M. Feves, Differential strain analysis: a new method for examining cracks in rocks, J. Geophys. Res., 79, 4383-4385, 1974.
Thill, R.E., R.J. Willard, and T.R. Lur, Correlation of
longi-tudinal velocity variation with rock fabric, J. Geophys. Res., 74, 4897-4909, 1969.
Walsh, J.B., The effect of cracks on the compressibility of rock, J. Geophys. Res., 70, 381-389, 1965.
Chapter ^
Shock-Induced Microfractures in Six Terrestrial Igneous Rocks Characterized with Differential
INTRODUCTION
Microfractures produced by the passage of a shock wave through a rock greatly affect its physical properties at pres-sures below a few kilobars (Simmons et al., 1975; Todd et al., 1973). To predict the type of fracturing that will result from a given shock event, or to interpret the existing crack distri-bution of a rock in terms of its shock history, the relation be-tween the shock-induced crack distribution and various
pre-shock parameters of the rock (e.g., grain size, mineralogy, and initial crack distribution) must be determined. Several authors
(Short, 1966; Horz, 1968, 1969; Richter et al., 1976) have des-cribed petrographically shock-induced fractures in lunar and terrestrial materials. In this paper, we use the differential strain analysis (DSA) technique described by Siegfried and Sim-mons (1977) to characterize the shock-induced microcracks in a suite of terrestrial rocks subjected to various conditions of
shock loading.
We used six different rocks: the Frederick (MD) diabase, the Mellen (WI) gabbro, the Westerly (RI) granite, the Wausau
(WI) granite, the Twin Sisters (WA) dunite, and the Laramie (WY) anorthosite. This suite of samples was selected to represent a range of mineralogy, grain size, and initial crack distribution common in terrestrial igneous rocks. Modal compositions of the Frederick diabase, the Mellen gabbro, the Westerly granite, and the Wausau (Prehn quarry) granite are given by Feves et al. (1976).
Richter and Simmons (1976) petrographically describe the Mellen gabbro and Wausau granite. The Laramie anorthosite is the rock described as anorthosite by Klugman (1966). The Twin Sisters dunite is described in general by Ross et al. (1954). The modal composition of our sample is as follows: olivine (Fo94) - 98.45%, ore - 1.35%, serpentine - 0.19%. Pre-shock crack distribution parameters for the samples are shown in Table 1. Oriented cracks were present in the Wausau and Westerly granites, and in the Twin Sisters dunite; the crack distributions in the rest of the samples were isotropic. All cracks in the dunite were coplanar, and the granites each had a distinct direction normal to which cracks were preferentially oriented (the rift direction, in quarrying terminology).
Samples of all six rocks were subjected to a similar shock condition with an explosive driver-plate apparatus. In addition, four samples were subjected to a shock of slightly higher pres-sure and half the duration of that of the other series of tests. The plane of preferred crack orientation was normal to the direc-tion of shock propagadirec-tion for the dunite and parallel to the
propagation direction for the granite samples. The samples were recovered and examined with DSA in order to identify the sample parameters that significantly affected the post-shock crack distribution.
Rock Type diabase
quartz monzonite
Table 1.
Characterization of Pre-Shock Samples.
Location C(2kbar)[%]
Frederick (MD) 0.0000
Westerly (RI) 0.119 ± .004
gabbro Mellen (WI) 0.007 ± .005
dunite Twin Sisters 0.037 ± .003
(WA)
granite Wausau (WI) 0.043 ± .011
anorthosite Laramie (WY) 0.048 ± .011
i P_ [bars] 120 1300 ~0 250 1500 P (bars] r[bars] 0----420 510 1000 150 530 750 800 130 710 730 r[mm] $(2kbar) [Mb ] .5 1.36 .5 2.12 .5 3.0 2.0 5.0 1.35 1.10 2.06 1.61 Sample 1243-V 1132-V 1331-V 178-V 1374-V 734-V
EXPERIMENTAL TECHNIQUES
The rock samples were shock loaded with an explosive flying plate accelerator of the 'mousetrap' type, illustrated in figure 1. A line wave generator is used to detonate simultaneously the
high explosive (HE) along one edge of the driver plate. As the detonation front proceeds through the high explosive, the driver plate is accelerated by the expanding gases. The angle a in figure 1 is adjusted so that sin a = V/v HE, where V is
the flyer plate velocity, and vHE is the velocity of the detona-tion front in the high explosive. This choice of a causes the driver plate to arrive everywhere on the target simultaneously, generating a plane shock wave in the sample assembly. In
practice, the edges of the driver plate tend to lag behind the center, so that the shock wave approximates a plane only in the region near the center of the driver. For this reason, the edge dimension of the square driver plate used was three times the sample diameter. The apparatus used is shown schematically in figure 2. The driver assembly was constructed of plexiglass, with the exception of the polycarbonate driver plate. General Electric Lexan driver plates 0.64 and 0.32 cm thick were used, with Du Pont Detasheet high explosive 0.038 and 0.025 cm thick. Wooden supports held the driver assembly and the aluminum sample holder in the proper angular relationship. The wooden support assembly rested on top of a steel garbage can completely filled with water, from which the sample was recovered after the shot.
Figure 1. Schematic diagram of the flying plate apparatus. As the detonation front proceeds along the high explosive (HE), the driver is accelerated. The angle a is adjusted so that the driver arrives simultaneously at all points on the target.
Spacer Wood-Plywood Spacer Driver Figure 2. 10 CM
Apparatus used in shock experiments. The upper
diagram shows the relationship of the driver assembly to the sample holder assembly. The lower diagram is a view of the driver side of the driver assembly, showing the location of the high explosive (HE) and the Du Pont line wave generator (LWG).
In order to determine the proper angle a, several shots were detonated with various combinations of explosive and driver plate thickness. Their construction was similar to that shown in figure 2; however, the sample assembly was replaced by a target that allowed photographic determination of the relative arrival time of the shock wave at various points on the target, using the flash gap technique developed by Walsh and Christian (1955).
The target used for the calibration shots is shown in
figure 3. When the shock wave propagates into the argon-filled flash gap, the heated gas emits a flash of light that can be recorded photographically. The light coming through the
slits shown in figure 3 is photographed with a rotating mirror streak camera. The image is swept across the film with a
known velocity in the direction normal to the slits so that if the shock wave arrives simultaneously at all points on the target the slit images are straight lines perpendicular to the direction of sweep. If the arrival is not simultaneous, the velocity of the driver plate (and the appropriate correction to a) can be determined from the angle between the slit images and the direction of sweep.
In addition to determining the appropriate angle a to use in the sample recovery shots, the series of calibration shots allowed an estimate of the region over which the shock wave was planar. In a typical shot, arrival was within 0.1 ys
I
i
I I I I I
DRIVERL---
PLEXIGLASS
-FLASH
GAP PLEXIGLASS STREAK CAMERA SWEEPFigure 3. Target used in calibration experiments. When the driver arrives at a point on the target, the gas in the flash gap at that point luminesces, produc-ing an image through the slit mask on the film in the streak camera.
over an area with dimensions roughly two thirds those of the driver plate.
The samples were discs 10.2 cm in diameter by 2 1/2 cm thick, cut with a diamond core drill. The parallel faces were surface ground parallel to within 0.005 cm. The samples were encased in a sample holder as shown in figure 4. A hole was machined into each sample holder, a 30 cm disc of 2024 aluminum, to fit each particular sample. Aluminum plates 0.63 cm thick were placed above and below the sample holder, as shown in figure 2, so that the polycarbonate driver impacted the top plate rather than the sample.
In the first trial recovery shot, the sample was badly broken by sets of radial and concentric fractures converging toward the center of the sample. These fractures were probably due to waves generated by the impedance mismatch at the inter-face between the diabase sample and the aluminum sample holder and propagated toward the center of the sample. To solve
this problem, we minimized the coupling between these waves and the center portion of the sample. See figure 4. A 5.1 cm core was cut from the center of each 10.2 cm sample disc. The cylindrical surface of the 5.1 cm core was coated with silicone vacuum grease, and the 0.16 cm gap between the disc and the surrounding annulus caused by the kerf of the core drill was filled with epoxy and Al 203 mixed in proper proportions to match the sample density. All of the shots reported in this paper
Figure 4. Sample holder. A hole was machined into the alum-inum disc to fit each sample. The lower diagram is a cross section of the sample and holder.
were prepared with this central core, which seemed to solve the problem; the outer rock ring was often broken but the central disc remained physically intact.
The shock pressure in a target can be calculated from the driver plate velocity if the Hugoniot equations of state for both the driver and target materials are known. The calcula-tion of shock pressure in a one-dimensional impact experiment has been described by several authors (Duvall and Fowles,
1963; Gault and Heitowit, 1963). The Rankine-Hugoniot equations, expressing conservation of mass, momentum, and energy across
a steady shock front, form the basis for calculation of shock parameters:
P0 U = p(U-u) (1)
P -P 0 PO 0 Uu (2)
2
[(E - E0 -~I0U = POu (3)
where U is the shock propagation velocity, u is the particle velocity due to the shock wave, P is pressure, p is density, and E is internal energy. The subscript zero refers to the initial state. If any two of the shock parameters U, u, p, P, or E are known, the above equations are sufficient to determine all others. Since pressure and particle velocity must be
continuous across an interface, a convenient representation of the Hugoniot equation of state of a material is the locus
of points on a P-u diagram representing states connected by a shock transition from the initial state.
In figure 5, we illustrate the calculation of u and P for the transmitted and reflected waves due to a shock inci-dent on an interface between two dissimilar materials. If
(u1,P1) is the state of materLal A behind the shock wave, the reflected wave locus must also pass through (u1 , P1 ). The reflected wave locus is the mirror image of the incident wave locus, reflected through (u1,P1). Since u and P must be
continuous across the interface, the state in both material A and B behind the reflected and transmitted waves must be given by the intersection (u2' 2) of the loci for the reflected wave in A and the transmitted wave in B.
A similar graphical approach is used in the case of a driver of material A impacting a target of material B. In
this case, the velocity of the driver (V) is the known quantity. The reflected wave locus for the driver must pass through the point (V,O), thus determining the state (u2' 2) of the target after the passage of the transmitted wave.
Shots were detonated with three combinations of explosive and driver plate thicknesses. The driver plate velocities, shock durations, and calculated shock pressures in aluminim that resulted from each of these combinations are shown in Table 2. Hugoniot curves for polycarbonate, 2024 aluminum, and three of the rocks used for our shock recovery experiments
INCIDENT SHOCK
-Air
Figure 5. Determination of shock pressures and particle
velocities for the reflection of a shock at an inter-face. The curve marked 'A' is the Hugoniot locus for material A. The curve marked 'A" is the locus for the reflected wave in material A. The curve 'B' is the Hugoniot locus for material B.
64
Table 2.
Shock Experiment Parameters.
v (km/sec) .26 .21 .40 P (kbar) 6.0 4.6 9.8 t (psec) 3.2 6.5 3.1 d: Driver thickness. v: Driver velocity.
P: Pressure of transmitted shock in aluminum. t: Shock duration.
d (cm)
.32
.64
are plotted in figure 6. The curves for Frederick diabase and Westerly granite are almost identical to that for aluminum, while the dunite curve differs somewhat over the pressure range of interest. The gabbro used in our experiments is mineralogi-cally similar to the diabase, and probably has a similar
Hugoniot curve. The curve for the anorthosite is probably very close to the granite and diabase curves, at least at the relatively low pressures shown in figure 6.
In all samples besides the dunite, the shock wave will be transmitted essentially without change from the aluminum cover plate into the sample. The determination of the shock pressure in aluminum for each of the three shot configurations is shown in figure 6. The resulting pressures are marked P1, P2, and P3 in figure 6 and tabulated in Table 2. The shock pressure in the dunite can be determined once the state of the aluminum after shock passage is known, as.shown in figure 6 by the
pressure marked P The shock pressure in the dunite is about 20% greater than that in the rest of the samples with the same driver velocity.
The duration of the shock pulse is controlled by the time required for the shock wave to travel to the driver-air inter-face and be reflected back as a pressure release wave. The pulse duration (t) for each shot configuration is listed in Table 2.
0 0.1 0.2 u (km/sec)
Figure 6. Hugoniot curves for the materials used in our shock experiments. The curve for aluminum (2024) is
from McQueen et al. (1970). The diabase and dunite curves are from McQueen et al. (1967). The data for granite is from Brace and Jones (1971). The polycarbonate curve is derived from unpublished measurements of bulk sound velocity and high pres-sure Hugoniot points by McQueen. Shock prespres-sures in aluminum for the various experimental configura-tions are shown by Pi, P2, and P 3' PD is the pres-sure in dunite for the one dunite shot.

![Table 1. DSA Parameters Westerly granite Twin Sisters dunite ii (2kb) x 106 [±25]11 22 33275 215 1650 0 370 6 (2kb) (Mb ) [±.010]1122 33.667 .717 .699.352 .357 .393](https://thumb-eu.123doks.com/thumbv2/123doknet/14746181.578258/33.918.119.797.142.566/table-dsa-parameters-westerly-granite-twin-sisters-dunite.webp)