HAL Id: hal-01460380
https://hal.archives-ouvertes.fr/hal-01460380
Submitted on 21 Apr 2021
HAL is a multi-disciplinary open access
archive for the deposit and dissemination of
sci-entific research documents, whether they are
pub-lished or not. The documents may come from
teaching and research institutions in France or
abroad, or from public or private research centers.
L’archive ouverte pluridisciplinaire HAL, est
destinée au dépôt et à la diffusion de documents
scientifiques de niveau recherche, publiés ou non,
émanant des établissements d’enseignement et de
recherche français ou étrangers, des laboratoires
publics ou privés.
Distributed under a Creative Commons Attribution| 4.0 International License
Evidence for large methane releases to the atmosphere
from deep-sea gas-hydrate dissociation during the last
glacial episode
T Garidel-Thoron, L Beaufort, F Bassinot, P Henry
To cite this version:
T Garidel-Thoron, L Beaufort, F Bassinot, P Henry. Evidence for large methane releases to the
atmosphere from deep-sea gas-hydrate dissociation during the last glacial episode. Proceedings of the
National Academy of Sciences of the United States of America , National Academy of Sciences, 2004,
101 (25), pp.9187-9192. �10.1073/pnas.0402909101�. �hal-01460380�
Evidence for large methane releases to the
atmosphere from deep-sea gas-hydrate
dissociation during the last glacial episode
Thibault de Garidel-Thoron*†‡, Luc Beaufort*, Franck Bassinot§, and Pierre Henry¶*Centre Europe´en de Recherche et d’Enseignement en Ge´osciences de l’Environnement兾Centre National de la Recherche Scientifique兾Universite´ Aix-Marseille 3, B.P. 80, 13545 Aix-en-Provence Cedex 4, France;†Institute of Marine and Coastal Sciences, Rutgers, The State University of New Jersey, 71 Dudley Road, New Brunswick, NJ 08901;§Laboratoire des Sciences du Climat et de l’Environnement, Domaine du Centre National de la Recherche Scientifique, 91198 Gif兾Yvette, France; and¶Colle`ge de France兾Centre National de la Recherche Scientifique, 13545 Aix-en-Provence, France Communicated by James P. Kennett, University of California, Santa Barbara, CA, April 25, 2004 (received for review February 23, 2004)
Past atmospheric methane-concentration oscillations recorded in polar ice cores vary together with rapid global climatic changes during the last glacial episode. In the ‘‘clathrate gun hypothesis,’’ massive releases of deep-sea methane from marine gas-hydrate dissociation led to these well known, global, abrupt warmings in the past. If evidence for such releases in the water column exists, however, the mechanism and eventual transfer to the atmosphere has not yet been documented clearly. Here we describe a high-resolution marine-sediment record of stable carbon isotopic changes from the Papua Gulf, off Papua New Guinea, which exhibits two extremely depleted excursions (down toⴚ9‰) at ⬇39,000 and ⬇55,000 years. Morphological, isotopic, and trace
metal evidence dismisses authigenic calcite as the main source of depleted carbon. Massive methane release associated with deep-sea gas-hydrate dissociation is the most likely cause for such large depletions of␦13C. The absence of a␦13C gradient in the water
column during these events implies that the methane rose through the entire water column, reaching the sea–air interface and thus the atmosphere. Foraminiferal␦18O composition suggests that the
rise of the methane in the water column created an upwelling flow. These inferred emission events suggest that during the last glacial episode, this process was likely widespread, including tropical regions. Thus, the release of methane from the ocean floor into the atmosphere cannot be dismissed as a strong positive feedback in climate dynamics processes.
D
uring the last glacial episode, rapid climatic changes re-corded in ice-core records are closely associated with variations in concentration of atmospheric methane, a powerful greenhouse gas, showing a maximum amplitude of⬇200 parts per billion by volume (1). Until recently, the main source of atmospheric methane during the last glacial episode was attrib-uted to low-latitude continental wetlands emissions (2, 3), whereas the potential role of deep-sea and lake-gas hydrates was largely ignored. The accepted hypothesis of a strong link be-tween climate and methane emissions from wetlands was called into question recently by an exhaustive review of the timing and extension in the geological record of these wetlands (4), as well as by numerical simulations of the global carbon cycle (5). Finally, two independent geochemical proxies, the isotopic com-position of foraminifera (6) and the molecular comcom-position of the organic matter (7), shed light on the potential role of large methane releases from gas-hydrate dissociation as an important source in the oceanic global carbon cycle. These two records from the Santa Barbara Basin have shown that these inferred methane releases occurred during the last glacial episode in response to a warming of the intermediate waters and thus presumably of the deep-sea sediments. These deep-sea methane emissions occurred synchronously with rapid climate warmings associated with atmospheric methane increases and led Kennettet al. (6) to propose the ‘‘clathrate gun hypothesis,’’ which
postulates that deep-sea methane hydrates played a significant
role in late quaternary climate changes (4). Thus far, evidence for such methane releases in the glacial world is limited to a few regions (8, 9), and the mechanism by which the methane passed through the water column, and eventually to the atmosphere, has not yet been demonstrated. Here we document evidence that two massive methane releases from clathrate dissociation, of ampli-tude two to three times larger than those inferred in the Santa Barbara Basin, occurred during the last glacial episode in the western Pacific.
Materials and Methods
We studied the IMAGES MD97-2134 piston core located in the Papua Gulf (depth of 760 m, lat 9°54⬘S, long 144°39⬘E), ⬇150 km off the Fly River delta (Fig. 1). High terrigenous inputs from Papua New Guinea lead to high sedimentation rates of ⬇25 cm䡠(thousand years)⫺1(ka) during the last glacial episode (Fig.
2). The core contains dark argillaceous muds with abundant coccoliths, foraminifera, and pteropods. Isotope measurements were conducted at Laboratoire des Sciences du Climat et de l’Environnement (Centre National de la Recherche Scientifique– Commissariat a` l’Energie Atomique, Gif-sur-Yvette, France) by using a Kiel device coupled to a Finnigan MAT 251 mass spectrometer. The external precision was 0.05‰ for␦18O and
0.03‰ for␦13C analysis as determined by repeated
measure-ments of a standard carbonate material, NBS19. Approximately 10–15 foraminifera shells were used for each isotopic measure-ment. Mg兾Ca measurements were conducted by using a Rutgers Varian inductively coupled plasma optical emission spectrome-ter following the analytical protocol detailed by Rosenthal et al. (10). The chronostratigraphy was established by using 13 accel-erator mass spectrometer14C ages on the planktonic foraminifer
Globigerinoides ruber. To account for past changes in 14C
pro-duction, these ages were converted to calendar ages assuming 400 years of reservoir age and applying the INTCAL98 calibra-tion curve for ages up to 24 ka (11) and a polynomial calibracalibra-tion based on coupled14C兾U/Thages in corals for ages⬎24 ka (12).
The Laschamp excursion (1,050 cm) is well marked in the magnetic record (C. L. Blanchet, N. Thouveny, and T.d.G.-T., unpublished results) and provides a chronological datum in marine isotope stage (MIS) 3 at 40 ka (13). The similarity of MD97-2134 paleointensity record with paleomagnetic reference stacks indicates that no hiatus interrupts the sediment record during the last 60 ky. The MIS 4兾3 boundary in the oxygen isotope record at 1,600 cm was also tuned to the SPECMAP reference curve (14). The uncertainty of this age model is ⬇2–3 ky.
Abbreviations: ka, thousand years; MIS, marine isotope stage; DIC, dissolved inorganic carbon.
‡To whom correspondence should be addressed. E-mail: garidel@imcs.rutgers.edu.
© 2004 by The National Academy of Sciences of the USA
Results
We document past changes in surface hydrography by using stable isotopes measured in the calcite shells of the planktonic
foraminifera G. ruber, a species living primarily in the mixed layer (Fig. 2). The ␦18O record displays global glacial兾
interglacial changes associated with the growth and decay of the polar ice sheets. The ␦13C record of G. ruber exhibits
glacial-interglacial changes of⬇1.2–1.5‰, reflecting changes in the surface productivity. However, two large anomalous negative excursions in this record reach⫺8.95‰ (⌬ ⫽ ⫺9‰ from the background) and⫺5.62‰ (⌬ ⫽ ⫺5.7‰) at 39 and 55 ka, respectively (Fig. 3). Associated with the negative␦13C
excursions, the␦18O of G. ruber shows strong positive
anom-alies reaching⫺0.45‰ (⌬ ⫽ ⫹1.05‰ from the background) and⫺0.6‰ (⌬ ⫽ ⫹0.7‰ from the background) at 39 and 55 ka, respectively. Due to the thickness of the 39-ka excursion (25 cm), bioturbation has no significant dilution effect on its amplitude but may induce a smoothing on the 55-ka event (10 cm thick). To examine whether the entire water column was affected during these events, we analyzed stable isotopes in two other foraminiferal species: Globorotalia truncatulinoides, a deep-dweller planktonic species living close to the thermo-cline, and a benthic species, Uvigerina sp. (Fig. 3). The deep-dwelling planktonic species exhibits␦13C anomalies at 39
ka reaching ⫺5.8‰ (⌬ ⫽ ⫺5.4‰) and at 55 ka reaching ⫺3.12‰ (⌬ ⫽ ⫺2.6‰) (Table 1). Likewise, the ␦13C of
benthic foraminifera decreases to⫺9.4‰ (⌬ ⫽ ⫺8.5‰) at 39 ka and to ⫺6.22‰ (⌬ ⫽ ⫺5.2‰) at 55 ka. These negative isotopic anomalies were found in replicate analyses of the foraminifera.
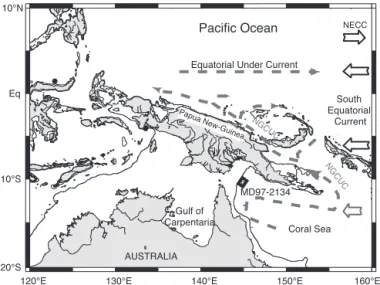
Fig. 1. Map location of the MD97-2134 core in the Papua Gulf. The black
circles indicate the position of known bottom-simulating reflectors indicative of deep-sea gas hydrates (36, 37). The shaded rectangle highlights the area taken into account for methane-release estimates.
Fig. 2. Comparison of Greenland ice-core record of␦18O and atmospheric methane concentration with foraminiferal␦18O and␦13C time series from the
MD97-2134 sediment core located in the Papua Gulf. (a) Greenland Ice Sheet Project 2 (GISP2) ice-core record of␦18O spanning the last 17 interstadials (38). (b) Atmospheric methane concentration (35). (c) MD97-2134 age-model tie points: circles indicate radiocarbon-calibrated dates, the star refers to the Laschamp paleomagnetic excursion, and the diamond refers to the MIS 4兾3 boundary tuned to the SPECMAP stack. Records of␦18O (d) and␦13C (e) isotopic composition of G. ruber in core MD97-2134 are shown also. ppbv, parts per billion by volume; VPDB, Vienna Pee Dee Bee.
Discussion
We examine different hypotheses that might explain the large negative␦13C anomalies observed in our record. Foraminifera
␦13C is a function of the ␦13C of dissolved inorganic carbon
(DIC), air–sea exchange rate, and temperature. The latter two factors have only a minor influence on ␦13C (15). First, we
exclude the hypothesis of a change in the biological productivity, because the observed range in the modern and past foraminifera composition␦13C spans 0 to⫺2‰ (16). Four other13C-depleted
sources have been invoked to explain past excursions in the DIC isotopic composition. (i) Volcanic and hydrothermal activities release large amounts of CO2with␦13C of approximately⫺5‰
(17). This value, however, is too positive to explain the carbon isotope excursions seen in our record. (ii) There is exceptional freshwater flow from the Fly River with ␦13C
DIC of
approxi-mately⫺10‰. Three arguments rule out this hypothesis. First, atmosphere–river CO2exchange tends to modify the DIC
iso-topic composition toward the equilibrium value of␦13C
DIC ⬇
1‰ (18). The ‘‘flow hypothesis’’ would also imply that the isotopic composition of the 700-m-thick water column reflects only the riverine pool, with no influence from the seawater pool. Moreover, the Fly River flow scenario is not supported by the positive ⬇0.8‰ peak occurring simultaneously in the plank-tonic ␦18O records. This shift corresponds to a minimal 2°C
cooling and兾or an increase in ␦18O of seawater, whereas a
massive increase of riverine input from the Fly River should have caused a negative␦18O excursion. (iii) Oxidation of the low␦13C
methane produced during the burial of organic matter (19), or enhanced carbon rain and carbon oxidation in the sediments (20), can also modify the surficial sediment pore water ␦13C
gradient. Although benthic infaunal foraminifera might record this steeper ␦13C gradient, this process cannot have lowered
simultaneously the surface ocean ␦13C of DIC and thus the
isotopic composition of planktonic shells. (iv) Finally, large methane hydrate releases with an average␦13C value of
approx-imately⫺65‰ can be invoked to explain the amplitude of the carbon excursion (21). Bottom-simulating reflectors, which are associated with gas hydrate occurrences in deep-sea sediments, have been described in western Pacific marginal seas, although as yet not in the Gulf of Papua (Fig. 1). They suggest that conditions conducive to the formation of gas hydrates can occur on the tropical western Pacific margins.
We consider unlikely the possibility of significant diagenetic recrystallization in the sediment from pore waters isotopically modified by the in situ dissociation of methane gas hydrates, because such events are associated with strong disturbance of the sediments, which are lacking in core MD97-2134. The source of inferred methane releases during these events is thus not at the location of the core but was likely close to the site. This conclusion is supported by the depth of the MD97-2134 core, at which such releases can potentially occur, and because benthic foraminifera ␦13C records these events. A species-dependent
mass-balanced recrystallization of the calcite from pore waters linked to in situ gas-hydrate dissociation also cannot account for
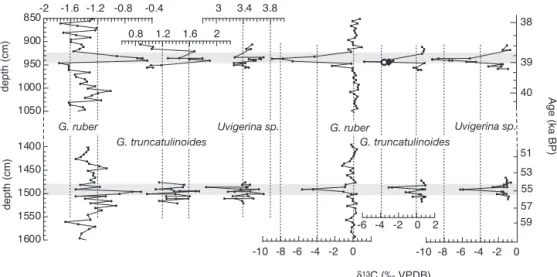
Fig. 3. ␦18O and␦13C isotopic records at two levels in the MD97-2134 core for three foraminiferal species: G. ruber (shallow-dwelling species), G. truncatulinoides
(deep-dwelling species), and Uvigerina sp. (benthic species).␦13C values for P. obliquiloculata (open circle) and N. dutertrei (filled diamond), both subsurface planktonic-dwelling species, are shown. VPDB, Vienna Pee Dee Bee.
Table 1. Isotopic values and Mg兾Ca ratio for the different species analyzed in the␦13C
minimum levels recorded in the MD97-2134 core
Event age, ka B.P. Depth, cm Species ␦18O, ‰ VPDB ␦13C, ‰ VPDB Mg兾Ca, mmol/mol 39 970 G. ruber ⫺0.54 ⫺8.95 968 Pulleniatina obliquiloculata 0.08 ⫺3.11 3.27 968 Neogloboquadrina dutertrei ⫺0.02 ⫺3.52 2.59 972 G. truncatulinoides 1.59 ⫺5.80 970 Uvigerina sp. 3.65 ⫺9.34 55 1,530 G. ruber ⫺0.56 ⫺5.62 1,530 G. truncatulinoides 1.39 ⫺1.23 1,530 Uvigerina sp. 3.70 ⫺6.24 GEOLOGY
these excursions. To imprint a⫺8.5‰ excursion in the benthic foraminifer calcite␦13C and of ⫺9‰ in the surface-dwelling
planktonic foraminifera requires that a similar amount (⬇12– 15%) of the calcite in both taxa come from the␦13C hydrate pool
of approximately⫺65‰. This percentage cannot be reconciled with the oxygen isotopic data that imply a differential species-dependant recrystallization of 60% and 25%, respectively, for these two taxa. For this calculation, we assume that the␦18O of
the pore waters was of⬇1.4‰, accounting for (i) the ⬇1‰ enrichment due to the glacial polar ice sheet that trapped depleted18O (22) and (ii) an ⬇0.4‰ increase linked to the
gas-hydrate fractionation process (23).
The original ultrastructures of foraminiferal tests are well preserved across the negative carbon isotopic excursions, as revealed by visual observation and scanning electron microscope observations in the␦13C minimum at 968 cm (Fig. 4). At this
level, inner and outer sectors of pores are well connected, exhibiting similar patterns to modern forms (24) and to another core level (945 cm) with normal ␦13C values. The possible
presence of diagenetic calcite that might not be visible in scanning electron microscope investigation has been evaluated further by determining Mg兾Ca on two deep-dwelling foraminif-era species: Neogloboquadrina dutertrei and Pulleniatina
obliquiloculata. Mg兾Ca in foraminiferal tests has been shown to be a sensitive marker of diagenetic alteration, with values up to 150–250 mmol兾mol depending on the amount of authigenic calcite (25, 26). The paucity of G. ruber across the negative carbon excursion prevented trace metal analysis on this species. The␦13C composition of N. dutertrei and P. obliquiloculata are
consistently depleted with values of⫺3.5‰ and ⫺3.1‰, re-spectively, at 968 cm. At this level, preliminary analyses in inductively coupled plasma optical emission spectrometry of Mg兾Ca indicate a value of 2.57 mmol兾mol for N. dutertrei and 3.18 mmol兾mol for P. obliquiloculata. These values are in the same range as the background values measured at 1,015 cm, with 2.69 mmol兾mol for N. dutertrei and ⬇2.34 mmol兾mol in P.
obliquiloculata, although slightly higher for the latter. This
approach confirms that the existence of a 13C-depleted and
Mg兾Ca-enriched crust is minimal in the interval studied. The lower carbon and higher oxygen isotopic values in the various foraminiferal taxa cannot be accounted for by authigenic re-crystallization. These isotopic anomalies must reflect changes in seawater chemistry in agreement with the combined isotopic and molecular evidence previously shown for the Santa Barbara Basin (7).
The stability of gas hydrates varies with temperature and pressure (27). During MIS 3, sea level was lower by⬇80 m (28), reducing the hydrostatic pressure and enhancing the probability of hydrate dissociations (29). However, abrupt changes in sea level did not exceed⬇15-m amplitude and are unlikely, there-fore, to have triggered methane releases (28). The largest excursion at 39 ka is marked by two successive steps. First, a slight␦18O decrease in benthic foraminifera, which might
indi-cate a warming (⬇1°C) of deep-sea waters preceding the inferred hydrate dissociation event. Although earthquakes or tsunamis might also have triggered dissociation of hydrates, this slight increase in temperature is in agreement with recent experimen-tal studies emphasizing the critical role of temperature in the dissociation of hydrates (e.g., ref. 30). Second, this trend is interrupted by a significant 0.4‰ increase of the oxygen isotopic signal, in phase with the carbon isotopic anomaly (Fig. 3). That latter increase in␦18O is similar to the interstitial water anomaly
observed during gas-hydrate dissociation on Blake Ridge (23) and in agreement with the shallow infaunal habitat of Uvigerina
sp. The largest␦18O increase in the surface waters (⌬␦18O⬇
⫹1‰ in G. ruber) is by far too large to be attributed to the same process. This enrichment could be interpreted as a local cooling in upper surface waters (⬇3–4°C), resulting from the mixing of the water column through upwelling of cold deep waters induced by the thermal dissociation of gas hydrates. The chronological succession is less clear for the 55-ka excursion. The lower sedimentation rate during this interval and thus a stronger effect of the bioturbation is likely to have removed small-scale details. The amplitude of the benthic carbon isotopic excursions associated with warm intervals during MIS 3 observed in the Santa Barbara Basin is lower than the amplitude of the
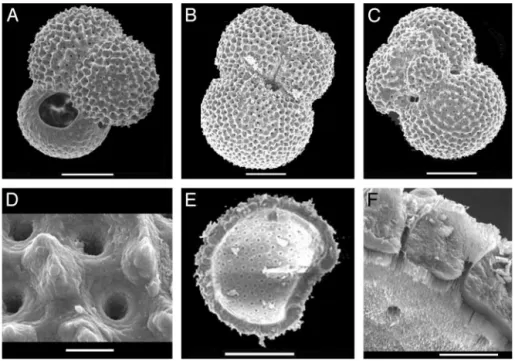
anom-Fig. 4. Scanning electron microscope pictures of well preserved planktonic foraminifera from the13C minimum level at 968 cm in sediment core MD97-2134.
G. ruber umbilical (A) and extraumbilical (B and C) views by scanning electron microscopy at 968 cm in core MD97-2134, in the␦13C minimum. At higher resolution, the specimen (C) exhibits a typical external porosity (D). Calcite layers and inner porosity are also well preserved (F) of the crushed G. ruber (E). (Scale bars: A–C and E, 100m; D and F, 10 m.)
alies recorded in core MD97-2134 (maxima of ⬇4.5‰ and ⬇9‰, respectively) (6). Moreover, the ␦18O increases in the
planktonic records were not observed in the Santa Barbara Basin during the largest events at 37.5 and 44 ka. This difference is likely to reflect a stronger physical mixing in the water column in the Gulf of Papua, indicative of a much larger flux of methane, in agreement with the␦13C excursion.
An additional question is whether the methane was oxidized close to the sea floor or whether it was oxidized throughout the water column, implying that some of the methane was outgassed into the atmosphere. Considering the order of magnitude of diffusion coefficients arising from turbulent mixing in the open ocean as well as typical upwelling velocities, it seems highly unlikely that the␦13C
DICin the water column would have been
homogenized after methane oxidation at the sea floor. In advection-diffusion problems, the ratio of transport to diffu-sion is usually given by the adimendiffu-sional Peclet number Pe⫽ V ⫻
L兾D, where V is a characteristic velocity, L is a characteristic length, and D is the diffusion coefficient. For Pe⬎⬎ 1, the advection is dominant, whereas diffusion is dominant for Pe ⬍⬍ 1. When diffusion (or turbulent mixing described with an effective diffusion coefficient) occurs orthogonally to the main transport direction, the geometrical aspect ratio of the system must also be taken into account, which can be done by defining a transverse Peclet number
PeT⫽ V ⫻ H兾D, where V is the velocity of the water layer, H is its thickness, and D is the diffusion coefficient. Then, the ratio of horizontal advection to vertical diffusion is (H兾L)PeT, where L is the horizontal length scale.
In the Papua Gulf, V ranges from 0.01 to 1 m兾s, H from 100 to 700 m, and D from 3.10⫺5to 3.10⫺4m2兾s (31); thus, PeT may
range 3.103to 2.107. The horizontal length scale necessary for
homogenization is thus large, because L must exceed 100 km for a (H兾L)PeT of 1, even assuming a very low average current speed of 1 cm兾s. The implication is that the water column can only be homogenized several hundred kilometers downstream of the light DIC source, assuming this source only affects the lower part of the water column. This approach does not take into account the effect of horizontal dispersion (which may be increased by oscillating tidal flows) and exchange with the atmosphere. However, these processes do not favor vertical homogenization. Therefore, homogenization of␦13CDICis unlikely to result from
only diffusive mixing unless light␦13C sources were distributed
over a wide area covering most of the Gulf of Papua.
Vertical upwelling due to the Ekman transport is an alterna-tive possibility, but again, a wide source area is required as well as upwelling rates in the upper range of typical values associated with extraordinary wind stress. Oxidation of methane at all levels in the water column associated with upwelling flow induced by methane rise seems to be the most likely explanation to reconcile ␦13C and␦18O data. This hypothesis is supported by the
descrip-tion of a modern upwelling flow induced by methane seeps on the western American margin (32). In this modern analog, the methane bubbling induces vertical velocities up to 1 m兾s, which modify the local properties of the seawater column. Moreover, the methane is oxidized during the vertical transfer and is eventually outgassed into the atmosphere. Likewise, but at a larger scale, the isotopic records in core MD97-2134 indicate that methane passed throughout the water column and reached the sea–air interface.
In a first step, we estimate the minimum amount of oxidized methane in the water column by using a C-isotope mass-balance
equation, assuming that a single event created these anomalies. We arbitrarily assume that the releases affected an oceanic volume of 1,000 km3(Fig. 1), which is not unrealistic given the
surface of the Papua Gulf and its location in the open Pacific. The minimal volume of methane degassed and oxidized in the water column during the main event at⬇39 ka is estimated at ⬇5.5 ⫻ 109m3.储It corresponds to⬇4 Tg (teragrams) of methane,
which is approximately two to three times higher than estimates made for the Santa Barbara Basin (6). The lack of a water-column vertical gradient in the ␦13C record and the long
stratigraphic extension of these anomalies indicate that these inferred emissions were sustained for a period longer than a few generations of foraminifera. Regardless of the uncertainties in the duration, assuming a minimal 10-year methane-venting scenario with a residence time of ⬇2 months implies a total release of methane of at least⬇200 Tg, with an annual flux of ⬇20 Tg. This corresponds to ⬇3.5% of the modern annual source of methane to the atmosphere (34) but reaches⬇10% of the glacial emission rate. If we speculate that an equivalent quantity of methane oxidized in the water column is outgassed into the atmosphere, the direct radiative effect of the 39-ka excursion reaches at least⬇0.3 W䡠m⫺2(34). In comparison, the
preindustrial radiative forcing of the well mixed greenhouses gases (CO2, CH4, N2O, and halocarbons) is⬇2.5 W䡠m⫺2. In the
glacial episode, this methane release could have contributed significantly to increase the global radiative forcing due to the methane and thus warmed the atmosphere. Although ice-core records suggest large increases in atmospheric concentration in phase with the 39- and 55-ka B.P. methane releases (35), present chronological uncertainties in both ice-core and marine sedi-ment records are still too large to determine accurately whether the Papua Gulf methane releases are synchronous with increases in methane atmospheric concentration.
Thus, although the area of the Fly River shelf is small, it produced a significant deep-sea methane hydrate source for the global methane cycle. The paucity of other high-sedimentation-rate records from other low-latitude shelves could explain the lack of other evidence of methane gas-hydrate destabilization during the last glacial episode. If such events were widespread and more common during MIS 3, this source could explain a large part of the methane fluctuation recorded in ice cores as hypothesized in the clathrate gun hypothesis (4). In conclusion, our record demonstrates that significant volumes of methane can be transported through the entire water column in association with a physical mixing of the water column and be released into the atmosphere.
储For this estimation, we assume that the isotopic anomaly in the␦13C
G. ruberof⫺8.31‰
results from a linear mixing between the methane pool (⫺65‰) (21) and the seawater pool (corresponding to the background value of 0.31‰) in a single event release. The DIC concentration in the western Pacific is 0.0022 mol䡠liter⫺1(33).
We thank N. Buchet, B. Lecoat, L. Vidal, and V. Starovoytov for their help; and M. Paterne, M. Arnold, and N. Tisnerat for14C datings, which were
performed by accelerator mass spectrometry at the Tandetron facility, LSCE. Comments by D. Andreasen, J. Dickens, J. Kennett, K. Kvenvolden, Y. Rosenthal, and two anonymous reviewers contributed to the improve-ment of this manuscript. The support of French MENRT, TAAF, and IPEV to the Marion Dufresne and the support of Centre National de la Recherche Scientifique兾Institut National des Sciences de l’Univers (ECLIPSE and Ad Hoc ocean) was necessary to perform this work.
1. Chappellaz, J., Blunier, T., Raynaud, D., Barnola, J.-M., Schwander, J. & Stauffer, B. (1993) Nature 366, 443–445.
2. Chappellaz, J., Blunier, T., Kints, S., Dallenbach, A., Barnola, J.-M., Raynaud, D. & Stauffer, B. (1997) J. Geophys. Res. 102, 15987–15998.
3. Da¨llenbach, A., Blunier, T., Flu¨ckiger, J., Stauffer, B., Chappellaz, J. & Raynaud, D. (2000) Geophys. Res. Lett. 27, 1005–1008.
4. Kennett, J. P., Cannariato, K. G., Hendy, I. L. & Behl, R. J. (2002) Methane
Hydrates in Quaternary Climate Changes: The Clathrate Gun Hypothesis (Am.
Geophys. Union, Washington, DC).
5. Kaplan, J. O. (2002) Geophys. Res. Lett, 10.1029兾2001GL013366.
6. Kennett, J. P., Cannariato, K. G., Hendy, I. L. & Behl, R. J. (2000) Science 288, 128–133.
7. Hinrichs, K.-U., Hemlo, L. R. & Sylva, S. P. (2003) Science 299, 1214– 1217.
8. Keigwin, L. D. (2002) J. Oceanogr. 58, 421–432.
9. Smith, L. M., Sachs, J. P., Jennings, A. E., Anderson, D. M. & deVernal, A. (2001) Geophys. Res. Lett. 28, 2217–2220.
10. Rosenthal, Y., Field, F. & Sherrell, R. M. (1999) Anal. Chem. 71, 3248–3253. 11. Stuiver, M., Reimer, P. J., Bard, E., Beck, J. W., Burr, G. S., Hughen, K. A., Kromer, B., McCormac, F. G., van den Plicht, J. & Spurk, M. (1998)
Radiocarbon 40, 1041–1083.
12. Bard, E. (1998) Geochim. Cosmochim. Acta 62, 2025–2038.
13. Gillot, P. Y., Labeyrie, J., Laj, C., Gue´rin, G., Poupeau, G. & Delibrias, G. (1979) Earth Planet. Sci. Lett. 42, 444–450.
14. Imbrie, J., Hays, J. D., Martinson, D. G., McIntyre, A., Mix, A. C., Morley, J. J., Pisias, N. G., Prell, W. L. & Shackleton, N. J. (1984) in Milankovitch and
Climate, ed. Berger, A. L. (D. Reidel, Dordrecht, The Netherlands), Vol. 1, pp.
269–305.
15. Lynch-Steiglitz, J., Stocker, T. F., Broecker, W. S. & Fairbanks, R. G. (1995)
Global Biogeochem. Cycles 9, 653–665.
16. Berger, W. H. & Vincent, E. (1986) Geol. Rundsch. 75, 249–269. 17. Wignall, P. B. (2001) Earth Sci. Rev. 53, 1–33.
18. Yang, C., Telmer, K. & Veizer, J. (1996) Geochim. Cosmochim. Acta 60, 851–866.
19. Schoell, M. (1988) Chem. Geol. 71, 1–10.
20. Stott, L. D., Bunn, T., Prokopenko, M., Mahn, C., Gieskes, J. & Bernhard, J. M. (2002) Geochem. Geophys. Geosyst. 3, 1–16.
21. Kvenvolden, K. A. (1995) Org. Geochem. 23, 997–1008. 22. Schrag, D. P. & DePaolo, D. J. (1993) Paleoceanography 8, 1–6.
23. Matsumoto, R. & Borowski, W. S. (2000) in Proceedings of the Ocean Drilling
Program, eds. Paull, C. K., Matsumoto, R., Wallace, P. J. & Dillon, W. P.
(Ocean Drilling Program, College Station, TX), Vol. 164, pp. 59–66.
24. Cifelli, R. (1982) Smithson. Contrib. Paleobiol. 45, 1–45.
25. Torres, M. E., Mix, A. C., Kinports, K., Haley, B., Klinkhammer, G. P., McManus, J. & de Angelis, M. A. (2003) Paleoceanography 18, 10.129兾 2002PA000824.
26. Greinert, J. (1999) in GEOMAR (Christian-Albrechts University, Kiel, Ger-many), pp. 217.
27. Kvenvolden, K. A. (1988) Global Biogeochem. Cycles 2, 221–229.
28. Yokoyama, Y., Esat, T. M. & Lambeck, K. (2001) Earth Planet. Sci. Lett. 193, 579–587.
29. Nisbet, E. G. (1992) J. Geophys. Res. 97, 12859–12867. 30. Buffett, B. A. (2000) Annu. Rev. Earth Planet. Sci. 28, 477–507. 31. Munk, W. & Wunsch, C. (1998) Deep-Sea Res. Part I 45, 1977–2010. 32. Leifer, I., Clark, J. F. & Chen, R. B. (2000) Geophys. Res. Lett. 27, 3711–
3714.
33. Zhang, J. & Quay, P. D. (1997) Deep-Sea Res. Part II 44, 2163–2190. 34. Houghton, J. T., Ding, Y., Griggs, D. J., Noguer, M., van der Linden, P. J. &
Xiaosu, D. (2001) Climate Change, 2001: The Scientific Basis—Contribution of
Working Group I to the Third Assessment Report of the Intergovernmental Panel on Climate Change (IPCC) (Cambridge Univ. Press, Cambridge, U.K.).
35. Blunier, T. & Brook, E. J. (2001) Science 291, 109–112.
36. Hardjono, Asikin, T. S., Purnomo, J. & Rau, J. L. e. (1998) Thirty-Third Annual
Session of the Coordinating Committee for Coastal and Offshore Geoscience Programmes in East and Southeast Asia 33, Part II, 56–83.
37. Neben, S., Hinz, K. & Beiersdorf, H. (1998) in Gas Hydrates—Relevance to
World Margin Stability and Climatic Change, eds. Henriet, J.-P. & Mienert, J.
(The Geological Society, London), Vol. 137, pp. 255–265.
38. Dansgaard, W., Johnsen, S. J., Clausen, H. B., Dahl-Jensen, D., Gundestrup, N. S., Hammer, C. U., Hvidberg, C. S., Steffensen, J. P., Sveinbjo¨rnsdottir, A. E., Jouzel, J., et al. (1993) Nature 364, 218–220.