HAL Id: hal-01270897
https://hal.sorbonne-universite.fr/hal-01270897
Submitted on 9 Feb 2016
HAL is a multi-disciplinary open access
archive for the deposit and dissemination of
sci-entific research documents, whether they are
pub-lished or not. The documents may come from
teaching and research institutions in France or
abroad, or from public or private research centers.
L’archive ouverte pluridisciplinaire HAL, est
destinée au dépôt et à la diffusion de documents
scientifiques de niveau recherche, publiés ou non,
émanant des établissements d’enseignement et de
recherche français ou étrangers, des laboratoires
publics ou privés.
Distributed under a Creative Commons Attribution| 4.0 International License
Sebastien Chastin, Christoph Buck, Ellen Freiberger, Marie Murphy, Johannes
Brug, Greet Cardon, Grainne O ’Donoghue, Iris Pigeot, Jean-Michel Oppert
To cite this version:
Sebastien Chastin, Christoph Buck, Ellen Freiberger, Marie Murphy, Johannes Brug, et al..
Sys-tematic literature review of determinants of sedentary behaviour in older adults: a DEDIPAC study.
International Journal of Behavioral Nutrition and Physical Activity, BioMed Central, 2015, 12, pp.127.
�10.1186/s12966-015-0292-3�. �hal-01270897�
R E V I E W
Open Access
Systematic literature review of
determinants of sedentary behaviour in
older adults: a DEDIPAC study
Sebastien F M Chastin
1*, Christoph Buck
2, Ellen Freiberger
3, Marie Murphy
4, Johannes Brug
5, Greet Cardon
6,
Grainne O
’Donoghue
7, Iris Pigeot
2, Jean-Michel Oppert
8and on behalf of the DEDIPAC consortium
Abstract
Background: Older adults are the most sedentary segment of society and high sedentary time is associated with poor health and wellbeing outcomes in this population. Identifying determinants of sedentary behaviour is a necessary step to develop interventions to reduce sedentary time.
Methods: A systematic literature review was conducted to identify factors associated with sedentary behaviour in older adults. Pubmed, Embase, CINAHL, PsycINFO and Web of Science were searched for articles published between 2000 and May 2014. The search strategy was based on four key elements: (a) sedentary behaviour and its synonyms; (b) determinants and its synonyms (e.g. correlates, factors); (c) types of sedentary behaviour (e.g. TV viewing, sitting, gaming) and (d) types of determinants (e.g. environmental, behavioural). Articles were included in the review if specific information about sedentary behaviour in older adults was reported. Studies on samples identified by disease were excluded. Study quality was rated by means of QUALSYST. The full review protocol is available from PROSPERO (PROSPERO 2014: CRD42014009823). The analysis was guided by the socio-ecological model framework.
Results: Twenty-two original studies were identified out of 4472 returned by the systematic search. These included 19 cross-sectional, 2 longitudinal and 1 qualitative studies, all published after 2011. Half of the studies were
European. The study quality was generally high with a median of 82 % (IQR 69–96 %) using Qualsyst tool. Personal factors were the most frequently investigated with consistent positive association for age, negative for retirement, obesity and health status. Only four studies considered environmental determinants suggesting possible association with mode of transport, type of housing, cultural opportunities and neighbourhood safety and availability of places to rest. Only two studies investigated mediating factors. Very limited information was available on contexts and sub-domains of sedentary behaviours.
Conclusion: Few studies have investigated determinants of sedentary behaviour in older adults and these have to date mostly focussed on personal factors, and qualitative studies were mostly lacking. More longitudinal studies are needed as well as inclusion of a broader range of personal and contextual potential determinants towards a systems-based approach, and future studies should be more informed by qualitative work.
Keywords: Sitting, Sedentary behaviour, Determinants, Older adults, Ageing, Life-course, Obesity, System-based approach, Physical activity, Environment
* Correspondence:Sebastien.Chastin@gcu.ac.uk
1
Institute of Applied Health Research, School of Health and Life Science, Glasgow Caledonian University, Glasgow, UK
Full list of author information is available at the end of the article
© 2015 Chastin et al. Open Access This article is distributed under the terms of the Creative Commons Attribution 4.0 International License (http://creativecommons.org/licenses/by/4.0/), which permits unrestricted use, distribution, and reproduction in any medium, provided you give appropriate credit to the original author(s) and the source, provide a link to the Creative Commons license, and indicate if changes were made. The Creative Commons Public Domain Dedication waiver (http://creativecommons.org/publicdomain/zero/1.0/) applies to the data made available in this article, unless otherwise stated.
Introduction
Too much sitting in particular when accumulated in long uninterrupted bouts is associated with detrimental effects on health and wellbeing, a large number of chronic diseases and all-cause mortality [1–3]. Older adults are the most sedentary segment of society. Seden-tary time represents on average 65–80 % of an older adult waking day [4] and over 70 % of older adults spent in excess of 8.5 h per day sitting [5]. This puts older adults specifically at risk of the ill-effects of sedentary behaviour. Indeed, in older adults, sedentary time has been found to be associated with cardiovascular disease [6], frailty, disablement, social isolation [7] and less suc-cessful ageing [8]. As the older adult population has increased substantially globally, and it is estimated to reach approximately 22 % of the world’s population by 2050 [9], the public health burden associated with sed-entary behaviour is therefore emerging as an important public health concern [7].
Several countries have issued recommendations to reduce sitting time as part of their national physical activity guidelines for older adults [10]. The challenge is to understand and be able to act upon the most ef-fective ways to improve public and individual’s health through interventions and campaigns targeting motiv-ation, ability and opportunity to maintain sedentary time within healthy limits. Identifying determinants of sedentary behaviour and in particular those that are modifiable is a necessary step to develop effective interventions and public health campaigns targeted at reducing sedentary time. This systematic review is one of three reviews which are part of the work per-formed on sedentary behaviour across the lifecourse in the DEDIPAC study [11]. The aim of this review was to synthesize the current evidence base on the determinants of sedentary behaviour specifically in the older adult’s population.
The current dominant thinking is that determinants of sedentary behaviour can be conceptualised in models such as the ecological model which place the individual within an ecosystem [12, 13] or frameworks that depict the interaction between factors proximal to the individ-ual (biology, psychology, social factors) and distal factors such as environmental, economic, political and socio-economic factors [14]. The secondary aim of this review was to map the current evidence base and knowledge gaps onto these frameworks.
Review
A common protocol for the three DEDIPAC systematic reviews across the life course (youth, adults, older adults) was developed and is available from PROSPERO (PROS-PERO 2014: CRD42014009823).
Search strategy
The literature search was performed in August 2014 in five electronic databases (Pubmed, Embase, CINAHL with full text, PsycINFO and Web of Science).
The search strategy was based on search terms within four key elements: (a) sedentary behaviour and its nyms (e.g. sedentariness); (b) determinants and its syno-nyms (e.g. correlates, factors); (c) types of sedentary behaviour (e.g. TV viewing, gaming) and (d) possible determinants of sedentary behaviour (e.g. environmental, behavioural). Terms referring to these four elements were used as MESH-headings and title or abstract words in all databases. The complete list of search terms is shown in Additional file 1: Table S1. In addition, the reference lists of all included articles were scanned for articles that met the inclusion criteria.
Selection of studies
To be included in the review, articles had to be pub-lished in English l and pubpub-lished between January 2000 and 1st of May 2014. The following study designs were eligible for inclusion; observational studies (cross sec-tional, case control and prospective), experimental stud-ies (randomized controlled trials, quasi-experimental trials) and qualitative studies. These had to provide information about sedentary time and associated factors for participants aged 65 and over. Articles were included if they measured one or more of the following; total sedentary or sitting time (e.g. minutes per day) or time spent in one or more of the following specific domains of sedentary behaviour; time spent watching TV, screen time, occupational sitting time or motorized transport time. Both objective and subjective measurement out-comes were included. Articles which recruited only specific patient groups or samples identified by diseases were excluded.
The study selection process consisted of three phases: In the initial phase, two reviewers (SC and EF) independ-ently screened articles based on title. In the case of doubt or disagreements, the articles were included in the abstract review phase. In phase two, the abstracts of all articles selected from the initial phase were reviewed and assessed by two independent reviewers (JMO, CB). Any disagreement was resolved by the third reviewer (SC). In the final phase, the remaining articles were fully reviewed by two teams of two reviewers (SC, EF and JMO, CB) using the pre-determined inclusion criteria, and assessed by two independent researchers. Any disagreement between reviewers was solved by discussion in the wider team.
Data extraction
A standardized template was used to extract data from the included studies using the following heading; General
Information - title of article, main author and publication year, sample characteristics, study characteristics, meas-urement of sedentary behaviour and determinants, statis-tical methods and main results. The four reviewers involved in article selection, extracted data independently (SC,EF and JMO,CB). A quality assurance process enabled cross checking of the data extraction. Discrepancies were resolved through discussion.
Quality assessment
The quality assessment tool employed was the QUAL-SYST from the “Standard Quality Assessment Criteria for Evaluating Primary Research Papers from a Variety of Fields” (Alberta Heritage Foundation for Medical Research). This pragmatic tool incorporates two scoring systems, allowing quality assessment to be conducted on both quantitative and qualitative research [15]. The Qualsyst score is based on eight criteria such as appro-priate study design and research question, definition of outcomes and exposures, reporting of bias and con-founding, and sufficient reporting of results and limita-tions. Criteria can be answered as ‘yes’ (2), ‘partial’ (1), ‘no’ (0), and ‘NA’. The Qualsyst score is calculated as sum of ratings of applicable criteria divided by the max-imum scores of applicable criteria.
The four reviewers involved in articles selection and data extraction, assessed quality independently (SC, EF and JMO, CB). A quality assurance process enabled cross checking of quality assessment. Discrepancies were resolved through discussion. Articles were not selected based on a threshold of the Qualsyst score.
Results
Searches of the five databases (Pubmed, Embase, CINAHL with full text, PsycINFO and Web of Science) yielded 4472 records. After duplicates were removed 4050 titles and abstracts were screened against the inclu-sion criteria. 3877 were excluded for the following reasons; relevance (2780) exercise interventions (108) did not include older adults (327) measured inactivity rather than sedentary behaviour (341) were conducted in special populations (318) or were incorrect records (3). 171 full-text articles were assessed for eligibility with 22 studies meeting the inclusion criteria. Figure 1 illustrates selection of studies from search to inclusion. Table 1 provides an overview of the main characteristics of the studies included.
Three of the studies were conducted in North America, 12 in Europe (6 in the UK), five in Asia and two in Australia. The majority of studies employed a cross-sectional design (19) with two prospective co-hort studies and one qualitative study.
Number and range of participants
Participant numbers ranged from nine in a small qualita-tive study Chastin et al. [29, 36] to over 460,000 in a cross-sectional study Du et al. [32] and included male and female participants. Most studies used samples of convenience with only one study Ku et al. [24] reporting on a nationally representative sample. Participants were included from a range of SES but tended to be of higher SES and higher educational background. Similarly partici-pants tended to be from urban environments and while they were from a range of ethnicity but no study specific-ally looked at ethnic minorities. Participants were mostly healthy and community dwelling older adults, however, medical conditions were never mentioned as an exclusion criteria and the samples are therefore likely to include par-ticipants with pre-existing morbidities.
Quality of studies
Quality scores, expressed as percentage of maximum quality score, ranged from 46–96 % are presented in Table 1.
Measurement of sedentary behaviour
Studies included in the review used objective (n = 8) (3 activPAL inclinometer, 5 accelerometer) or subjective (self report; n = 14) measures of sedentary time. Several studies used proxy self-report measures of sedentary be-haviour, including TV or screen viewing (n = 4), leisure
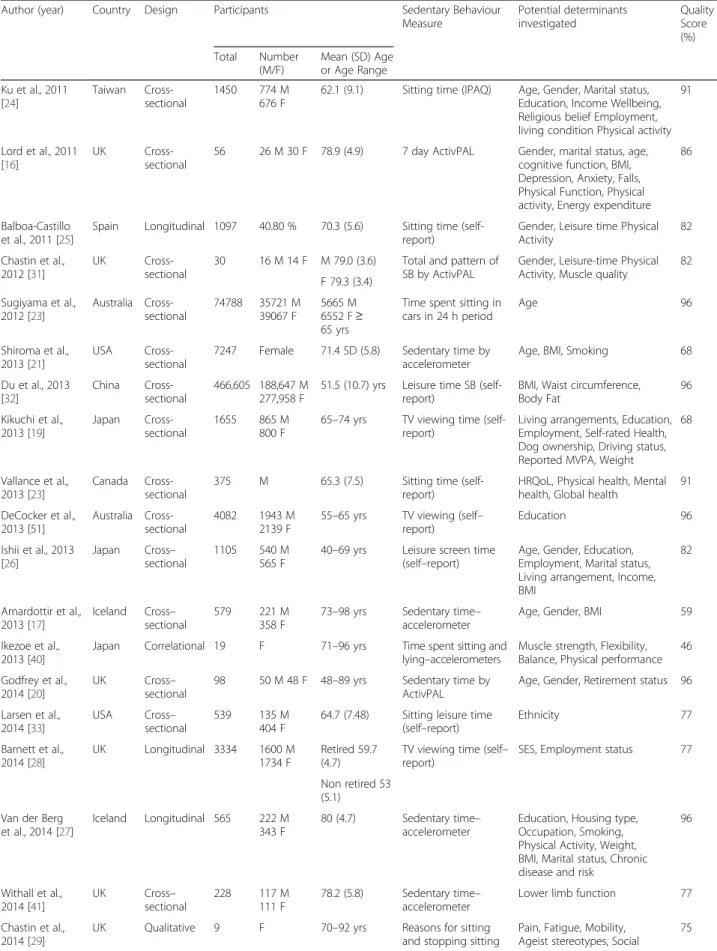
Table 1 Characteristics of studies on determinants of sedentary behaviour in older adults
Author (year) Country Design Participants Sedentary Behaviour Measure Potential determinants investigated Quality Score (%) Total Number (M/F) Mean (SD) Age or Age Range Ku et al., 2011 [24] Taiwan Cross-sectional 1450 774 M 676 F
62.1 (9.1) Sitting time (IPAQ) Age, Gender, Marital status, Education, Income Wellbeing, Religious belief Employment, living condition Physical activity
91
Lord et al., 2011 [16]
UK Cross-sectional
56 26 M 30 F 78.9 (4.9) 7 day ActivPAL Gender, marital status, age, cognitive function, BMI, Depression, Anxiety, Falls, Physical Function, Physical activity, Energy expenditure
86
Balboa-Castillo et al., 2011 [25]
Spain Longitudinal 1097 40.80 % 70.3 (5.6) Sitting time (self-report)
Gender, Leisure time Physical Activity 82 Chastin et al., 2012 [31] UK Cross-sectional
30 16 M 14 F M 79.0 (3.6) Total and pattern of SB by ActivPAL
Gender, Leisure-time Physical Activity, Muscle quality
82 F 79.3 (3.4) Sugiyama et al., 2012 [23] Australia Cross-sectional 74788 35721 M 39067 F 5665 M 6552 F≥ 65 yrs
Time spent sitting in cars in 24 h period Age 96 Shiroma et al., 2013 [21] USA Cross-sectional
7247 Female 71.4 SD (5.8) Sedentary time by accelerometer
Age, BMI, Smoking 68 Du et al., 2013 [32] China Cross-sectional 466,605 188,647 M 277,958 F
51.5 (10.7) yrs Leisure time SB (self-report)
BMI, Waist circumference, Body Fat 96 Kikuchi et al., 2013 [19] Japan Cross-sectional 1655 865 M 800 F
65–74 yrs TV viewing time (self-report)
Living arrangements, Education, Employment, Self-rated Health, Dog ownership, Driving status, Reported MVPA, Weight
68
Vallance et al., 2013 [23]
Canada Cross-sectional
375 M 65.3 (7.5) Sitting time (self-report)
HRQoL, Physical health, Mental health, Global health
91 DeCocker et al., 2013 [51] Australia Cross-sectional 4082 1943 M 2139 F
55–65 yrs TV viewing (self– report) Education 96 Ishii et al., 2013 [26] Japan Cross– sectional 1105 540 M 565 F
40–69 yrs Leisure screen time (self–report)
Age, Gender, Education, Employment, Marital status, Living arrangement, Income, BMI 82 Arnardottir et al., 2013 [17] Iceland Cross– sectional 579 221 M 358 F
73–98 yrs Sedentary time– accelerometer
Age, Gender, BMI 59 Ikezoe et al.,
2013 [40]
Japan Correlational 19 F 71–96 yrs Time spent sitting and lying–accelerometers
Muscle strength, Flexibility, Balance, Physical performance
46 Godfrey et al.,
2014 [20]
UK Cross– sectional
98 50 M 48 F 48–89 yrs Sedentary time by ActivPAL
Age, Gender, Retirement status 96 Larsen et al., 2014 [33] USA Cross– sectional 539 135 M 404 F
64.7 (7.48) Sitting leisure time (self–report) Ethnicity 77 Barnett et al., 2014 [28] UK Longitudinal 3334 1600 M 1734 F Retired 59.7 (4.7)
TV viewing time (self– report)
SES, Employment status 77 Non retired 53
(5.1) Van der Berg
et al., 2014 [27]
Iceland Longitudinal 565 222 M 343 F
80 (4.7) Sedentary time– accelerometer
Education, Housing type, Occupation, Smoking, Physical Activity, Weight, BMI, Marital status, Chronic disease and risk
96 Withall et al., 2014 [41] UK Cross– sectional 228 117 M 111 F 78.2 (5.8) Sedentary time– accelerometer
Lower limb function 77 Chastin et al.,
2014 [29]
UK Qualitative 9 F 70–92 yrs Reasons for sitting and stopping sitting
Pain, Fatigue, Mobility, Ageist stereotypes, Social
time sitting, (n = 2) sitting in a car (n = 1) Sugiyama et al. [23].
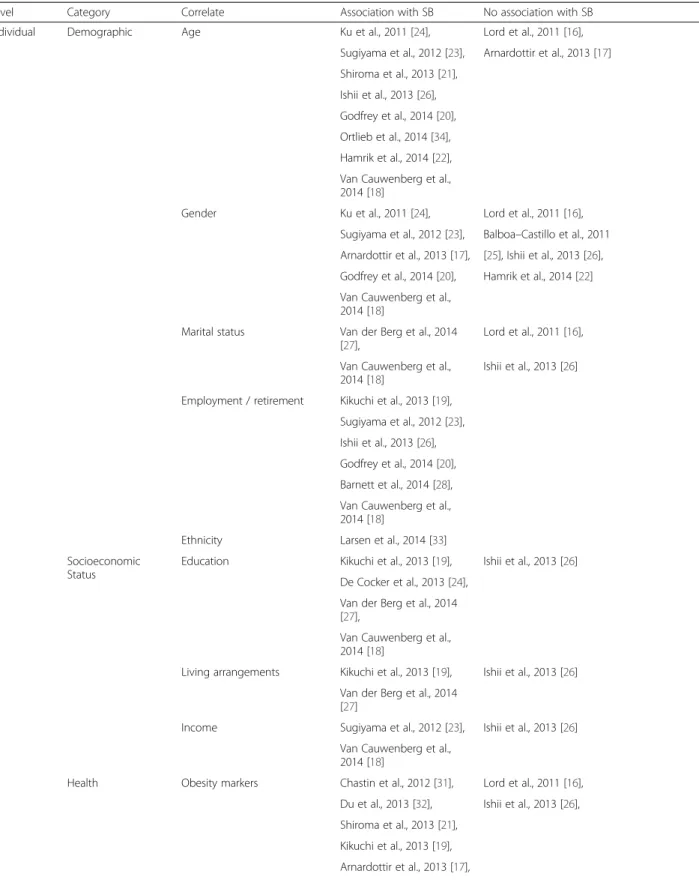
Table 2 provides a summary of correlates identified by the selected studies mapped onto Owen’s ecological model. These are discussed in detail below.
Individual factors Age
Ten studies examined the association between age and sedentary behaviour. All but two of these studies [16, 17] noted a significant effect of age. van Cauwenberg et al. [18] reported lower TV viewing time by 0.5 min per day for every year after the age of 65. Kikuchi et al. [19] also observed that older adults aged over 70 were less likely to watch TV compared to those aged less than 70 (−0.11 dif-ference in odd ratio). Godfrey et al. et al. [20] reported non-linear association with age, sedentary time was higher by 5 % at 70 years of age but similar at 80 years compared to 65. Shiroma et al., 2013 [21] also observed around 5 % increase in total daily sedentary time per year after the age of 65. Compared to adults Hamrik [22] reported higher sedentary time in older adults (1 h per day). Finally Sugi-yama et al., 2012 [23] estimated that older adults spend half the time sitting in cars compared to adults aged be-tween 55–65 years.
Sex
Nine studies considered the association between sex and sedentary behaviour with five reporting an associ-ation [17, 18, 20, 23, 24] and four failing to note any as-sociation [16, 22, 25, 26]. Ku and colleagues [24] and Arnardottir et al. [17] found that males were more sed-entary than females. van Cauwenberg et al. [18] found a statistical significant but trivial difference in TV viewing with men reporting 2.9 mins less viewing per day, but Kikuchi et al. [19] reported that men are 21 % more likely to watch TV compared to female. Godfrey et al. [20] found no significant association between gender
and total sedentary time but patterns of accumulation of SB differed by gender.
Marital status
The association of marital status with sedentary behav-iour was equally inconsistent. In a cross-sectional study by Van Der Berg et al. [27], unmarried older adults had higher levels (15.3 mins per day more) of self-reported and objectively measured sedentary behaviour than their married counterparts. This is partially supported by the findings of Van Cauwenberg et al. [18] who reported the highest levels of sedentary behaviour determined by self-reported time spent viewing TV among widows and widowers compared to those who had never married/di-vorced or were married/cohabiting (6.5 mins per day and 11 mins per day less respectively compared to widowed individuals). However, two studies failed to find a significant association between marital status and sed-entary behaviour [16, 26].
Employment and retirement status
Employment status showed significant associations with sedentary behaviour in four studies included in this review [19, 20, 27, 28]. Not being in full-time employment (≥35 h per week) almost double the odd ratio of watching TV according to Kikuchi et al. [19]. Mid-life occupation is also associated with sedentary time in old age [27]. Barnett et al. estimated that retirement is associated with higher TV viewing time by 2.6 h per week in white-collars and 3.9 for manual workers [28]. By contrast Godfrey and col-leagues [20] reported lower levels of sedentary time in unemployed compared to employed older adults, largely attributable to a greater number of longer bouts of seden-tary behaviour among those who were in employment. Similarly van Cauwenberg et al. [18] estimated that having an occupational function through volunteering was associ-ated with almost 15 min less TV time per day. This is con-sistent with qualitative evidence [29].
Table 1 Characteristics of studies on determinants of sedentary behaviour in older adults (Continued)
support/attitudes, Lack of resting places Ortlieb et al., 2014 [52] Germany Cross– sectional 191 78 M 113 F
65–89 yrs Total sedentary time (self–report) Age 59 Hamrik et al., 2014 [22] Czech Republic Cross– sectional 1753 Mixed (48.4 % men) 18–90, 18 % >65
Minutes sitting per day (self–report)
Age, Gender 68 Van Cauwenberg et al., 2013 [18] Belgium Cross– sectional 50,986 22,842 M 28,144 F
≥65 years TV viewing time (self– report)
Age, Gender, Education, Income, Marital status, Walking or Cycling, Functional limitations, Interpersonal relationships. Place attachment, Social participation, Access to and perceived distance of facilities
Table 2 Mapping of the results of the 22 studies onto the ecological model per level and categories and according on whether or not a significant association was found
Level Category Correlate Association with SB No association with SB Individual Demographic Age Ku et al., 2011 [24], Lord et al., 2011 [16],
Sugiyama et al., 2012 [23], Arnardottir et al., 2013 [17] Shiroma et al., 2013 [21],
Ishii et al., 2013 [26], Godfrey et al., 2014 [20], Ortlieb et al., 2014 [34], Hamrik et al., 2014 [22], Van Cauwenberg et al., 2014 [18]
Gender Ku et al., 2011 [24], Lord et al., 2011 [16], Sugiyama et al., 2012 [23], Balboa–Castillo et al., 2011 Arnardottir et al., 2013 [17], [25], Ishii et al., 2013 [26], Godfrey et al., 2014 [20], Hamrik et al., 2014 [22] Van Cauwenberg et al.,
2014 [18]
Marital status Van der Berg et al., 2014 [27],
Lord et al., 2011 [16], Van Cauwenberg et al.,
2014 [18]
Ishii et al., 2013 [26] Employment / retirement Kikuchi et al., 2013 [19],
Sugiyama et al., 2012 [23], Ishii et al., 2013 [26], Godfrey et al., 2014 [20], Barnett et al., 2014 [28], Van Cauwenberg et al., 2014 [18]
Ethnicity Larsen et al., 2014 [33] Socioeconomic
Status
Education Kikuchi et al., 2013 [19], Ishii et al., 2013 [26] De Cocker et al., 2013 [24],
Van der Berg et al., 2014 [27],
Van Cauwenberg et al., 2014 [18]
Living arrangements Kikuchi et al., 2013 [19], Ishii et al., 2013 [26] Van der Berg et al., 2014
[27]
Income Sugiyama et al., 2012 [23], Ishii et al., 2013 [26] Van Cauwenberg et al.,
2014 [18]
Health Obesity markers Chastin et al., 2012 [31], Lord et al., 2011 [16], Du et al., 2013 [32], Ishii et al., 2013 [26], Shiroma et al., 2013 [21],
Kikuchi et al., 2013 [19], Arnardottir et al., 2013 [17], Larsen et al., 2014 [33],
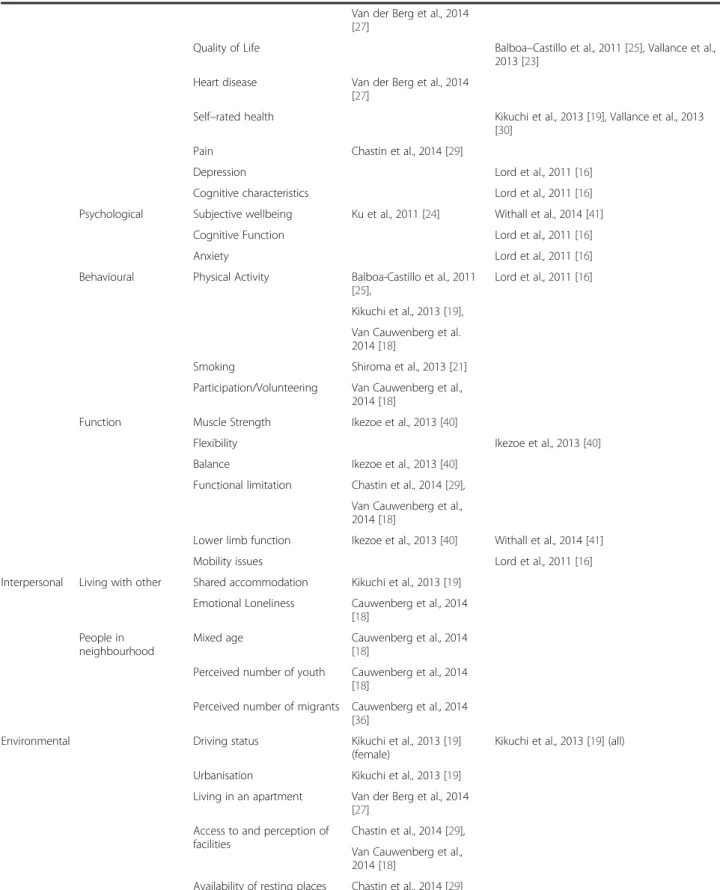
Table 2 Mapping of the results of the 22 studies onto the ecological model per level and categories and according on whether or not a significant association was found (Continued)
Van der Berg et al., 2014 [27]
Quality of Life Balboa–Castillo et al., 2011 [25], Vallance et al., 2013 [23]
Heart disease Van der Berg et al., 2014 [27]
Self–rated health Kikuchi et al., 2013 [19], Vallance et al., 2013 [30]
Pain Chastin et al., 2014 [29]
Depression Lord et al., 2011 [16] Cognitive characteristics Lord et al., 2011 [16] Psychological Subjective wellbeing Ku et al., 2011 [24] Withall et al., 2014 [41]
Cognitive Function Lord et al., 2011 [16] Anxiety Lord et al., 2011 [16] Behavioural Physical Activity Balboa-Castillo et al., 2011
[25],
Lord et al., 2011 [16] Kikuchi et al., 2013 [19],
Van Cauwenberg et al. 2014 [18]
Smoking Shiroma et al., 2013 [21] Participation/Volunteering Van Cauwenberg et al.,
2014 [18]
Function Muscle Strength Ikezoe et al., 2013 [40]
Flexibility Ikezoe et al., 2013 [40] Balance Ikezoe et al., 2013 [40]
Functional limitation Chastin et al., 2014 [29], Van Cauwenberg et al., 2014 [18]
Lower limb function Ikezoe et al., 2013 [40] Withall et al., 2014 [41] Mobility issues Lord et al., 2011 [16] Interpersonal Living with other Shared accommodation Kikuchi et al., 2013 [19]
Emotional Loneliness Cauwenberg et al., 2014 [18]
People in neighbourhood
Mixed age Cauwenberg et al., 2014 [18]
Perceived number of youth Cauwenberg et al., 2014 [18]
Perceived number of migrants Cauwenberg et al., 2014 [36]
Environmental Driving status Kikuchi et al., 2013 [19] (female)
Kikuchi et al., 2013 [19] (all) Urbanisation Kikuchi et al., 2013 [19]
Living in an apartment Van der Berg et al., 2014 [27]
Access to and perception of facilities
Chastin et al., 2014 [29], Van Cauwenberg et al., 2014 [18]
Educational attainment
Four of the five studies that considered educational attainment found a significant inverse association be-tween level of education and time spent in sedentary behaviours (Table 2) . Estimated effect size reported were 42 min less per day for those with higher education level [18] or 37 % [19] increase in odd ratio for TV time for those with less than university. Ishii et al. [26] did not report a significant association between educational attainments and time spent in sedentary behaviour in Japanese older adults.
Health
Eleven of the studies included in this review reported on the relationship between health and sedentary behaviour (Table 2). The majority (n = 8) reported inverse associa-tions between a measure of health (psychological, behav-ioural or functional) and sedentary time. After controlling for socio-demographic factors Ku et al. [24] found an inverse correlation between self-reported sedentary behav-iour and subjective well-being with those reporting less sedentary time having higher levels of well-being. This finding was reported by Vallance and colleagues [30] for weekend days but not weekdays with those with the low-est levels of sitting reporting better physical mental and global health than those reporting most sitting at week-ends. Seven studies that considered the relationship between sedentary behaviour and obesity found that obese adults reported greater levels of objectively measured [17, 21, 31] and self-reported [27, 32, 33] sedentary behav-iour or TV viewing [19]. Estimated effect size reported were 2.5 % [21] and 3.5 % [27] more sedentary time and 50 % higher odd ratio of TV time [19] for obese individ-uals. van Der Berg et al. [27] is the only study which inves-tigated mid-life health and found that cardiovascular disease have the strongest effect associated with around 7 % higher sedentary time in older age.
The only qualitative study to explore individual reasons for sitting reported physical health problems including pain felt in the standing position, fatigue experienced while standing and functional limitations as the most important reasons for sitting time (Chastin et al. [29, 36].
Two studies showed no association between sedentary behaviour and aspects of self-reported health. Lord et al. [16] found no association between objectively measured sedentary behaviour and self-reported depression, anx-iety of cognitive function and Kikuchi et al. [19] found no association between self-reported TV viewing time and self-rated health.
Interpersonal factors
Only two studies considered interpersonal factors (Table 2). Loneliness was reported as associated with around 2 extra minutes per day of TV time [18] and living alone increase
the odd ratio for TV time by 26 % compared to living in shared accommodation [19]. The perception in living in a neighbourhood with not too many older adults but not too many youth or migrant was reported as associated with 5 to 8 min less TV time per day [18].
Environmental factors
Four of the studies included in this review considered the relationship between environmental factors and sed-entary behaviour (Table 2). Kikuchi et al. [19] reported 48 % higher odd ratio for TV time for older adults living in rural area compared to those living in urban settings. On the contrary, the larger study by van Cauwenberg et al. [18] reported 10 min per day higher TV time in urban compared to rural area. In the same study of almost 51,000 Belgian adults it was estimated that the presence of cultural facilities or green spaces in the neighbourhood was associated with less TV viewing by 3 and 3.5 min per day respectively, while perceptions that the environment was unsafe was associated with 3.5 min per day more TV viewing. Living in an apartment or a duplex was associated with 2 % higher levels of object-ively measures sedentary behaviour than living in villa our house [18]. When asked about their reasons for sitting, individuals in the study by Chastin et al. [29] reported that a lack of facilities for stimulation and a lack of resting places in the environment encouraged more sitting.
Discussion
The aim of this review was to summarise current evidence on potential determinants –correlates and predictors- of sedentary behaviour in older adults. With respect to the upcoming challenge to increase public health by reducing sedentary behaviour [7] the knowledge about the determi-nants of sedentary behaviour will be an important first step for the development of effective strategies. The het-erogeneity of these studies in terms of design, samples and measurement methods prevented any form of quantitative synthesis. Therefore this review took a narrative approach informed by a quality assessment with a tool that allows comparison across different type of studies.
To date very few studies have investigated factors which are associated with and may influence sitting time in older adults. The 22 studies included in this review actually provide the sum of total evidence at hand. The current evidence base is therefore extremely limited. This might reflect a lack of interest in this population group [34]. However sedentary behaviour research is a relatively new field, and the oldest study in this review was published only four years ago, which suggest that more studies will be published in the years to come. All the 22 studies were carried out in high income coun-tries. Half of the studies were European, of which half
were conducted in the UK. This reflects Europe’s leading role in this domain of research and underscores the value of harmonising European research [11], but also indicates the dearth of information in low and middle income countries.
Within the existing literature, there is extremely limited causal evidence as the vast majority of information comes from quantitative cross-sectional studies, with only two longitudinal studies and one qualitative study available. Consequently, the current evidence base is merely about factors associated or correlated with sedentary time rather than actual determinants per se and little is known about causes of change of sedentary behaviour over time.
Analytically, studies focused mainly on the association between sedentary time and factors through correlation analysis or linear modelling. Only two studies [16, 31] in-vestigated how factors influence the dynamics of sedentary behaviour and how sedentary time is accumulated. Some, for example Barnett et al. [28], investigated the influence of mediators such as socio-economic status, but generally few studies attempted to understand the relationship between factors. This is at odds with current theoretical thinking and frameworks about determinants of healthy lifestyles [13, 14] which point to a complex interplay between proximal and distal factors.
Self-reported measures of sedentary time are easy to administer, inexpensive, do not alter habitual behaviour and are therefore well-suited for large-scale investigations [35]. However, they notoriously underestimate sedentary time but more importantly this error is relative and tends to grow with the amount of time respondents spend sitting [36]. Consequently, association with self-reported measures are distorted [37]. It is therefore reassuring that over one third of the studies used objective means of measuring sedentary time. However there are notable dif-ferences amongst objective measures. Only three studies used an inclinometer [20, 31, 38] which directly measure sitting and which has been specifically validated in older adults [39]. Five other studies used accelerometers [17, 21, 27, 40, 41] not specifically validated in this population and which are also known to underestimate sedentary time [42]. One major limitation of objective measures such as inclinometers and accelerometers is that they do not pro-vide contextual information for which context specific questionnaires remain of great help. Importantly, none of the studies combined both objective and self-reported measures as recommended to assess specific domains of sedentary behaviour [35, 43]. Self-reported measures were used to describe sedentary behaviour in four domains de-fined by the recent taxonomy of sedentary behaviour [43]; leisure time sitting (S8N50), TV viewing (S8Ys5N50), leis-ure screen time (S8YsN50) and sitting in cars (S712N50). No study deployed objective or subjective means of asses-sing the context of sedentary behaviour, currently seen as
important [44, 45] for understanding the role played by social and physical environmental factors in determining this behaviour.
The evidence currently available might be limited but seems trustworthy as it generally comes from high qual-ity studies. The median qualqual-ity score was 82 % with an inter-quantile range of 46 to 96 %. A main common feature of the lowest quality studies was that they tended to be secondary data analyses of studies not specifically designed to investigate determinants of sedentary behav-iour. Consequently, these often rated low in terms of analysis and in particular regarding the way they con-trolled for potential confounders. In contrast, studies rated highest were either specifically designed to investi-gate the determinants of sedentary behaviour or focused their analysis on the association between a single factor and a specific domain of sedentary behaviour. Sample size did not appear to be a determining feature of quality as a number of smaller size studies which were well designed and provided more focused analysis rated higher than some large scale epidemiological studies.
Determinants examined in the articles included in this review were mostly personal factors and information was scarce on other levels of determinants. This means that we currently lack key information about distal determinants of SB in older subjects. Importantly most potential determinants investigated are easy to measure but not modifiable, thus providing little information for intervention studies. In addition, for a number of factors studied the relationship with sedentary behaviour was different depending if sub-domains or total sedentary behaviour time was assessed. This suggests that determi-nants might be different or have different relationship for different domains of sedentary behaviour. Unfortunately, none of the studies included assessment of several sub-domains. Therefore, potentially important levers for inter-ventions aiming to reduce sedentary behaviour in this specific age group remain difficult to identify at this stage of research.
Among possible determinants assessed, age stands out as the most frequently studied. It was also the potential determinant most frequently associated with sedentary time. In general, age was positively related to increased sedentary behaviour, whether self-reported or measured objectively, and in different countries or regions. Educa-tion was also a consistent correlate of sedentary behaviour, with an inverse association in European populations but not in studies from Asia, suggesting a possible cultural factor.
Not being in full employment, being unemployed or retired, was associated with increased sedentary behaviour in reviewed articles. This is also supported by qualitative evidence [29] and results from the largest study in the review [18], which suggests that maintaining an activity or
a social role after retirement leads to spend less time sitting. Two papers specifically addressed retirement, one based on screen (or TV) time [28] and the other on ob-jectively sedentary time [20]. The transition to retirement is considered as a major life event in terms of financial as well as behavioural modification, including important changes in sedentary and physical activity behaviours [46, 47]. Retirement leads to a decrease in time con-straints possibly corresponding to more free-time available, providing new daily routines and social in-teractions Barnett et al. [28]. Interestingly, Barnett et al. [28] reported that the largest increase in TV viewing with retirement was observed among manual social classes. This emphasizes the importance of socioeconomic status in midlife for the prediction of sedentary behaviour in old age.
Better health status and lower values for obesity indi-cators were consistently associated with decreased sed-entary time. Interestingly, in the study by Van der Berg et al. [27], a temporal relationship was observed with obesity during midlife and objectively measured seden-tary behaviour in old age. This suggests that obesity might be a determinant rather than a consequence of increased sedentary time. In perfect agreement with reports in middle age healthy adults were BMI predicted sedentary time at a five year follow up [48].
It must be noted that health indicators specific to older adults such as functional capacity and markers of geriatric syndromes were rarely assessed [49]. This contrasts with reports from older adults themselves who emphasise the prime importance of physical, and psychological symp-toms of geriatric syndromes such as pain, fatigue or fear of falling [29]. Mid-life cardiovascular health appears as a potential determinant of later life sitting behaviour [27].
An important finding of this review is the lack of data on modifiable determinants other than personal factors and the paucity of published qualitative research. Only four out of 22 papers reviewed dealt with potential non-personal or contextual determinants. Although the data suggest possible associations of sedentary behaviour with transportation options [19], the type of housing [27], the presence of cultural facilities in the environment and perceived safety [18] or the availability of places to rest and social isolation [29], a large range of potential deter-minants at the interpersonal, build environmental and policy level were not addressed. It is therefore difficult to appreciate how the“sedentary space” (by analogy with the concept of activity space [50], might be modified in older subjects. Characteristics of the built environment, as much as social aspects of sitting (e.g. ageist expectation that older adults can only be or even need to be sedentary) should also be further explored before any recommenda-tion can be made. Policy level factors and in particular those that rule the daily working of institutions catering
for older adults should be investigated. Older adults them-selves report sometimes being forced to sit by staff fright-ened of them falling Chastin et al. [29, 36].
Conclusions
In conclusion, results of this review point to the need to explore further potential determinants of sedentary behav-iour in older subjects. With respect to the upcoming challenge to increase public health by reducing sedentary behaviour [7], the knowledge about the determinants of sedentary behaviour will be an important first step for the development of effective strategies aiming at decreasing sedentary behaviour in aging populations. Determinants to investigate include not only individual but also context-ual such as interpersonal, build or physical environmental and policy determinants according to socio-ecological models of health behaviour [13]. In the future studies need also to focus on modifiable determinants. It should also be stressed that none of the reviewed studies included an analysis of relationships between determinants. Because a majority of studies were cross-sectional, the issue of caus-ality remains elusive. Longitudinal and experimental approaches would be necessary to identify potential levers which could be used to design innovative interventions. The different domains and settings where sedentary behaviour takes place require greater research attention. Improved measures to better capture free-living sedentary activities and their context are needed. More importantly, design of future studies should be informed by qualitative studies and integrate the views and opinions of older subjects themselves in a systems based approach of health promotion through the life course.
Additional file
Additional file 1: Table S1. Systematic search terms. (DOC 41 kb) Abbreviations
SES:Socio-economic status; SB: sedentary behaviour; BMI: Body mass index. Competing interests
The authors declare that they have no competing interests. Authors’ contributions
The manuscript was written by SC, JMO, MM, EF under the editorial steer from SC and JMO. SC, JMO, MM, GC, EF, CB all took part in editing the final version of the manuscript and analysis in the data collection. The data collection and extraction was conducted by SC, JMO, EF, CB. GOD wrote the protocol. All authors read and approved the final manuscript.
Acknowledgements
The preparation of this paper was supported by the DEterminants of DIet and Physical ACtivity (DEDIPAC) knowledge hub. This work is supported by the Joint Programming Initiative‘Healthy Diet for a Healthy Life’. The funding agencies supporting this work are (on alphabetical order of participating Member State): Belgium: Research Foundation– Flanders; Finland: Finnish Funding Agency for Technology and Innovation (Tekes); France: Institut National de la Recherche Agronomique (INRA); Germany: Project
Health Research Board (HRB); The Netherlands: The Netherlands Organisation for Health Research and Development (ZonMw); The United Kingdom: The Medical Research Council (MRC).
Author details
1
Institute of Applied Health Research, School of Health and Life Science, Glasgow Caledonian University, Glasgow, UK.2Leibniz Institute for Prevention
Research and Epidemiology- BIPS, Bremen, Germany.3Institute for Biomedicine of Aging Friedrich-Alexander-Universität, Erlangen, Nürnberg, Germany.4Centre for Physical Activity and Health Research, University of Ulster, Newtownabbey, Co. Antrim, Northern Ireland, UK.5Department of
Epidemiology and Biostatistics and the EMGO Institute for Health & Care Research, VU Medical Centre, Amsterdam, The Netherlands.6Department of
Movement and Sports Sciences, Ghent University, Ghent, Belgium.7Centre for Preventive Medicine, School of Health & Human Performance, Dublin City University, Dublin, Ireland.8Institute of Cardiometabolism and Nutrition (ICAN), Centre for Research on Human Nutrition Ile-de-France (CRNH), University Pierre et Marie Curie, Paris, France.
Received: 14 April 2015 Accepted: 25 September 2015
References
1. Wilmot EG, Edwardson CL, Achana FA, Davies MJ, Gorely T, Gray LJ, et al. Sedentary time in adults and the association with diabetes, cardiovascular disease and death: systematic review and meta-analysis. Diabetologia. 2012;55:2895–905.
2. Vallance JK, Winkler EAH, Gardiner PA, Healy GN, Lynch BM, Owen N. Associations of objectively-assessed physical activity and sedentary time with depression: NHANES (2005–2006). Prev Med (Baltim). 2011;53:284–8. 3. Katzmarzyk PT, Church TS, Craig CL, Bouchard C. Sitting time and mortality
from all causes, cardiovascular disease, and cancer. Med Sci Sports Exerc. 2009;41:998–1005.
4. Harvey JA, Chastin SFM, Skelton DA. How sedentary are older people? a systematic review of the amount of sedentary behavior. J Aging Phys Act. 2014;23(3):471–87.
5. Harvey JA, Chastin SFM, Skelton DA. Prevalence of sedentary behavior in older adults: a systematic review. Int J Environ Res Public Health. 2013;10:6645–61.
6. Stamatakis E, Davis M, Stathi A, Hamer M. Associations between multiple indicators of objectively-measured and self-reported sedentary behaviour and cardiometabolic risk in older adults. Prev Med (Baltim). 2012;54(1):82–7. 7. De Rezende LFM, Rey-López JP, Matsudo VKR, Do Carmo Luiz O. Sedentary
behavior and health outcomes among older adults: a systematic review. BMC Public Health. 2014;14:333.
8. Dogra S, Stathokostas L. Sedentary behavior and physical activity are independent predictors of successful aging in middle-aged and older adults. J Aging Res. 2012;2012:190654.
9. World Health Organisation. Global Health and Ageing. Geneva: World Health Organisation; 2011.
10. Department of Health. Start Active, Stay Active: A Report on Physical Activity from the Four Home Countries’ Chief Medical Officers. UK: United Kingdom Department of Health 2011.
11. Lakerveld J, van der Ploeg HP, Kroeze W, Ahrens W, Allais O, Andersen LF, et al. Towards the integration and development of a cross-European research network and infrastructure: the DEterminants of DIet and Physical ACtivity (DEDIPAC) Knowledge Hub. Int J Behav Nutr Phys Act. 2014;11:143. 12. Bauman AE, Reis RS, Sallis JF, Wells JC, Loos RJF, Martin BW. Correlates of
physical activity: why are some people physically active and others not? Lancet. 2012;380:258–71.
13. Owen N, Sugiyama T, Eakin EE, Gardiner PA, Tremblay MS, Sallis JF. Adults’ sedentary behavior determinants and interventions. Am J Prev Med. 2011;41:189–96.
14. Glass TA, McAtee MJ. Behavioral science at the crossroads in public health: extending horizons, envisioning the future. Soc Sci Med. 2006;62:1650–71. 15. Kmet LM, Lee RC, Cook LS. Standard quality assessment criteria for evaluating
primary research papers from a variety of fields. Edmonton: Alberta Heritage Foundation for Medical Research (AHFMR). HTA Initiat; 2004. p. 13. 16. Lord S, Chastin SFM, McInnes L, Little L, Briggs P, Rochester L. Exploring
patterns of daily physical and sedentary behaviour in community-dwelling older adults. Age Ageing. 2011;40:205–10.
17. Arnardottir NY, Koster A, Domelen D, Van Brychta RJ, Caserotti P, Eiriksdottir G, et al. Objective measurements of daily physical activity patterns and sedentary behaviour in older adults: Age, gene/environment susceptibility-Reykjavik study. Age Ageing. 2013;42:222–9.
18. Van Cauwenberg J, De Donder L, Clarys P, De Bourdeaudhuij I, Owen N, Dury S, et al. Relationships of individual, social, and physical environmental factors with older adults’ television viewing time. J Aging Phys Act. 2014;22:508–17. 19. Kikuchi H, Inoue S, Sugiyama T, Owen N, Oka K, Shimomitsu T. Correlates of
prolonged television viewing time in older Japanese men and women. BMC Public Health. 2013;13:213.
20. Godfrey A, Lord S, Mathers J, Burn D, Rochester L. The association between retirement and age on physical activity in older adults. Age Ageing. 2014;43(3):386–93.
21. Shiroma EJ, Freedson PS, Trost SG, Lee I-M. Patterns of accelerometer-assessed sedentary behavior in older women. JAMA. 2013;310:2562.
22. Hamrik Z, Sigmundová D, Kalman M, Pavelka J, Sigmund E. Physical activity and sedentary behaviour in Czech adults: results from the GPAQ study. Eur J Sport Sci. 2014;14(2):193–8.
23. Sugiyama T, Merom D, van der Ploeg HP, Corpuz G, Bauman A, Owen N. Prolonged sitting in cars: prevalence, socio-demographic variations, and trends. Prev Med (Baltim). 2012;55:315–8.
24. Ku POW, Fox KR, Chen LIJ, Chou P. Physical activity, sedentary time and subjective well-being in Taiwanese older adults. Int J Sport Psychol. 2011;42:245–62.
25. Balboa-Castillo T, León-Muñoz LM, Graciani A, Rodríguez-Artalejo F, Guallar-Castillón P. Longitudinal association of physical activity and sedentary behavior during leisure time with health-related quality of
life in community-dwelling older adults. Health Qual Life Outcomes. 2011;9:47. 26. Ishii K, Shibata A, Oka K. Sociodemographic and anthropometric factors
associated with screen-based sedentary behavior among Japanese adults: a population-based cross-sectional study. J Epidemiol. 2013;23:382–8.
27. Van Der Berg JD, Bosma H, Caserotti P, Eiriksdottir G, Arnardottir NY, Martin KR, et al. Midlife determinants associated with sedentary behavior in old age. Med Sci Sports Exerc. 2014;46:1359–65.
28. Barnett I, Van Sluijs E, Ogilvie D, Wareham NJ. Changes in household, transport and recreational physical activity and television viewing time across the transition to retirement: longitudinal evidence from the EPIC-Norfolk cohort. J Epidemiol Community Health. 2014;68(8):747–53. 29. Chastin SFM, Fitzpatrick N, Andrews M, DiCroce N. Determinants of
sedentary behavior, motivation, barriers and strategies to reduce sitting time in older women: a qualitative investigation. Int J Environ Res Public Health. 2014;11:773–91.
30. Vallance JK, Eurich D, Marshall AL, Lavallee CM, Johnson ST. Associations between sitting time and health-related quality of life among older men. Ment Health Phys Act. 2013;6:49–54.
31. Chastin SFM, Ferriolli E, Stephens NA, Fearon KCH, Greig C. Relationship between sedentary behaviour, physical activity, muscle quality and body composition in healthy older adults. Age Ageing. 2012;41:111–4. 32. Du H, Bennett D, Li L, Whitlock G, Guo Y, Collins R, et al. Physical activity
and sedentary leisure time and their associations with BMI, waist circumference, and percentage body fat in 0.5 million adults: The China Kadoorie Biobank study1-3. Am J Clin Nutr. 2013;97:487–96.
33. Larsen BA, Allison MA, Kang E, Saad S, Laughlin GA, Araneta MRG, et al. Associations of physical activity and sedentary behavior with regional fat deposition. Med Sci Sport Exerc. 2014;46:520–8.
34. Ory M, Kinney Hoffman M, Hawkins M, Sanner B, Mockenhaupt R. Challenging aging stereotypes. Am J Prev Med. 2003;25:164–71. 35. Healy GN, Clark BK, Winkler EAH, Gardiner PA, Brown WJ, Matthews CE.
Measurement of adults’ sedentary time in population-based studies. Am J Prev Med. 2011;41:216–27.
36. Chastin SFM, Culhane B, Dall PM. Comparison of self-reported measure of sitting time (IPAQ) with objective measurement (activPAL). Physiol Meas. 2014;35:2319–28.
37. Celis-Morales CA, Perez-Bravo F, Ibañez L, Salas C, Bailey MES, Gill JMR. Objective vs. Self-reported physical activity and sedentary time: effects of measurement method on relationships with risk biomarkers. PLoS One. 2012;7(5):e36345.
38. Lord S, Chastin SFM, McInnes L, Little L, Briggs P, Rochester L: Exploring patterns of daily physical and sedentary behaviour in community dwelling older adults. Age Ageing. In Press.
39. Grant PM, Ryan CG, Tigbe WW, Granat MH. The validation of a novel activity monitor in the measurement of posture and motion during everyday activities. Br J Sports Med. 2006;40:992–7.
40. Ikezoe T, Asakawa Y, Shima H, Kishibuchi K, Ichihashi N. Daytime physical activity patterns and physical fitness in institutionalized elderly women: an exploratory study. Arch Gerontol Geriatr. 2013;57:221–5.
41. Withall J, Stathi A, Davis M, Coulson J, Thompson JL, Fox KR. Objective indicators of physical activity and sedentary time and associations with subjective well-being in adults aged 70 and over. Int J Environ Res Public Health. 2014;11:643–56.
42. Kozey-Keadle S, Libertine A, Lyden K, Staudenmayer J, Freedson PS. Validation of wearable monitors for assessing sedentary behavior. Med Sci Sports Exerc. 2011;43:1561–7.
43. Chastin S, Scwartz U, Skelton D. Development of a Consensus Taxonomy of sedentary Behaviors (SIT): Report of Delphi Round 1. PLoS One.
2013;8(12):e82313.
44. Owen N, Salmon J, Koohsari MJ, Turrell G, Giles-Corti B. Sedentary behaviour and health: mapping environmental and social contexts to underpin chronic disease prevention. Br J Sports Med. 2014;48:174–7. 45. Manini TM, Carr LJ, King AC, Marshall S, Robinson TN, Jack Rejeski W.
Interventions to reduce sedentary behavior. Med Sci Sport Exerc. 2014;47(6):1306–10.
46. Ekerdt DJ. Frontiers of research on work and retirement. J Gerontol B Psychol Sci Soc Sci. 2010;65B:69–80.
47. Van Dyck D, Cardon G, Deforche B, De Bourdeaudhuij I. The contribution of former work-related activity levels to predict physical activity and sedentary time during early retirement: moderating role of educational level and physical functioning. PLoS One. 2015;10:e0122522.
48. Ekelund U, Brage S, Besson H, Sharp S, Wareham NJ. Time spent being sedentary and weight gain in healthy adults: reverse or bidirectional causality? Am J Clin Nutr. 2008;88:612–7.
49. Inouye SK, Studenski S, Tinetti ME, Kuchel GA. Geriatric syndromes: clinical, research, and policy implications of a core geriatric concept. J Am Geriatr Soc. 2007;55:780–91.
50. Perchoux C, Chaix B, Cummins S, Kestens Y. Conceptualization and measurement of environmental exposure in epidemiology: accounting for activity space related to daily mobility. Health Place. 2013;21:86–93.
Submit your next manuscript to BioMed Central and take full advantage of:
• Convenient online submission
• Thorough peer review
• No space constraints or color figure charges
• Immediate publication on acceptance
• Inclusion in PubMed, CAS, Scopus and Google Scholar
• Research which is freely available for redistribution
Submit your manuscript at www.biomedcentral.com/submit