HAL Id: hal-01939663
https://hal.archives-ouvertes.fr/hal-01939663
Submitted on 29 Nov 2018
HAL is a multi-disciplinary open access
archive for the deposit and dissemination of
sci-entific research documents, whether they are
pub-lished or not. The documents may come from
teaching and research institutions in France or
abroad, or from public or private research centers.
L’archive ouverte pluridisciplinaire HAL, est
destinée au dépôt et à la diffusion de documents
scientifiques de niveau recherche, publiés ou non,
émanant des établissements d’enseignement et de
recherche français ou étrangers, des laboratoires
publics ou privés.
Participatory mapping: Exploring landscape values
associated with an iconic species
Lisa Ernoul, Angela Wardell-Johnson, Loic Willm, Arnaud Béchet, Olivier
Boutron, Raphael Mathevet, Stephan Arnassant, Alain Sandoz
To cite this version:
Lisa Ernoul, Angela Wardell-Johnson, Loic Willm, Arnaud Béchet, Olivier Boutron, et al..
Partici-patory mapping: Exploring landscape values associated with an iconic species. Applied Geography,
Elsevier, 2018, 95, pp.71-78. �10.1016/j.apgeog.2018.04.013�. �hal-01939663�
Participatory mapping: Exploring landscape values associated with an
iconic species
Lisa Ernoul
a,b,∗, Angela Wardell-Johnson
c, Loïc Willm
a, Arnaud Béchet
a, Olivier Boutron
a,
Raphaël Mathevet
d, Stephan Arnassant
e, Alain Sandoz
a,fa Tour du Valat Research Centre, Le Sambuc, 13200, Arles, France
b UMR ESPACE, Aix-Marseille Université, Aix en Provence, France
c Centre for Human Rights Education, Curtin University, Perth, Australia
d CEFE, CNRS, Univ Montpellier, Univ Paul Valéry Montpellier 3, EPHE, IRD, Montpellier, France
e Parc Natural Régional de Camargue, Arles, France
f UFR Sciences, Aix-Marseille Université, 13003, Marseille, France
Participatory mapping provides a way to collate a wide range of landscape values providing a visual representation to inform conservation planning. We tested the use of an iconic species, the Greater Flamingo, as a lens for participatory mapping to render explicit the socio-cultural values attributed in a landscape. Spatial information on six landscape values in a biodiversity hotspot, the Camargue Biosphere Reserve (southern France) was collected from 113 participants through surveys, interviews and workshops. This data was geolocated through a SoftGIS
methodology to map and quantify the overlap of bivariate hotspots identifying value concurrence. The most frequent values recorded through total number of polygons and surface areas were wilderness and recreation. The least frequently mapped values were economic loss and biodiversity. There was frequent concurrence between biodiversity and aesthetic values especially in wetlands (lagoons, salt
fl
ats and sea). There was also frequent concurrence between biodiversity and recreational values with more overlap in sites with easy access (along roads and public areas). Our results show that using an iconic species is an eff
ective way to render explicit spatial variations in the values attributed to a landscape and to identify concurrence of values, thus enabling integration of multiple landscape values in conservation planninghow to cite :
Ernoul L., Wardell-Johnson A., Willm L., Béchet A., Boutron O., Mathevet R., Arnassant S., Sandoz A. 2018. Participatory
mapping: Exploring landscape values associated with an iconic species. Applied Geography 95:71–78. doi:
10.1016/j.apgeog.2018.04.013
1. Introduction
Human wildlife con icts are increasing and new pathways are needed to mitigate them in order to conciliate biodiversity conservation with human livelihoods and human well-being (Redpath et al., 2013). Increased public participation in planning and management that integrates socio-cultural values could e ectively overcome this challenge (Cole, McCool, & others, 1997; Ernoul & Wardell-Johnson, 2013). Engaging civil society through participatory surveys on landscape values (Brown & Weber, 2011a; Wardell-Johnson, 2006) provides a promising avenue to integrate social and ecological values for con ict mitigation.
Visualization techniques such as mapping are useful tools for environmental management. They can be used to prioritize investments and foster strategic planning (Pettit, Raymond, Bryan, & Lewis, 2011). The same landscape can be valued for multiple reasons, creating overlaps or hotspots of values (Stephenson, 2008). Participatory GIS provides a unique approach for engaging civil society in decision-making by integrating local knowledge with complex spatial information (Lasimbang, 2011; Sieber, 2006). SoftGIS approaches gather and analyze local experiential knowledge integrating GIS with quantitative techniques (Rantanen & Kahila, 2009). This process generates information from individuals and populations about the way they value their own living environment, providing local communities (and local knowledge sources) with an active voice in planning and management (Kahila-Tani, Broberg, Kyttâ, & Tyger, 2015). This participatory mapping of landscape values has drawn on approaches developed by Brown et al. (Brown & Raymond, 2007; Brown & Weber, 2011b; Brown, 2004) in which 14 landscape values were identi ed and tested: aesthetic, biodiversity, cultural, learning, therapeutic, spiritual, future, economic, historic, recreation, l ife sustaining, subsistence, intrinsic and wilderness values. This valuation scheme retrieves positive (i.e. bene ts obtained from landscapes) and negative values (i.e. degrading processes or threats) (Raymond et al., 2009).Species, landscapes, and ecosystems are va lued di erently by individuals and across human populations. Landscapes are important for socio-cultural and ecological values (Martínez Pastur, Peri, Lencinas, García-Llorente, & Martín-López, 2016; Van Riper & Kyle, 2014) and understanding the overlap of these values can help conservation professionals to design strategies to address potential valueconflicts (Bryan, Raymond, Crossman, & King, 2011; Moore, Brown, Kobryn, & Strickland-Munro, 2017). Iconic species are widely used as symbols to stimulate conservation awareness and action (Simberloff, 1997). Marketing and communication experts have used these values to advance conservation objectives (Douglas & Veríssimo, 2013). Although there has been an increasing amount of work on landscape value analysis (see Moore et al., 2017; Ramirez-Gomez, Brown, Verweij, & Boot, 2016; Zolkafli, Liu, & Brown, 2017), mapping has not previously focused on an iconic species to identify concurrence of social and ecological landscape values in relation to conservation management. Given that conservation planning and management should account for the values expressed by the local human populations (Brown & Weber, 2012) within a landscape context (Ernoul & Wardell-Johnson, 2014), we tested the use of participatory values mapping using flamingos as a proxy to reveal spatial variations in landscape valuation. The Greater Flamingo (Phoenicopterus roseus, hereafter flamingo) is an iconic species for the Camargue (Rhône Delta) in southern France (Johnson & Cézilly, 2007). Flamingos have thrived in the Camargue landscapes for over six centuries but concerns raised in the 1960s resulted in a conservation program to support breeding in the Camargue. The program was a success and increased the flamingo population across the Mediterranean basin (Johnson & Cézilly, 2007); however, global changes and conflicts with other land-uses have the potential to compromise this success (Béchet et al., 2012). This research aimed to identify value hotspots linked to flamingos in the Camargue to support effective conservation planning and landscape management. The results demonstrate the value of focusing on an iconic species as a lens for participatory mapping in conservation planning.
2. Methodology
2.1. Study area and species
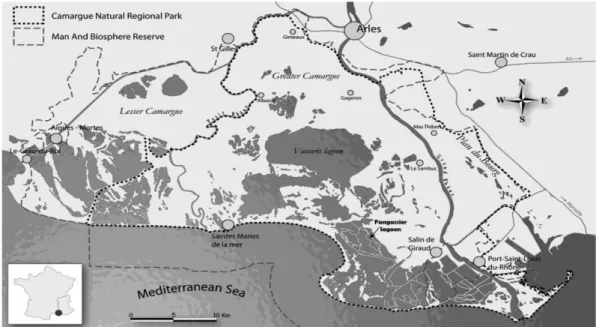
The Camargue is a Biosphere Reserve (UNESCO) recognized for its human and ecological landscape values. It is also one of the largest wetlands in the Mediterranean basin and recognized as important in the staging, wintering and breeding of water birds (Ramsar, 1986, p. 4). The delta forms a triangle of 150 000 ha encompassing three distinct management zones: Grande Camargue, Petite Camargue and the Plan du Bourg (Fig. 1).
The greater flamingo's range spans Africa, the Middle East and Southern Europe. It is in Annex 1 of the Wild Birds Directive of the European Union (European Union, 2009) and in Appendix II of the Bern Convention (strictly protected speies) (Council of Europe, 1979).
The species is not globally threatened, but it is considered of con servation concern given its dependence on a limited number of wetlands (Johnson & Cézilly, 2007). An artificial breeding island was constructed in the salt pans of Salin-de-Giraud in 1970 in response to concerns about a declining flamingo population in the Mediterranean basin. The island created ideal breeding conditions in the Camargue, increasing the breeding population to an average of 13 000 pairs per year (Béchet & Johnson, 2008; Béchet, Arnaud, Germain, & Johnson, 2009; Bechet et al., 2012). Despite abundant natural habitat, flamingos have evolved their behavior in response to improved foraging condi tions in agricultural fields. This has resulted in significant economic loss for rice producers, causing local conflicts between environmental and economic priorities (Ernoul, Mesléard, & Béchet, 2012; Ernoul, Mesléard, Gaubert, & Béchet, 2013; Tourenq et al., 2001).
A series of global changes have impacted the breeding colony over the last decade including the reduction of salt production (Béchet et al., 2012), changes in ownership of parts of the salt pans (Ernoul & Wardell-Johnson, 2016) and agricultural intensification (Pernollet, Cavallo, Simpson, Gauthier-Clerc, & Guillemain, 2017) exacerbating humanflamingo conflicts. These changes have caused greater variation in annual and seasonal water levels, reducing flamingo breeding conditions some years. In 2014, water levels around the flamingo island were so low that terrestrial predators (i.e. fox) were able to reach the colony causing flamingos to abandon their breeding site in Salin-de-Giraud and relocate to Aigues-Mortes (Fig. 1). In 2015, new hydraulic infrastructure and heavy winter rains restored the conditions and the flamingo colony returned to breed successfully in the salt pans of Salin-de-Giraud. The vulnerability of this iconic species to a range of humaninduced conditions demonstrates the need to understand the potential conflicts in land-use and landscape value for conservation planning to be effective.
2.2. Sample
Although only 25 participants are necessary for polygon analysis in participatory mapping (Brown & Pullar, 2011), we increased our sample size to include a larger representation of stakeholder groups and geographic zones. An effort was made to ensure participation of landusers and socio-professional groups (rice farmers, hunters, herders, tourism industry, site managers, scientists and local government authorities) with interest in the three zones of the Camargue (Greater Camargue, Lesser Camargue and the Plan du Bourg). We applied three approaches for collecting spatial information: participatory workshops (with open participation and meetings publicized in local newspapers), internet surveys (distributed by the Natural Regional Park of the Camargue (PNRC) and the Tour du Valat Mediterranean Wetlands Research Institute (TdV)) and face-to-face delivery by the researchers. The first two approaches are considered volunteer geographic information (Brown, Weber, & de Bie, 2014a) as compared to the face-to-face delivery which sampled participants strategically to ensure a population cross-section based on interests, socio-professional occupation or geographic location (Wardell-Johnson, 2011, pp. 15–29). The participants in workshops and face-to-face delivery used a facilitated mapping ap-proach while the internet participants used a self-administered apap-proach. Participatory workshops were organized by the PNRC in three villages: Salin-de-Giraud, Mas Thibert and Grau-du-Roi (Fig. 1). There were between 8 and 15 participants in each workshop (total of 28 participants). The workshops began with an introduction to flamingo conservation in the Camargue by a local expert (AB), then each participant completed a facilitated questionnaire and values-mapping.
Internet surveys provided the opportunity for a ‘volunteer public’ to participate in the study outside the immediate influence of other respondents present in a group work setting (Brown, Kelly, & Whitall, 2014b). Information was made available through the TdV and the PNRC. A total of 52 individuals participated in the internet survey. To ensure the representation of all of the identified interests, socio-professional groups and geographic sectors, we delivered the survey face-to-face for the categories that were under-represented (geographic and socio-professional). The individuals were selected through local social networks. Face-to-face delivery attracted 33 individual responses. In total, 113 individuals participated in the mapping with socio-demographic information collected for each participant.
2.3. Values mapping of the iconic species
We used a values mapping methodology developed by Brown and Reed (2009) and tested by members of the team both in Australia (Wardell-Johnson, 2006) and in the Camargue (Ernoul & Wardell(Wardell-Johnson, 2014). A subset of the 14 values was selected for its relevance to flamingos and the potential to delineate these values on a map geographically within the landscape. Four values (Recreation, Aesthetic, Biodiversity and Economic) were selected for this study along with two additional values: wilderness, and economic risks which were Required to reflect issues at stake in the
Camargue (Table 1).
Maptionnaire (https://maptionnaire.com) was used in all workshop settings, face-to-face questionnaire deliveries and internet surveys to map values. Maptionnaire is an interactive cloud service that creates, analyzes and publishes map-based questionnaires with an editing tool (Kahila & Kyttä, 2009). This online software provided access to multiple map scales, customizable cartography and base map features. The online interaction requires no additional translation, reducing needs for digitization that often result in spatial error (Brown, Weber, Zanon, & de Bie, 2012). Additional time and logistics were required to find appropriate workshop locations with internet access for the use of online software. Each participant had the opportunity to create a polygon delimiting an area corresponding to one or more of the selected values (not limited to the Camargue geographical area). No limits were given for the size or number of polygons for each value. Participants could choose not to map one or several values.
2.4. Data analysis
We superimposed all value-polygons (579) identified by the participants over a vector cell grid (500 m by 500 m), creating vector cells of
25 ha for each value using MapInfo version 15. We then calculated the number of polygons inclu ded for each value in each vector cell. A rasterization of the total amount of polygons per value and per vector cell was computed, creating heat maps. Heat -maps use color combi-nations to represent scores from matrix outputs of multi-criteria analyses (Karimi, Brown, & Hockings, 2015). Bivariate maps were produced for the values to identify value hotspots. Each value is represented by a unique color on each axe (Fig. 2). The axis represents a value or number of polygons. The diagonal represents identical values for each variable and is the result of the combination of the representative colors for each variable taken individually. Using the bivariate maps, we calculated the spatial concurrence of each combination of values two by two (as identified by at least half of the participants) (Karimi et al., 2015). Each value is represented by a unique color on each axe (Fig. 2). The axis represents the percentage of participants which have included the given quadrat within their polygon for each value. The diagonal represents identical values for each variable and is the result of the combination of the representative colors for each vari able taken individually.
Principal component analysis was used to convert the mapped polygons into a set of values of line arly uncorrelated variables. Because the components are linear combinations, the component scores were then statistically analyzed. Using GeoDa, we determined the Eig envectors values for each of the landscape values (https:// geodacenter.github.io/index.html) to calculate the relationship between values. Finally we compared the results for each delivery approach.
Tableau 1List and definitions of the landscape values used in the mapping exercise in the Camargue (based on Brown & Reed, 2009).
3. Results
We characterize the participants in groups according to their sociodemographic information (3.1), then we show the relative spatial attribute of each landscape value (3.2) and evaluate the spatial concurrence of bivariate hotspots (3.3). Finally we compare the results obtained according to the three participatory mapping approaches.
3.1. Socio-demographic description of participants
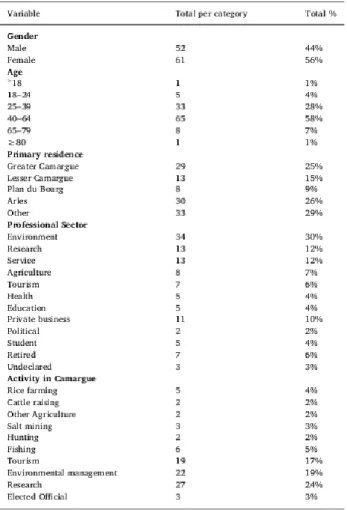
Of the 113 individuals that participated in the research, 31% were from a workshop setting, 32% through face-to-face deliveries and 37% through the internet site. There was a slightly higher participation of female participants (Females: 56%, Males: 44%) (Table 2). The majority (86%) of the participants were working age (between 25 and 64 years) with only a minimal participation from the retired community (8%). Most participants were residents in the Camargue (49%), Arles (26%) or within a 30 km radius of Arles (28%). The environmental sector (30%) was the most represented socio-professional group, followed by researchers (12%), services (including taxi drivers, nurses, waitresses, accountants) (12%) and private businesses (10%). Given the similarity in polygon distribution and concurrence for the three different methodological approaches, we integrated all of the data for spatial analysis.
3.2. Spatial attributes of landscape values
The most frequently mapped values were wilderness and recreation (polygons and surface area) (Fig. 3). The least frequently mapped values were economic loss and biodiversity (polygons and surface area).
3.3. Evaluation of landscape values hotspots
We mapped and quantified the spatial concurrence for each pair of landscape variables to determine geographic overlap between values (Fig. 4a and b,c,d and e).
Economic risks were mainly identified in fresh water zones in association with rice production. Economic gain was primarily located in coastal towns (Aigues-Mortes, Saintes-Maries de la Mer and Salin-de-Giraud), coastal zones and protected areas with organized tourism or commerce (Fig. 4a). Aesthetic values spanned most of the Camargue landscape, with strong concurrence
between recreational and aesthetic values in coastal zones, areas accessible to the public, beaches and roads surrounding protected areas (Fig. 4b). The highest levels of concurrence in recreational and wilderness values were in the zones surrounding the accessible protected areas (Fig. 4c). There was a stronger wilderness value in protected areas and a higher recreational value in the coastal areas and main towns. There was a high concurrence between biodiversity and aesthetic values, especially in wetlands (lagoons, salt flats and sea) (Fig. 4d). Aesthetic value comprised a larger area than biodiversity value. There were no areas with biodiversity value that did not also have an aesthetic value. There was a strong concurrence between biodiversity and recreational values with stronger overlap in the areas with easy access (along roads and public areas) (Fig. 4e). The coastal zone had higher value for recreation when compared to biodiversity value.
Figure 3Number of polygons and total area of polygons delimiting the location of the values attributed to landscape used by flamingos in the Camargue (surface areas are given in km2).
Tableau 2 Socio-demographic information on the participants involved in the landscape values mapping exercise in the Camargue
Bivariate maps and spatial concurrence (Table 3) demonstrated strongest overlap between biodiversity and aesthetic values (43%), followed by aesthetic and wilderness values (42%), and then biodiversity and wilderness values (41%). Recreational values had the least correlation (17%) with economic gain as compared to the other values.
There was very little concurrence between economic loss and other variables, with the exception of economic loss and biodiver sity (18%). The PCA analysis carried out using the GeoDa software showed the following trends (Eigenvector values > 0,5): PC1: Recreation (0.55), E conomic gain (0.56), Biodiversity (0.57), PC2: Economic loss (0.8), Aesthetic (−0.66), PC3: Economic loss (−0.57), Aesthetic (0.81), PC4: Recreation (−0.76), Economic gain (0.63) and PC5: Economic gain (0.52), Biodiversity (0.8). The squared correlations showed strong links between Recreation (0.87), Economic gain (0.9) and Biodiversity (0.92) in PC1 as opposed to Economic loss (0.63) in PC2. This indicated a strong positive relationship in the perception for recreational, biodiversity and aesthetic values.
The comparison of number of polygons selected according to the three survey approaches (workshop, face-to-face delivery and internet), allowed us to weight the contribution of each survey approach (Fig. 5). Workshop participants consistently designated more polygons followed by face-to-face delivery and internet participants. This was mostly likely the result of interactions with other participants in the workshop setting. Thus the workshop setting could reflect a more generalized valuing. However, considering that concurrence between values did not change according to survey approach, the generalized valuing did not nuance the individual values in a landscape context but offered strength through methodological triangulation in instrument delivery.
4. Discussion and conclusions
Using geographic information systems to map landscape values has been tested and shown to be effective for landscape planning (Gallo, Townshend, & Lake, 2015; Moore et al., 2017; Ramirez-Gomez et al., 2016). Here, participatory mapping was used to test the worth of using iconic species in understanding the co-occurrence of individual values in a landscape. The values-mapping of iconic species stimulates public participation potentially generating management approaches that integrate ecological needs of the species (and associated habitats and ecosystems) to complement the values of the human population.
We found that landscape values focusing on an iconic species were not randomly distributed, but rather created a pattern of hotspots in very specific locations. This correlates with similar participatory mapping research focusing on landscapes in general (Brown & Reed, 2009; Kahila-Tani et al., 2015). Weighting the values by the number of responses per pixel, allowed us to determine which landscape categories were most frequently valued for each site. The maps demonstrated that aesthetic value is predominant in more accessible areas (along roadways and beaches) indicating that human access is a key to this value. The link between aesthetics and access could be attributed to the fact that when people can visit a site, they are exposed to the beauty (or lack of) in that place. Land with restricted access does not allow people to visit, thus the aesthetic values are not nominated. This would indicate that if areas are managed for aesthetics, recreation and wilderness, attention must also be given to ensure some access to human populations to support the other values. The relationship between aesthetics and accessibility conveys an important message for land manager s: increasing public access could increase values associated with those places but must be appropriately managed so as not to threaten other values such as wilderness or biodiversity (Bennett & Dearden, 2014).
The identification of hotspots provides a way to quantify, visualize, and geo-locate the values underpinning management options by integrating multiple landscape values. Similar to Harrison et al. (2014), we identified larger surface areas and higher density of polygons for aesthetics, recreation and wilderness. These values were often linked together in our research; however, Qiu, Linderg & Nielsen (2013) suggest that the relationship may not always be positively correlated. The economic losses due to biodiversity conservation (Sukumar, 1989) or restricted recreational activities (McLachlan, Defeo, Jaramillo, & Short, 2013) are often cited as causes of conservation conflict (Brown, Weber, & de Bie, 2014). In our research, we clearly identified concurrence between biodiversity and economic loss and biodiversity and recreation. These hotspots can alert land managers to potential areas of conflict. Integration of participatory processes in decision-making could reduce these risks and promote effective engagement of socio-economic systems and improve mitigation actions (Jones, Shaw, Ross, Witt, & Pinner, 2016). Mapping landscape values provides land managers with planning tools and evidence to minimize land-use con
fl
ict and to develop more eff
ective conservation planning.Economic gain and economic risk values are often a point of contention for land management (Zia et al., 2011). Despite increasing recognition of the importance of economic contributions of public land protected for biodiversity values, few studies document the soci o-economic value of protected areas (Heagney, Kovac, Fountain, & Conner, 2015). Further research into the links between economic values and economic risks on both public protected lands and private lands would provide useful information for site managers to understand con
fl
icts related to biodiversity and economic value. This would be an eff
ective means of minimizing perceived economic risk relating to biodiversity conservation in landscapes with multiple uses such as Biosphere reserves.Similar to previous work by Brown et al. (2014), we found that workshop participants (volunteer and facilitated participants) con sistently selected more polygons for each landscape value compared to internet (volunteer and self -administered) and face-to-face delivery (selected and facilitated) approaches. However, despite the di
ff
erence in polygon numbers, there were not important diff
erences in landscape value concurrence with the three approaches. Given the importance of tourism in the Camargue, it is important to note t hat our sampling methodology did not include tourists. Future studies considering tourist values in the Camargue would be a valuable complement to these re sults.E
ff
ective planning for conservation of biodiversity requires approaches that integrate the plurality of stakeholder values. Iconic species distil the characteristics of socio-ecological interdependence, providing signifi
cant value to integrative conservation strategies in regional planning and management design (Mathevet, Thompson, Folke, & Chapin, 2016). In conclusion, our study demonstrates that iconic species are a useful lens for participatory mapping of landscape values and could potentially spur interest and focus attention in con servation planning for other sites.Tableau 3 Spatial concurrence of landscape values in Camargue (values with the highest spatial concurrence are highlighted in yellow and lowest are shown in blue).
Biodiversity Aesthetic Wilderness Recreation Economic gain Biodiversity Aesthetic Wilderness Recreation Economic gain Economic loss 43% 41% 23% 37% 18% 42% 23% 35% 1% 25% 32% 1% 17% 0% 9%
Figure 4 a: Bivariate heat map of economic loss (blue) and economic gain (pink) landscape values in Camargue. b: Bivariate heat map of aesthetic (blue) and recreation (pink) landscape values in Camargue. c: Bivariate heat map of wilderness (blue) and recreation (p
Figure 5Comparative analysis of the percentage of polygons designated for each landscape value according to participatory mapping survey approach in Camargue.
Acknowledgments
This study was funded by the Fondation de France, Fondation MAVA and Fondation Tour du Valat. We thank Tatiana Fuentes, Katia Lombardini and Camille Muranyi-Kovacs for their support in the participatory workshops.
References
Béchet, A., Arnaud, A., Germain, C., & Johnson, A. (2009). Greater flamingos stop breeding in the Camargue (souther France) in 2007, for the first time in 38 years; the beginning of a new era? In flamingo (vol. Special publication 1, pp. 26–29). Antequera, Spain: IUCNSSC/wetlands international flamingo specialist group. Retrieved from http://digital.csic.
es/handle/10261/61747.
Béchet, A., & Johnson, A. (2008). Anthropogenic and environmental determinants of Greater Flamingo Phoenicopterus roseus breeding numbers and productivity in the Camargue (Rhone delta, southern France). Ibis, 150, 69–79.
Bechet, A., Rendón-Martos, M., RENDÔN, M.Á., AMAT, J. A., Johnson, A. R., & GauthierClerc, M. (2012). Global economy interacts with climate change to jeopardize species conservation: The case of the greater flamingo in the mediterranean and west Africa. Environmental Conservation, 39(01), 1–3.
Béchet, A., Rendon-Martos, M., Rendon, M.Á., Amat, J. A., Johnson, A. R., & GauthierClerc, M. (2012). Global economy interacts with climate change to jeopardize species conservation: The case of the greater flamingo in the mediterranean and west Africa. Environmental Conservation, 1(1), 1–3.
Bennett, N. J., & Dearden, P. (2014). Why local people do not support conservation: Community perceptions of marine protected area livelihood impacts, governance and management in Thailand. Marine Policy, 44, 107–116. https://doi.org/10.1016/j. marpol.2013.08.017.
Brown, G. (2004). Mapping spatial attributes in survey research for natural resource Management: Methods and applications. Society & Natural Resources, 18(1), 17–39. https://doi.org/10.1080/08941920590881853.
Brown, G., Donovan, S., Pullar, D., Pocewicz, A., Toohey, R., & Ballesteros-Lopez, R. (2014). An empirical evaluation of workshop versus survey PPGIS methods. Applied Geography, 48, 42–51. https://doi.org/10.1016/j.apgeog.2014.01.008.
Brown, G., Kelly, M., & Whitall, D. (2014b). Which ‘public”? Sampling effects in public participation GIS (PPGIS) and volunteered geographic information (VGI) systems for public lands management. Journal of Environmental Planning and Management, 57(2), 190–214. https://doi.org/10.1080/09640568.2012.741045.
Brown, G., & Pullar, D. (2011). An evaluation of the use of points versus polygons in public participation geographic information systems using quasi-experimental design and Monte Carlo simulation. International Journal of Geographical Information Science, 26(2), 231–246. https://doi.org/10.1080/13658816.2011.585139.
Brown, G., & Raymond, C. (2007). The relationship between place attachment and landscape values: Toward mapping place attachment. Applied Geography, 27(2), 89–111. https://doi.org/10.1016/j.apgeog.2006.11.002.
Brown, G. G., & Reed, P. (2009). Public participation GIS: A new method for use in national forest planning. Forest Science, 55(2), 166–182.
Brown, G., & Weber, D. (2011a). Public participation GIS: A new method for national park planning. Landscape and Urban Planning, 102(1), 1–15. https://doi.org/10.1016/j. landurbplan.2011.03.003.
Brown, G., & Weber, D. (2011b). Public participation GIS: A new method for national park planning. Landscape and Urban Planning, 102(1), 1–15. https://doi.org/10. 1016/j.landurbplan.2011.03.003.
Brown, G., & Weber, D. (2012). Measuring change in place values using public participation GIS (PPGIS). Applied Geography, 34, 316–324. https://doi.org/10.1016/j. apgeog.2011.12.007.
Brown, G., Weber, D., & de Bie, K. (2014a). Assessing the value of public lands using public participation GIS (PPGIS) and social landscape metrics. Applied Geography, 53, 77–89. https://doi.org/10.1016/j.apgeog.2014.06.006.
Brown, G., Weber, D., Zanon, D., & de Bie, K. (2012). Evaluation of an online (opt-in) panel for public participation geographic information systems surveys. International Journal of Public Opinion Research. https://doi.org/http://dx.doi.org/10.1093/ijpor/ eds001.
Bryan, B., Raymond, C., Crossman, N., & King, D. (2011). Comparing spatially explicit ecological and social values for natural areas to identify effective conservation Strategies: Spatial comparison of social and ecological values. Conservation Biology, 25(1), 172–181. https://doi.org/10.1111/j.1523-1739.2010.01560.x.
Cole, D. N., & McCool, S. F. others. (1997). Limits of acceptable change and natural resources planning: When is LAC useful, when is it not? United states department of agriculture forest service general technical report INT69–71.
Council of Europe (1979). Convention on the Conservation of European Wildlife and Natural Habitats Convention relative à la conservation de la vie sauvage et du milieu naturel de l'Europe, Pub. L. No. Appendix II – Strictly protected fauna species.
Douglas, L. R., & Veríssimo, D. (2013). Flagships or Battleships: Deconstructing the relationship between social conflict and conservation flagship species. Environment and Society: Advances in Research, 4(1), 98–116. https://doi.org/10.3167/ares.2013. 040107.
Ernoul, L., Mesléard, F., & Béchet, A. (2012). Diagnostic de l’échec de la contractualisation des mesures agri-environnementales pour réduire les incursions des Flamants dans les rizières de Camargue (France). VertigO, 12(1)https://doi.org/10.4000/ vertigo.12112.
Ernoul, L., Mesléard, F., Gaubert, P., & Béchet, A. (2013). Limits to agri-environmental schemes uptake to mitigate human–wildlife conflict: Lessons learned from flamingos in the Camargue, southern France. International Journal of Agricultural Sustainability, 1–14. https://doi.org/10.1080/14735903.2013.798897.
Ernoul, L., & Wardell-Johnson, A. (2013). Governance in integrated coastal zone management: A social networks analysis of cross-scale collaboration. Environmental Conservation, 40(3), 231–240. https://doi.org/10.1017/S0376892913000106.
Ernoul, L., & Wardell-Johnson, A. (2014). Adapting international conservation strategies to local context: Perceptions of biodiversity values and management responsibility in two mediterranean deltas. International Journal of Biodiversity Science, Ecosystem
Services & Management, 1–13. https://doi.org/10.1080/21513732.2014.980849.
Ernoul, L., & Wardell-Johnson, A. (2016). Representing the greater flamingo in southern France: A semantic analysis of newspaper articles showing change over time. Ocean & Coastal Management, 133, 105–113.
European Union (2009). Directive 2009/147/EC of the Eruopean parliment and of the council on the conservation of wild birds, pub. L. No. 2009/147/EC. 19 . Retrieved from http:// eur-lex.europa.eu/legal-content/EN/TXT/PDF/?uri=CELEX:32009L0147& from=EN.
Gallo, R. G., Townshend, T. G., & Lake, A. A. (2015). Exploring urban parks and their peripheral food environments using a case study approach: Young people and obesogenic environments. Urban Design International, 20(1), 28–43. https://doi.org/10. 1057/udi.2013.35.
Harrison, P., Berry, P., Simpson, G., Haslett, J., Blicharska, M., Bucur, M., et al. (2014). Linkages between biodiversity attributes and ecosystem services: A systematic review. Ecosystem Services, 9, 191–203.
Heagney, E., Kovac, M., Fountain, J., & Conner, N. (2015). Socio-economic benefits from
protected areas in southeastern Australia. Conservation Biology, 29(6), 1647–1657. Johnson, A., & Cézilly, F. (2007). The greater flamingo (T & a poyser). London, UK: T & AD Poyser.
Jones, N. A., Shaw, S., Ross, H., Witt, K., & Pinner, B. (2016). The study of human values in understanding and managing social-ecological systems. Ecology and Society, 21(1) https://doi.org/10.5751/ES-07977-210115.
Kahila-Tani, M., Broberg, A., Kyttâ, M., & Tyger, T. (2015). Let the citizens map—public participation GIS as a planning support system in the Helsinki master plan process. Planning Practice and Research, 1–20. https://doi.org/10.1080/02697459.2015. 1104203.
Kahila, M., & Kyttâ, M. (2009). SoftGIS as a bridge-builder in collaborative urban planning. Planning support systems best practice and new methods (pp. 389–411). Springer. Retrieved from http://link.springer.com/chapter/10.1007/978-1-4020-8952-7_19.
Karimi, A., Brown, G., & Hockings, M. (2015). Methods and participatory approaches for identifying social-ecological hotspots. Applied Geography, 63, 9–20. https://doi.org/ 10.1016/j.apgeog.2015.06.003.
Lasimbang, A. (2011). Participatory community mapping: A gender perspective. In A. Wardell-Johnson, N. Amram, R. Selvaratnam, & S. et Ramakrishna (Eds.). Biodiversity and social Justice: Practices for an ecology of peace Perth Western Australia.
Martínez Pastur, G., Peri, P. L., Lencinas, M. V., García-Llorente, M., & Martín-López, B. (2016). Spatial patterns of cultural ecosystem services provision in Southern Patagonia. Landscape Ecology, 31(2), 383–399. https://doi.org/10.1007/s10980-015- 0254-9.
Mathevet, R., Thompson, J. D., Folke, C., & Chapin, F. S. (2016). Protected areas and their surrounding territory: Socioecological systems in the context of ecological solidarity. EcologicalApplications, 26(1), 5–16.
McLachlan, A., Defeo, O., Jaramillo, E., & Short, A. D. (2013). Sandy beach conservation and recreation: Guidelines for optimising management strategies for multi-purpose use. Ocean & Coastal Management, 71, 256–268. https://doi.org/10.1016/j. ocecoaman.2012.10.005.
Moore, S. A., Brown, G., Kobryn, H., & Strickland-Munro, J. (2017). Identifying conflict potential in a coastal and marine environment using participatory mapping. Journal of Environmental Management, 197, 706–718.
Pernollet, C. A., Cavallo, F., Simpson, D., Gauthier-Clerc, M., & Guillemain, M. (2017). Seed density and waterfowl use of rice fields in Camargue, France: Seed density and use of rice
fields by ducks. Journal of Wildlife Management, 81(1), 96–111. https://doi. org/10.1002/jwmg.21167.
Pettit, C., Raymond, C., Bryan, B., & Lewis, H. (2011). Identifying strengths and weaknesses of landscape visualisation for effective communication of future alternatives. Landscape and Urban Planning, 100(3), 231–241. https://doi.org/10.1016/j. landurbplan.2011.01.001.
Qiu, L., Lindberg, S., & Nielsen, A. B. (2013). Is biodiversity attractive?—On-site perception of recreational and biodiversity values in urban green space. Landscape and Urban Planning, 119, 136–146. https://doi.org/10.1016/j.landurbplan.2013.07.007.
Ramirez-Gomez, S. O. I., Brown, G., Verweij, P. A., & Boot, R. (2016). Participatory mapping to identify indigenous community use zones: Implications for conservation planning in southern Suriname. Journal for Nature Conservation, 29, 69–78. https:// doi.org/10.1016/j.jnc.2015.11.004.
Ramsar (1986). Fiche descriptive sur le Camargue (Ramsar fact sheet). rles, France Parc Naturel Régional de Camargue. A Retrieved from http://ramsar.wetlands.org/ Database/Searchforsites/tabid/765/language/en-US/Default.aspx.
Rantanen, H., & Kahila, M. (2009). The SoftGIS approach to local knowledge. Journal of Environmental Management, 90(6), 1981–1990. https://doi.org/10.1016/j.jenvman. 2007.08.025.
Raymond, C., Bryan, B., MacDonald, D., Cast, A., Strathearn, S., Grandgirard, A., et al. (2009). Mapping community values for natural capital and ecosystem services. Ecological Economics, 68(5), 1301–1315. https://doi.org/10.1016/j.ecolecon.2008. 12.006.
Redpath, S. M., Young, J., Evely, A., Adams, W. M., Sutherland, W. J., Whitehouse, A., et al. (2013). Understanding and managing conservation conflicts. Trends in Ecology & Evolution, 28(2), 100–109. https://doi.org/10.1016/j.tree.2012.08.021.
Sieber, R. (2006). Public participation geographic information systems: A literature review and framework. Annals of the Association of American Geographers, 96(3), 491–507. Simberloff, D. (1997). Flagships, umbrellas, and keystones: Is single-species management passé in the landscape era? Biological Conservation, 83(3), 247–257.
Stephenson, J. (2008). The Cultural Values Model: An integrated approach to values in landscapes. Landscape and Urban Planning, 84(2), 127–139. Sukumar, R. (1989). The Asian Elphant: Ecology and management. Cambridge: Press Syndicate of the University of Cambridge.
Tourenq, C., Bennetts, R. E., Kowalski, H., Vialet, E., Lucchesi, J. L., Kayser, Y., et al. (2001). Are ricefields a good alternative to natural marshes for waterbird communities in the Camargue, southern France? Biological Conservation, 100(3), 335–343.
Van Riper, C. J., & Kyle, G. T. (2014). Capturing multiple values of ecosystem services shaped by environmental worldviews: A spatial analysis. Journal of Environmental Management, 145, 374–384. https://doi.org/10.1016/j.jenvman.2014.06.014.
Wardell-Johnson, A. (2006). A sense of place: Valuing landscapes in the condamine headwaters. In T. Graham, J. James, G. Leach, & A. Moore (Eds.). Building capacity for sustainability resource management...moving a wheelbarrow full of frogs Toowoomba, Queensland.
Wardell-Johnson, A. (2011). Value connections between people and landscapes. In biodiversity & social justice: Practices for an ecology of peace. In A. Wardell-Johnson, N. Amram, R. Selvaratnam, & S. et Ramakrishna (Eds.). Perth Western Australia: Black Swan Press.
Zia, A., Hirsch, P., Songorwa, A., Mutekanga, D. R., O'Connor, S., McShane, T., et al. (2011). Cross-Scale value trade-offs in managing social-ecological Systems: The politics of scale in ruaha national park, Tanzania. Ecology and Society, 16(4)https:// doi.org/10.5751/ES-04375-160407.
Zolkafli, A., Liu, Y., & Brown, G. (2017). Bridging the knowledge divide between public and experts using PGIS for land use planning in Malaysia. Applied Geography, 83, 107–117. https://doi.org/10.1016/j.apgeog.2017.03.013s.