HAL Id: hal-02995338
https://hal.archives-ouvertes.fr/hal-02995338
Submitted on 19 Nov 2020
HAL is a multi-disciplinary open access
archive for the deposit and dissemination of sci-entific research documents, whether they are pub-lished or not. The documents may come from teaching and research institutions in France or abroad, or from public or private research centers.
L’archive ouverte pluridisciplinaire HAL, est destinée au dépôt et à la diffusion de documents scientifiques de niveau recherche, publiés ou non, émanant des établissements d’enseignement et de recherche français ou étrangers, des laboratoires publics ou privés.
Sex Chromosome Degeneration by Regulatory Evolution
Thomas Lenormand, Frederic Fyon, Eric Sun, Denis Roze
To cite this version:
Thomas Lenormand, Frederic Fyon, Eric Sun, Denis Roze. Sex Chromosome Degeneration by Regulatory Evolution. Current Biology - CB, Elsevier, 2020, 30 (15), pp.3001-3006.e5. �10.1016/j.cub.2020.05.052�. �hal-02995338�
1
Sex chromosome degeneration by
1regulatory evolution
23
Thomas Lenormand1,2,§, Fredric Fyon1, Eric Sun2, Denis Roze3,4
4
1 CEFE, Univ Montpellier, CNRS, Univ Paul Valéry Montpellier 3, EPHE, IRD, Montpellier, France 5
2 Radcliffe Institute, Harvard University, Cambridge, MA, USA 6
3 CNRS, UMI 3614, Roscoff, France 7
4 Sorbonne Université, Station Biologique de Roscoff, France 8
§ Corresponding author: [email protected] 9
10
Keywords: sex chromosome; population genetics theory; cis-regulators; degeneration; selective 11
interference; dosage compensation 12
Highlights
13 A new theory for Y degeneration, not based on selective interference 14
Initiated by X and Y cis-regulator divergence after the arrest of recombination 15
Works faster and in larger populations than current theory 16
Works on small non-recombining region on the Y 17
eTOC Blurb
18Y chromosomes are often degenerate. This remarkable feature of the genome of plants and 19
animals has been intensely investigated. Current theory proposes that this degeneration occurs 20
from “selective interference” after the arrest of recombination between the X and Y 21
chromosome, meaning that natural selection tends to be inefficient in the absence of 22
recombination. This theory has been in place for more than 40 years. In this paper, we propose a 23
2
new theory (termed degeneration by regulatory evolution) based on the instability of diploid 24
expression between non-recombining chromosomes. We show that this theory can explain fast Y 25
degeneration (especially when selective interference and regulatory evolution co-occur) and 26
simultaneous Y silencing and dosage compensation. It is open to tests using genomic and 27
transcriptomic methods that have been recently developed in many plant and animal species. 28
Abstract
29
In many species, the Y (or W) sex chromosome is degenerate. Current theory proposes that this 30
degeneration follows the arrest of recombination and results from the accumulation of 31
deleterious mutations due to selective interference--the inefficacy of natural selection on non-32
recombining genomic regions. This theory requires very few assumptions, but does not robustly 33
predict fast erosion of the Y (or W) in large populations or the stepwise degeneration of several 34
small non-recombining strata. We propose a new mechanism for Y/W erosion that works over 35
faster timescales, in large populations, and for small non-recombining regions (down to a single 36
sex-linked gene). The mechanism is based on the instability and divergence of cis-regulatory 37
sequences in non-recombining genome regions, which become selectively haploidized to mask 38
deleterious mutations on coding sequences. This haploidization is asymmetric, because cis-39
regulators on the X cannot be silenced (otherwise there would be no expression in females). This 40
process causes rapid Y/W degeneration and simultaneous evolution of dosage compensation, 41
provided that autosomal trans-regulatory sequences with sex-limited effects are available to 42
compensate for cis-regulatory divergence. Although this “degeneration by regulatory evolution” 43
does not require selective interference, both processes may act in concert to further accelerate 44
Y degeneration. 45
Main
46
The contemporary theory for the evolution of sex chromosome crystallized in the 1970s 47
[1–3] and applies to both XX/XY and ZZ/ZW sex determination systems, which share important 48
convergent similarities [4]. Both cases involve a chromosome that is heterozygous (the Y or W) 49
and present in only one sex. Although a broad range of situations has been described, in many 50
3
cases, most of the chromosome has stopped recombining and has degenerated considerably. 51
Current theory, which we term “Degeneration by selective interference” (DSI) has been 52
substantially refined since the 70s’, but its core idea--degeneration caused by selective 53
interference--has remained unchanged [3,5–8]. The theory about selective interference, as well 54
as its empirical evaluation, has also been largely developed since the 70s’, well beyond the case 55
of Y degeneration [9–11]. DSI involves a sequence of steps that occur after the arrest of 56
recombination between the Y and X chromosomes (all our arguments also apply to Z/W 57
chromosome system): (a) degeneration of Y-linked genes by 'selective interference' (also known 58
as the 'Hill-Robertson effect'), due to processes such as Muller's Ratchet, hitchhiking, and 59
background selection [8], (b) facultatively, adaptive silencing of Y-linked genes, and (c) evolution 60
of dosage compensation. A variant of this theory proposes that the accumulation of deleterious 61
alleles in regulatory sequences by selective interference leads to reduced Y gene expression [12]. 62
Y-linked alleles, being partially hidden would then further accumulate deleterious mutations and 63
degenerate [13]. 64
In this paper, we propose a new “Degeneration by Regulatory Evolution” (DRE) theory to 65
explain Y chromosome degeneration. The main differences from the DSI model are that our 66
theory does not require selective interference, and that steps a-c occur simultaneously after 67
recombination suppression. We previously showed that, for autosomal genes, a ‘cis-regulator 68
runaway’ process occurs that leads stronger cis-regulators to become associated with 69
chromosomes with fewer deleterious mutations [14]. This favors the stronger cis-regulatory 70
alleles, provided they are tightly linked to their coding gene. We also showed that cis-regulators 71
diverge in asexuals, where diploid expression is unstable and quickly becomes “haploidized” [15]. 72
DRE theory involves such divergence of cis-regulators, but with an asymmetry between the X and 73
Y chromosomes (preventing the suppression of gene expression on the X). We investigate DRE 74
using individual-based stochastic simulations of a population of Npop diploid individuals, with XY
75
males and XX females. In order to capture the essence of the mechanism, we first study a minimal 76
system with only four loci (Fig 1): a gene G, its cis-regulator C, and two trans-regulators T (we will 77
then extend the model to the case of a non-recombining region comprising a larger number of 78
genes). Trans-regulators, such as transcription factors, are not closely linked to their target gene, 79
4
and influence expression on both homologs, whereas cis-regulators, such as enhancers, control 80
the expression of the closely linked gene, and influence only the copy carried on the same 81
chromosome as themselves [16]. We assume that G and C are present on both sex chromosomes, 82
and that they recombine (in females only) at a rate Rc. We include trans-regulators in order to
83
examine whether, and over what time-scale, dosage compensation will evolve when expression 84
of the Y-linked allele decreases. With these trans-regulators, overall expression can be 85
maintained, i.e. dosage compensated, even if cis-regulators change and diverge between the X 86
and Y. Dosage compensation cannot evolve if the trans-regulators act in the same way in both 87
males and females, or equally on the X and the Y. Hence we do not consider all potential trans-88
regulators, but only those that could influence dosage compensation. Specifically, we focus on 89
the simplest symmetrical case with one trans-regulator expressed in males Tm, and one in females
90
Tf. Both cases have been described empirically (C. elegans dosage compensation works by halving
91
X expression in females, whereas in Drosophila, it works by doubling X expression in males [17]). 92
For simplicity, we assume that these T loci are autosomal and that they recombine freely with 93
each other and with the G and C loci. 94
This initial model is later extended to nL CGTmTf quadruplets of genes (where nL = 1, 50,
95
500). In these models, we assume that the C and G loci are uniformly spaced on the sex 96
chromosomes, with two adjacent genes G recombining at a rate Rg in females, and where each C
97
locus is assumed to be closer to the G gene it regulates than to the next G gene (ten times closer 98
in the simulations,); again, recombination is assumed not to occur in males, representing a non-99
recombining region including the sex-determining locus, while all T factors are again assumed to 100
recombine freely with the sex-determining region. In this model, each CG pair is influenced by its 101
own TmTf pair, which represents the lowest degree of pleiotropy of these trans-acting factors, but
102
involves a very high number of trans-regulators. We also considered a model where only one TmTf
103
pair controls all the G and C loci, representing the other extreme case where trans-regulators are 104
maximally pleiotropic and influence many (here all nL) genes.
105
Deleterious mutations occur within genes G at a rate UG per gene. Their fitness effect s is
106
drawn from an exponential distribution with mean smean. The effects of multiple mutations in the
107
same gene are assumed to be additive, but with a maximum effect per gene, smax (which may be
5
interpreted as the fitness effect of a full gene knock-out). Their dominance depends on the 109
strength of their associated cis-regulator (see methods). The effects of alleles at the cis- (C) and 110
trans-regulators (Tm, Tf) are modelled as quantitative traits denoted by c, tm, tf, respectively, and
111
control the level of expression Q of the gene, which is under stabilizing selection with intensity I 112
(methods). The different events of the life cycle occur in the following order: diploid selection, 113
meiosis with recombination, mutation, and syngamy. Simulations are initialized with no 114
polymorphism present, and the optimal gene expression level (no deleterious allele, all c and tm,
115
tf alleles fixed to 1). After a burn-in phase where the chromosome evolves with recombination in
116
both sexes, we stop XY recombination in males to create a sex-linked region and follow the 117
frequencies and effects of deleterious mutations on the X and Y, as well as the evolution of the 118
regulatory genes. These outputs are averaged over different numbers of replicates depending on 119
the variance in the process under different parameter values (methods, Table S1). At regular 120
intervals, we compute Phalfsilent, the probability (across replicates) that Y allele-specific expression
121
𝜙𝑌,𝑖 decreased by two fold from the initial value of 0.5 to 𝜙𝑌,𝑖 < 0.25. A complementary approach 122
to quantify partial silencing is to measure the dominance coefficient of deleterious alleles on the 123
Y, measured by ℎ𝑌,𝑖 = 𝜙Y,𝑖−ln ℎ/ln 2 (see Methods). We also compute Psilent, the probability that
124
𝜙𝑌,𝑖 becomes close to zero (below 0.01), so that alleles on the Y become nearly entirely recessive.
125
The quantity Phalfdead then refers to the probability that, by a given number of generations after
126
the Y-linked region stopped recombining, deleterious mutations on the Y gene copy have reduced 127
fitness by an amount 𝑠𝑚𝑎𝑥/2, and Pdead that they reduced fitness by an amount 𝑠𝑚𝑎𝑥, indicating
128
that the gene has entirely degenerated on the Y. 129
Fig 2 illustrates the process with nL =1 (one gene, one cis-regulator, one male limited and one
130
female limited trans-regulator). The system does not generate any male-female or X-Y asymmetry 131
before recombination arrest (methods, Fig S5). After recombination arrest, the gene carried by 132
the Y degenerates: it becomes progressively recessive, as ℎ𝑌 changes from h = 0.25 to zero, and
133
accumulates deleterious mutations (the overall fitness effect of mutations present on the Y copy 134
increases up to smax), despite there being very limited selective interference (at most only
135
occurring between the gene and its cis-regulator). Silencing occurs first, and the accumulation of 136
deleterious mutations follows later in the process (the curve representing Phalfsilent is ahead of the
6
one showing the accumulation of deleterious mutation on the Y, as measured by Phalfdead).
138
Degeneration also occurs with full dosage compensation, and overall expression never departs 139
from the optimum in either sex (Fig 2b). Compensation typically involves, at least initially, a 140
mixture of upregulation of X gene copies in males and downregulation in females (methods, Fig. 141
S7). 142
What is the underlying cause of this asymmetrical degeneration? Once X and Y stop recombining, 143
diploid expression becomes unstable. Cis-regulators on the X and Y can diverge, eventually 144
leading to the haploidization of expression in males. This is not prevented by stabilizing selection 145
on expression levels as long as trans-regulators can coevolve to maintain near optimal total 146
expression in both sexes. When the strength of cis-regulators on the Y starts decreasing, the 147
process is accelerated by a “haploidization” positive feedback loop. Indeed, weak Y cis-regulators 148
become associated with coding sequences carrying more deleterious mutations, as they cause a 149
reduction in dominance. They are then selected to weaken further in order to mask those 150
deleterious mutations, which leads to the accumulation of even more deleterious mutations, and 151
so forth. By contrast, the other ‘haploidized’ situation (where the X is silenced in males) is 152
reversible, as X chromosomes with weak cis-regulators and a higher load of deleterious mutations 153
cannot fix, as they become homozygous and selected against in females when too frequent 154
(unlike partially silenced Y genes, which can spread as they stay heterozygous in males). 155
Therefore, the regulatory system has only one stable equilibrium, where the Y is silenced and 156
degenerate. 157
Selective interference plays no role in this process, explaining why degeneration occurs even for 158
a single Y-linked gene. However, the process is stochastic, as it is initiated by a random departure 159
from diploid expression with a sufficiently weak Y cis-regulator to trigger the “haploidization” 160
feedback loop. In individual simulation replicates, degeneration is indeed very abrupt, but occurs 161
at varying time points (Fig 2a). Because of this stochasticity, the process is slowed down in larger 162
populations: it is ~10 times slower in ~10 times larger populations (Fig 2d). With the same 163
parameters but without mutation in the cis-regulator (Uc = 0, Fig 2c), as in DSI theory,
164
degeneration does not occur, as expected, since there is neither selective interference nor cis-165
regulatory divergence. Degeneration does not occur either in the absence of mutation in the 166
7
trans-regulators (Ut = 0, Fig 2c) and for the same parameter values, since cis and trans-regulators
167
have to coevolve to maintain total expression levels: if trans-regulators cannot evolve, the 168
divergence of cis-regulators is prevented and Y degeneration cannot occur. However, if the 169
intensity of stabilizing selection on expression levels is weak enough, degeneration evolves but is 170
not dosage compensated (Fig 2c). Otherwise, the intensity of stabilizing selection on dosage only 171
plays a marginal role in DRE (Fig 2c). Control simulations without mutation in the coding gene (UG
172
= 0, Fig 2c) show that cis-regulatory divergence and Y silencing can occur even in the absence of 173
deleterious mutations, but as expected, this silencing is slower, not being accelerated by the 174
“haploidization” feedback loop, and reversible (methods, Fig S6). 175
As expected, DRE and DSI combine when more than a single Y-linked gene is considered. The 176
effect is strong: Fig 3 shows that a 50-fold or 500-fold increase in the number of loci results in 177
degeneration being 5-fold and 10-fold faster, respectively: a larger non-recombining Y-linked 178
region degenerates faster than a small one. Without mutation in regulators (i.e. with only DSI), 179
degeneration occurs but is 23-36 fold slower with 50 loci (depending on the control used for the 180
comparison, methods, Fig 4). With 500 loci, however, the comparison with and without regulators 181
is problematic, as very quickly, a modest accumulation of deleterious mutations on the many Y-182
linked genes causes an important reduction in male average fitness, so that male fitness reaches 183
unrealistically low values (of the order 10-17). Even if a proportion of genes affecting male fitness
184
may be under soft selection, it seems unlikely that a population with such a low male fitness 185
would survive. 186
The drop in male fitness is less dramatic with regulatory evolution, as those mutations become 187
progressively more recessive as the Y degenerates. There is nevertheless a transient drop in male 188
average fitness, which can be quite large (e.g. 3% and 85% reduction for a 50-gene and 500-gene 189
Y-linked region, respectively, Fig 3). Data on divergence between sex chromosomes indicate that 190
Y degeneration is often sequential in chiasmate species, with several regions of various sizes, 191
termed “strata” [18], having stopped recombining at different time points. This high transitory 192
fitness drop may prevent large strata from occurring in small populations and may bias towards 193
scenarios involving multiple small strata as, for example, in humans [19]. Comparatively, these 194
8
scenarios involving small strata are more difficult to explain with DSI, as selective interference is 195
weak on small non-recombining regions. 196
Last, degeneration is initially slower but faster overall when there is only one Tm and Tf controlling
197
all cis-regulators. Despite being highly pleiotropically constrained, having only two autosomal 198
trans-regulators precipitates degeneration: the tipping point where it is worth fully silencing the 199
Y is quickly reached when many very weakly deleterious mutations have accumulated on the Y. 200
This is consistent with the observation that dosage compensation can occur locally on a gene-by-201
gene basis or by chromosome-wide trans-acting effects [17]. Intermediate cases involving cis- and 202
trans-regulators with regional effects [as e.g. in Drosophila 20] may be worth investigating, but 203
are likely to behave similarly, as long as trans-regulators only target X genes that have a copy on 204
the Y non-recombining region. 205
Simulations for lower values of mutation rates and strength of selection against deleterious alleles 206
are shown on Fig. S8 (for nL = 1 and nL = 50, methods). Unsurprisingly, reducing mutation rates
207
slows degeneration, while the effect of s is more complicated. However, the acceleration of 208
degeneration caused by regulatory evolution still holds. Fig. S8 also shows that a scaling argument 209
from diffusion theory indicates that larger populations with weaker mutation and selection 210
should also behave similarly, albeit on a longer timescale. 211
The DRE theory proposes a different view of sex-chromosome evolution compared to the DSI 212
theory that has been developed over the past 40 years. In both cases, degeneration starts after 213
the arrest of recombination in a genome region completely linked to the sex-determining locus. 214
In both cases, degeneration is slower in larger populations, but this is considerably less so in the 215
DRE model. However, there are important differences. With very few exceptions [21,22], DSI was 216
developed without explicitly modelling regulatory evolution. With DSI, regulatory evolution (Y 217
silencing and dosage compensation) is supposed to occur only after deleterious mutations have 218
accumulated on the Y [3,23–25], although it has also been proposed that silencing may result 219
directly from the accumulation of deleterious mutations in regulatory regions [13]. This is 220
certainly possible, as selective interference applies to all functional sequences and may contribute 221
to the fixation of many kinds of deleterious mutations, including those maintaining adequate 222
expression levels. DRE is based on a reverse causality: regulatory evolution initiates the 223
9
degeneration process. Contrary to the standard model where compensation is needed because 224
degeneration damages genes’ function in males, compensation evolves here from the very 225
beginning of the process, by reducing the proportion of transcripts from Y-linked relative to X-226
linked alleles and maintaining an almost constant overall level of expression in both sexes. 227
However, compensation may not occur when expression levels are under weak stabilizing 228
selection (Fig 2c). Whether compensation occurs on a gene-by-gene basis or chromosome wide 229
depends on the availability of the corresponding trans-acting factor, but both can occur in DRE, 230
and, surprisingly, at approximately the same rate (Fig 3). 231
The specific mode of dosage compensation depends on the type of trans-regulators. Here we 232
considered trans-regulators with sex-limited expression, which can mimic several well-known 233
dosage compensation systems (female-limited factors corresponding to C. elegans or mammal 234
systems, while male-limited factors would be more similar to a Drosophila-like situation [17], 235
methods). The symmetric DRE model that we used often led to a Drosophila-like compensation, 236
where the X in males was eventually expressed twice as much compared to the situation at the 237
recombination arrest (Fig 2b). However, this is certainly dependent on the relative mutation rates 238
on the different types of trans-regulators. The theory should be extended to examine the diversity 239
of dosage compensation mechanisms, including sex-of-origin effects [26]. 240
Overall, we have presented an alternative theory for the degeneration of sex chromosomes. 241
Although many underlying parameters are still poorly known, this theory could be tested 242
quantitatively, as it works faster than current theory, on smaller non-recombining regions, and 243
does not require small population sizes or recurrent beneficial mutations causing hitchhiking 244
effects. It does not exclude selective interference, which will necessarily co-occur as long as many 245
genes stop recombining simultaneously. However, a hallmark of DRE is that regulatory changes 246
occur very early. This is consistent with recent studies showing that dosage compensation evolves 247
early on [27,28] and that Y transcriptional downregulation accompanies degeneration of protein-248
coding genes from the start [29–31]. 249
10
Acknowledgments
250We thank G. Marais, B and D. Charlesworth, S. P. Otto and two anonymous reviewers for 251
insightful comments. We thank MBB cluster from Labex CEMEB, Harvard Odyssey cluster and 252
CNRS ABiMs cluster. We thank J Wakeley for helping access Odyssey cluster. TL and DR 253
acknowledge Radcliffe Institute, CNRS, and grant GenAsex ANR-17-CE02-0016-01 for support. 254
Author contributions
255Original idea TL, FF; Model conception TL, DR, FF; Code DR, TL, ES; Simulations TL, ES; Data 256
analyses TL; Interpretation TL, DR; First draft TL, FF; Editing TL, DR, ES; Reviews TL, DR; Project 257
management and funding TL. 258
Declaration of interest
259 No conflict of interest 260 261 26211
Fig 1
263264
Fig 1. Model presentation. (a) The simplest genetic model involves autosomal trans-regulators
265
expressed either in males or females, and a sex-linked cis-regulator controlling the expression of 266
a coding gene. A deleterious allele a at the coding gene is expressed at the same level as the wild 267
type A allele if their associated cis-regulators have equal strength. (b) If there is cis-regulatory 268
variation, the deleterious allele may be over or under-expressed, depending on whether it is 269
associated with the stronger or weaker cis-regulator. This can be considered as determining the 270
dominance of the a allele. The black curve shows the fitness of an Aa heterozygote (y-axis) for 271
varying allele-specific expression levels (x-axis). (c) Selection also acts on the total amount of 272
protein produced (x-axis), with stabilizing selection around an optimal amount. The maximal 273
fitness effect of a departure from the optimal amount is smax, the same as the maximal fitness
274
effect of a deleterious mutation in the coding gene. 275
12
Fig 2
276277
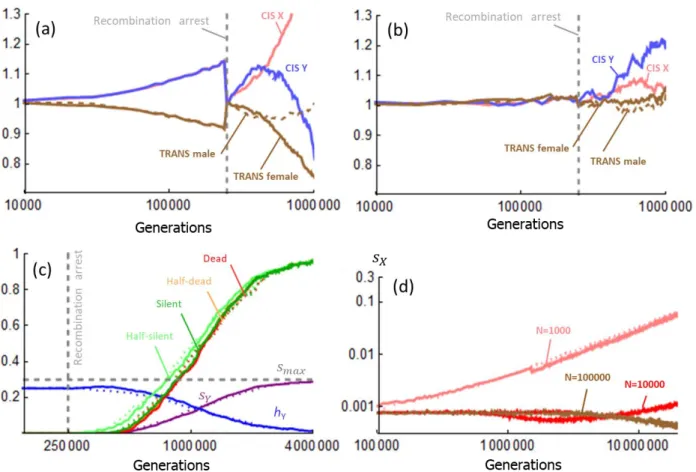
Fig 2. Y degeneration by regulatory evolution. (a) x-axis: time in number of generations, in
log-278
scale. Recombination stops between the X and Y chromosome at generation 250000 (vertical 279
dashed gray line); y-axis: The probability that a coding gene on the Y is expressed at less than half 280
the level of the X copy (half-silent, light green curve), entirely silenced (dark green curve), has 281
accumulated deleterious mutations reducing fitness effect half as much as a loss-of-function 282
mutation (half-dead, orange curve), or as much as a full loss-of-function mutation (dead, red 283
curve). Curves are averages over 100 replicates of the process. The model was run with nL = 1
284
(one gene, one cis-regulator, one female and one male limited trans-regulator). Parameter values 285
are: population size N = 105; Mutation rates U
G, UC = 2 x 10⁻⁴; UT = 10-4 ; recombination rate
286
between the gene and the cis-regulator RC = 5 x 10⁻⁵ (in both sexes during the burn-in period, and
287
in females thereafter). The mean effect of each deleterious mutation in the coding gene smean =
288
0.05 (and loss-of-function effect smax = 0.3, dashed gray line). The dominance coefficient of
13
deleterious mutations (when both alleles are equally expressed) is h = 0.25, and the intensity of 290
stabilizing selection on dosage I = 0.1. The figure also shows the dominance of deleterious 291
mutations carried on the Y (hY, blue curve) and the average fitness effect of alleles on the Y (sY,
292
purple curve). Some individual trajectories are indicated for hY and sY (same color code, thin lines)
293
to show that degeneration occurs abruptly in each replicate. (b) Time-variation of regulatory traits 294
corresponding to the case illustrated in panel a. x-axis: time in number of generations (in log-295
scale); y-axis: regulator trait values. Pink: X cis-regulator strength; Blue: Y cis-regulator strength; 296
Brown: trans-regulator strength (plain: female limited, dashed: male-limited). Optimal dosage is 297
2 (dashed gray line). Total expression in males and females is indicated by the dotted curves (male 298
value in blue, female in red). Regulatory trait values before recombination arrest are not stable 299
due to runaway evolution[14], but are rescaled at 1 at generation 250000 for fair comparisons 300
across parameter values. They are represented at this rescaled value on the figure, to avoid 301
overloading the figure (see methods and Fig S5 for further details). (c) Values of sY, hY and Pdead at
302
generation 3 x 10⁶, for simulations like in panel (a) except for some parameter values. The star
303
indicates weaker stabilizing selection (I =0.01) compared to I = 0.1 in panel (a). NOG (UG = 0); REC
304
(no arrest of recombination); NOCT (UC = UT = 0); NOT (UT = 0); REG (with mutations on gene and
305
regulators, as in panel a); FREE (Rc = 0.5); SYM (symmetrized stabilizing selection function,
306
method). (d) Accumulation of deleterious mutations on the Y for different population sizes (103,
307
104 like in panel a, 105). x-axis: number of generations in log-scale. y-axis: s
Y. Plain lines: with
308
evolving regulators. Dotted lines: without regulator evolution (NOCT simulations, UC = UT = 0).
14
Fig 3
310311
Fig 3. DRE with many loci. Y degeneration in non-recombining regions with nL loci. (a) nL = 50. (b)
312
nL = 500. Coding genes are positioned at regular interval on the X/Y chromosome, each at a
313
recombination rate RG = 5 x 10⁻⁴ (map length of the non-recombining region is therefore 2.5 or 25
314
cM, respectively). Recombination occurs in both sexes during the burn-in period (ending at 2.5 x 315
105 generations, vertical dotted line), and in females thereafter. x-axis: number of generation in
316
log-scale. y-axis: degeneration of the Y, as measured by Pdead, in log-scale (plain lines) or male
317
mean fitness (dashed lines). Red: the nL = 1 case given for comparison. Dark red: nL genes with nL
318
male-limited trans-acting factors and nL female-limited trans acting factors. Brown: nL genes with
319
1 male-limited trans-acting factor and 1 female-limited trans acting factor influencing all cis-320
regulators. Gray: nL genes without regulatory evolution (NOCT simulations, UC = UT = 0). Other
321
parameters are as in Fig 1a. Note the different time range in panels (a) and (b). In the absence of 322
regulatory evolution (NOCT simulations), with nL = 500, male average fitness drops quickly to a
323
vanishingly small number (to the order 10-17 after a million generation) that should lead to
15
population extinction, as indicated by the skull symbol. This drop occurs quickly, even before any 325
appreciable mutation accumulation on genes (i.e. it is already down to the inverse of population 326
size when sY reaches ~0.01).
327
Fig 4
328329
Fig 4. Comparing DRE and DSI. Y degeneration in non-recombining regions with 50 loci. Coding
330
genes are positioned at regular interval on the X/Y chromosome, each at a recombination rate RG
331
= 5 x 10⁻⁴ (map length of the non-recombining region is therefore 2.5 cM). Recombination occurs
332
in both sexes during the burn-in period (ending at 2.5 x 10⁵ generations, vertical dotted line), and
333
in females thereafter. x-axis: number of generations in log-scale. y-axis: degeneration of the Y, as 334
measured by Pdead, in log-scale. Dark red: 50 genes, with 50 cis-regulators, 50 male-limited
trans-335
acting factors and 50 female-limited trans acting factors. Dark red, dashed: 50 genes, with 50 cis-336
regulators, no mutation in trans-regulators (NOT simulations, UT = 0). Gray, dashed: 50 genes,
337
with 50 cis-regulators, no trans-regulators (NOT simulations, UT = 0), but dominance of the effect
338
of mutations on genes maintained at h = 0.25. Gray: 50 genes without regulatory evolution (NOCT 339
simulations, UC = UT = 0). Other parameters are as in Fig 2a.
340 341
16
Star Methods
342 RESOURCE AVAILABILITY 343 Lead Contact 344Further information should be directed to and will be fulfilled by the Lead Contact, Thomas 345 Lenormand ([email protected]). 346 Materials Availability 347 Not applicable 348
Data and Code Availability
349
The code used in this study is available on Github: 350
https://github.com/denisroze/Sex_chromosome_degeneration
351
QUANTIFICATION AND STATISTICAL ANALYSIS
352 Not applicable 353 METHOD DETAILS 354 Model 355
Mutation and selection
356
Mutations in cis and trans regulators are assumed to occur at rates Uc and Ut, respectively, and
357
add a Gaussian deviate to allelic values for these traits (𝑐 + 𝑑𝑐 ~ 𝑁(0, 𝜎𝑐), 𝑡 + 𝑑𝑡 ~ 𝑁(0, 𝜎𝑡)).
358
Negative trait values are counted as zero. These values are used to compute the total and allele-359
specific expression values for each coding gene G. In the following expressions, 1 and 2 denote 360
the two copies of a gene (and its cis-regulator) present in an individual (male or female), where 361
by convention (and without loss of generality) 1 denotes the gene copy carrying deleterious 362
mutations with the strongest overall effect. Mutations present on copy 1 of gene i would decrease 363
fitness by 𝑠1,𝑖 in a homozygous individual, while mutations present on copy 2 would decrease
364
fitness by 𝑠2,𝑖 (𝑠1,𝑖 > 𝑠2,𝑖). The overall fitness effect of deleterious mutations in gene i depends on 365
the cis-regulator strengths associated with alleles 1 and 2, denoted 𝑐1,𝑖 and 𝑐2,𝑖. We assume that
17
the fraction of the protein expressed from allele 1 is 𝜙1,𝑖 = 𝑐1,𝑖⁄(𝑐1,𝑖+ 𝑐2,𝑖), and that the resulting
367
effective dominance coefficient of allele 1 is given by 368
ℎ1,𝑖 = 𝜙1,𝑖−ln(ℎ)/ln(2) (Eq. 1).
369
where h is a parameter measuring the dominance of the fitness effect of deleterious mutations 370
in a heterozygote when both alleles are equally expressed (𝜙1,𝑖 = 1/2 leads to ℎ1,𝑖 = ℎ, see
371
below for a discussion of this and other model assumptions)[14], which will be fixed to 0.25. 372
According to Eq. 1, if allele 1 is relatively more expressed (𝜙1,𝑖 > 1/2), it is assumed to have a
373
larger fitness effect (ℎ1,𝑖 > ℎ). The fitness effect resulting from the presence of deleterious
374
mutations in gene i is then 375
𝑊𝑖𝐺 = 1 − 𝑠2,𝑖− ℎ1,𝑖(𝑠1,𝑖− 𝑠2,𝑖) (Eq. 2).
376
Together, Eq. 1 and 2 link the relative rate of expression 𝜙1,𝑖 of the most deleterious allele present
377
at locus i to the contribution of gene Gi to fitness, illustrated by Fig 1b.
378
In addition to the fitness consequences of carrying deleterious mutations in the coding gene, we 379
also assume that the overall expression level of coding genes is under stabilizing selection with 380
an optimum value 𝑄𝑜𝑝𝑡. In males, the total expression level 𝑄𝑖 equals (𝑐1,𝑖 + 𝑐2,𝑖)𝑡̅𝑚,𝑖, where 𝑡̅𝑚,𝑖is
381
the average strength of the trans-regulators expressed in males, which assumes that both cis- and 382
trans-regulators are essential for proper expression (neither can be zero). Symmetrically, it is 383
(𝑐1,𝑖 + 𝑐2,𝑖)𝑡̅𝑓,𝑖 in females. We assume that ln(𝑄𝑖) is under Gaussian stabilizing selection around
384
ln(𝑄𝑜𝑝𝑡) (with Qopt = 2). We use log-scale to ensure that, irrespective of the intensity of stabilizing
385
selection, the fitness effect of complete regulatory silencing (Qi = 0) would be 𝑠𝑚𝑎𝑥, the maximum
386
permitted fitness effect of deleterious alleles on the coding gene (Fig 1c), which we assume to be 387
the same as the effect of a gene knock-out. Denoting by I the intensity of stabilizing selection on 388
the expression level, the fitness resulting from the departure from optimal dosage 𝑊𝑖𝑄 is 389
𝑊𝑖𝑄 = 1 − 𝑠𝑚𝑎𝑥(1 − 𝑒−𝐼(ln 𝑄𝑖−ln 𝑄𝑜𝑝𝑡)
2
) (Eq. 3).
390
This function is equivalent to assuming that fold-changes in expression levels are under symmetric 391
stabilizing selection, while selection on expression levels Qi is asymmetric (Fig 1c) — in order to
392
investigate whether this asymmetry influenced the results, we also considered a symmetrized 393
18
version of this function (see below). Finally, the overall fitness of an individual was computed as 394
the product over all genes i of 𝑊𝑖𝐺𝑊𝑖𝑄. 395
Dominance
396
The relationship between relative expression and dominance, as given by Eq. 1 is based on several 397
considerations. First, it is reasonable to assume that there is a smooth and monotonic curve 398
relating the relative expression of a deleterious mutation and its dominance. This curve also must 399
include three fixed points with fitness 1, 1-hs, 1-s at 0%, 50%, and 100% relative expression, 400
respectively. Given these constraints, the curve relating relative expression and fitness is perhaps 401
not exactly given by Eq. 1, but with a very similar shape and curvature. In addition, Eq. 2 assumes 402
that the identity of the precise mutation in a given gene does not matter in computing fitness and 403
dominance. For instance, a heterozygous individual carrying two different deleterious mutations 404
at a given gene, each with an effect s, will have a fitness equal to 1-s, i.e. the same fitness than an 405
individual homozygous for the same deleterious mutation with effect s. Finally the value of h = 406
0.25 used throughout is based on observations made in a diversity of systems [see survey in 32]. 407
Effect of mutations
408
We suppose that all mutations occurring on the gene are deleterious. We used an average effect 409
of 0.05 based on direct estimates [see Table 1 in 33]. We used a simple one-parameter 410
exponential distribution to model the diversity of selective effects. Observed distributions of 411
selective effects are similar, especially in absence of beneficial mutations [33]. The model is not 412
considering compensatory mutations in the genes. However, it includes compensatory mutations 413
on regulators, modeled as quantitative traits. In addition, mutations on cis-regulators, by partially 414
silencing the effect of deleterious mutations on the genes, also act as compensatory mutations 415
for mutations in the genes. DRE is based on the fact that they cause a long-lasting compensatory 416
effect, on all future deleterious mutations that will occur on the gene (when a gene becomes 417
partially silenced, all future deleterious on that gene will experience a lower dominance). 418
Although more work is needed to investigate this point in detail, it is unlikely that compensatory 419
mutations in the gene will qualitatively alter the results, as long as they are less frequent than 420
deleterious mutations. Once the expression of a gene on the Y has started decreasing (through 421
19
the evolution of cis and trans regulators), selection becomes less effective on the Y copy of the 422
gene, leading to an accumulation of deleterious alleles, which further favors reduced expression. 423
This accumulation may proceed more slowly due to the occasional fixation of a reverse mutation, 424
but should occur anyway as long as the rate of reverse mutations is weak. Eventually, when a 425
gene becomes nearly completely silenced, back mutations on the gene become irrelevant, as they 426
will have no effect (being also silenced). 427
Cis-regulators runaway
428
For autosomal genes, a ‘regulator runaway’ process occurs that leads to stronger cis-429
regulators to become associated with better purged chromosomes with fewer deleterious 430
mutations [14]. This favors stronger cis-regulatory alleles, provided they are tightly linked to their 431
coding gene. This process occurs during the burn-in phase of all simulations presented here. 432
Consequently, when recombination stops, cis and trans trait values differed from their initial 433
values (arbitrarily set to one for all regulatory traits) to an extent that differed among simulations 434
with different parameter values (notably population sizes, intensity of stabilizing selection), but 435
not between the sexes or sex chromosomes (Figure S5a). To avoid introducing a bias from this 436
burn-in phase effect, we rescaled all regulatory trait values at the arrest of recombination, by 437
dividing them by their average over the whole population. This allows for a better comparison 438
across parameter values and is not biologically consequential as the absolute value of these traits 439
is arbitrary. Fig S5a shows this runaway for the case illustrated in Fig. 2. This trait variation and 440
scaling is not represented on Fig 2 to avoid overloading the figure. While runaway before the 441
arrest of recombination plays no important role, as it does not introduce a sex or sex chromosome 442
bias, we investigated whether it played a role after recombination arrest. At this point, cis-443
regulators on the Y become more tightly linked to their gene, which should cause a higher 444
runaway rate on the Y. We expect this effect to be minor as the rate of runaway shows a plateau 445
towards lower recombination rates [14]. This small asymmetry can be seen immediately following 446
recombination arrest: Y cis-regulator increases slightly faster than X cis-regulator (Fig S5a). This 447
effect is slowing down degeneration as it is initiated by a slight Y relative silencing (which is less 448
likely to occur if Y cis-regulators are on average slightly stronger than X cis-regulators). To confirm 449
this interpretation, we used simulation with larger recombination rate between the cis-regulator 450
20
and the gene. We found indeed that it further delayed degeneration (see results with Rc artificially
451
set to 0.5, Fig 2c, “FREE” simulations). In any case, after this slight initial asymmetry in runaway 452
rates, cis-regulatory divergence between the X and Y takes over. 453
Initial conditions
454
Simulations were set up to ensure that no X-Y or male-female asymmetry occurred during the 455
burn-in period. As explained in the previous paragraph on cis-regulators runaway, there is an 456
inherent instability of regulatory systems based on cis and trans control of gene expression. To 457
allow for possible dosage compensation while X and Y cis-regulators diverge, it is necessary to 458
introduce trans-regulators with male-limited or female-Iimited expression. Introducing only male 459
or female-limited trans-regulators would introduce an initial asymmetry in the runaway process 460
that may cause male-female differences before the arrest of recombination. For instance, if cis-461
regulators runaway can only be compensated by a female-limited trans-regulator, it will lead to a 462
situation where expression is near optimal dosage in females (since the trans-regulator with 463
female-limited expression ensures that expression level stays optimal in females), but would 464
overshoot in males (since no trans-regulators compensate for cis-regulator runaway in males). 465
This initial male overexpression would greatly facilitate Y silencing immediately after 466
recombination arrest, when X and Y cis-regulators can start diverging. Indeed, Y silencing would 467
be directly selected for to correct for this male overexpression. This silencing would reflect this 468
initial unbalanced expression, rather than a mechanism that inherently breaks X and Y symmetry 469
after recombination arrest. The reciprocal initial condition (with only trans-regulator with male-470
limited expression) would on the contrary oppose Y silencing (as overexpression in females would 471
rather tend to decrease X cis-regulator strength, which would lead to stronger Y relative 472
expression in males). To avoid these initial conditions effects, where male female symmetry is 473
broken before recombination arrest, we considered the symmetrical case with both male and 474
female limited trans-regulators. However, this introduce twice as many trans- versus cis 475
mutations, as there are two trans- for one cis-regulator. To avoid introducing a higher mutational 476
variance to trans versus cis-effects, we therefore halved mutation rates on the two trans-477
regulator loci (UC = 2 UT). The absence of cis- versus trans trait bias during the burn-in period is
21
shown on Fig S5b. Overall, we used initial conditions that did not introduce male versus female 479
biases and that did not introduce cis- versus trans-regulators trait biases. 480
Regulatory system instability
481
As soon as recombination stops between the X and Y, cis-regulators can start diverging on the X 482
and Y. This divergence can be compensated for by the corresponding evolution of trans-regulators 483
expressed in males and in females. Hence, X and Y regulatory systems can drift apart even in 484
absence of deleterious mutations in the coding sequences, while maintaining optimal expression 485
levels in both sexes. In the absence of coding sequence degeneration, the regulatory system can 486
however return to X and Y coexpression after a period where only the X or Y was expressed in 487
males. This is not possible when the Y has degenerated as an increased expression of a 488
dysfunctional gene copy cannot be favored back. In addition, the divergence of the regulatory 489
system in absence of deleterious mutations in the coding sequence is slower than when the 490
‘haploidization’ feedback loop occurs. These two effects are illustrated on Fig S4 (see also Fig. 2c, 491
NOG results). 492
Small population sizes
493
If population size become small (Npop = 1000, Fig 2d), Y degeneration can still occur, without DSI
494
or DRE, simply because effective population size of the Y becomes small enough (and smaller than 495
that of the X) to quickly fix deleterious mutations [see [6] for details about this regime]. The 496
asymmetry between the X and the Y results from the lower effective population size of the latter 497
(there are 3 X for one Y in a population with balanced sex-ratio). With small population size, 498
deleterious mutations can also accumulate on the X, for the same reason, although at a much 499
smaller rate (Fig S5d). This may cause population extinction if the non-recombination region is 500
large enough. This mutational meltdown is mitigated if compensatory mutations are included in 501
the model, which is not considered here. 502
Symmetrized stabilizing selection
503
To model stabilizing selection on expression levels, we used Gaussian selection on the log of total 504
expression. We used this log to ensure that, irrespective of the intensity of stabilizing selection, 505
the fitness effect of complete regulatory silencing would be 𝑠𝑚𝑎𝑥, the maximum permitted effect
22
of deleterious alleles on the coding gene. This fitness function introduces an asymmetry on the 507
natural scale for total expression (Fig. 1c). This asymmetry is not biological implausible in most 508
cases. In particular, decreasing expression to zero is likely more deleterious than increasing 509
expression by the same amount. Quite generally, the cost of producing a protein (or the 510
opportunity cost it represents) is likely to be lower than the loss-of-function caused by the 511
shortage of that protein. However, even if biologically plausible, we investigated whether the 512
asymmetry of this fitness function influenced our results. To do so, we used a symmetrized 513
version of the fitness function. 514 515 𝑊𝑖𝑄 = 1 − 𝑠𝑚𝑎𝑥(1 − 𝑒−𝐼(ln 𝑄𝑖−ln 𝑄𝑜𝑝𝑡) 2 ) 𝑖𝑓 𝑄𝑖 < 𝑄𝑜𝑝𝑡 𝑊𝑖𝑄 = 1 − 𝑠𝑚𝑎𝑥(1 − 𝑒−𝐼(ln(2𝑄𝑜𝑝𝑡−𝑄𝑖)−ln 𝑄𝑜𝑝𝑡) 2 ) 𝑖𝑓 𝑄𝑖 > 𝑄𝑜𝑝𝑡 (Eq. 4). 516 517
This fitness function is identical to Eq. 3 when Qi < Qopt, but is reflected around Qi = Qopt for Qi >
518
Qopt. It is not defined for Qi > 2Qopt, which makes it not biologically very plausible. However it is
519
entirely symmetrical around Qi = Qopt , and with identical effects than the function we use on the
520
left of Qopt, i.e. for expression levels corresponding to silencing (Qi < Qopt). With this fitness
521
function, Y degeneration occurs almost identically (Fig 2c, Fig S6), indicating that the specific form 522
of the stabilizing selection function plays a limited role in the process. It also indicates that the 523
fitness effects corresponding to large overexpression plays minimal role. This is expected as the 524
population almost never evolves to such extreme trait value, due to the stabilizing selection 525
around Qopt.
526
Modes of dosage compensation
527
Many different mechanisms of dosage compensation have been described in a diversity of 528
organisms. It is possible to relate these mechanisms to the model we use. Once the Y is fully 529
silenced (𝑐𝑌,𝑖 = 0), and assuming that the population stays at Qopt in both males and females
530
(which is a very good approximation unless stabilizing is very weak), we have 531
23
𝑄𝑜𝑝𝑡 = 𝑐𝑋,𝑖𝑡̅𝑚 = 2𝑐𝑋,𝑖𝑡̅𝑓 (Eq. 5).
533 534
We therefore have 𝑡̅𝑚 = 2𝑡̅𝑓, which defines dosage compensation (Fig S7). Hence the way dosage
535
compensation works, i.e. the triplet (𝑡̅𝑚, 𝑡̅𝑓, 𝑐𝑋,𝑖) can be described by a single parameter. We can
536
choose e.g. to use 𝑡̅𝑚 for this description. Compared to the initial system with 𝑡̅𝑚 = 𝑡̅𝑓= 𝑐𝑋,𝑖 =
537
𝑐𝑌,𝑖 = 1, a final compensation characterized by 𝑡̅𝑚 =1 (i.e. 𝑡̅𝑚 = 1, 𝑡̅𝑓 = 0.5, 𝑐𝑋,𝑖 = 2, 𝑐𝑌,𝑖 = 0 )
538
would correspond to the Caenorhabditis elegans case, where the X is inherently expressed twice 539
as much (𝑐𝑋,𝑖 = 2) to obtain optimal expression in males, while a female-limited trans-regulator
540
halves expression (𝑡̅𝑓 = 0.5) to recover optimal expression in females. This is also very similar to
541
the mammal case where a female-limited trans-regulator halves expression by randomly silencing 542
one X (rather than halving expression of each X like in C. elegans). The case 𝑡̅𝑚 = 2 (i.e. 𝑡̅𝑚=
543
2, 𝑡̅𝑓= 1, 𝑐𝑋,𝑖 = 1, 𝑐𝑌,𝑖 = 0 ) would correspond to the Drosophila case, where a male-limited 544
trans-acting factor doubles X expression to obtain optimal expression in males (nothing being 545
changed in females, 𝑡̅𝑓= 1, 𝑐𝑋,𝑖 = 1). Several other compensation mechanisms may occur, such
546
as trans-acting factors specifically targeting the X or Y in males, based on parent-of-origin imprints 547
[26,but see 34]: indeed, maternal or paternal imprints can easily identify proto-X and proto-Y in 548
males. The current model should be extended to examine this diversity of dosage compensation 549
mechanisms including the possibility of mixture of mechanisms [35]. This extension may also 550
require introducing different types of constraints to stabilize the runaway of cis-regulators, in the 551
period preceding the arrest of recombination, so that the type of compensation could be 552
evaluated against a stable regulatory system. 553
Number of selected loci
554
The quantitative comparison between DRE and DSI is not straightforward as most models of DRI 555
do not involve regulatory loci. At first sight, it might be possible to ‘convert’ cis-regulators into 556
genes exposed to deleterious mutations to make a comparison that would use the same number 557
of selected loci, mutation load and the same genetic map. This is however not trivial, as selective 558
effects on cis-regulators are not directly comparable to those on genes. Regulatory traits are 559
modelled as traits under stabilizing selection, i.e. with deleterious and beneficial mutations, and 560
24
influencing the dominance of mutations on the genes. On Fig. 4, we present two better control 561
cases. The first corresponds to simulations in the absence of mutation in trans-regulators. This is 562
slowing down degeneration by making cis-regulatory divergence more difficult, but the regulatory 563
feedback loop is still present (dashed red curve). However, the effect of cis-divergence on 564
silencing is still present, and this is therefore not representing DSI well. A second control considers 565
the same situation, but where the link between regulatory trait values and dominance of 566
mutation on the genes is artificially removed (setting h constant and equal to 0.25 in HFIX 567
simulations). In this case, regulatory traits are just quantitative traits with no effect on genes, and 568
the simulation therefore has the same number of loci, load and map compared to a full DRE 569
simulation with the regulatory effects removed (gray dashed line). In this case, we observe that 570
degeneration occurs faster than when all regulators are removed, as expected as there are more 571
interfering loci. However, the dynamics are still much slower than when the regulatory feedback 572
loop is occurring. Specifically, it is 23 times slower to reach the time where 50% of genes are 573
degenerate, compared to DRE. 574
Scaling and parameter effects
575
Fig S8 shows additional simulation results for lower values of mutations rates and strength of 576
selection against deleterious mutations, and test a scaling argument from diffusion theory. 577
Mutation rates
578
With smaller mutation rates, all processes are slower. Fig S8a shows results for mutation rates 10 579
times lower. Results show that the dynamics with only one gene are the same, just ten times 580
slower. This scaling holds true for simulations with or without regulators; therefore, all our 581
conclusions remain the same. Results with 50 genes show that degeneration is slowed down by a 582
factor ≈20 when mutation rates are 10 times lower. This scaling also holds for simulations with or 583
without regulators, and thus also leaves our main conclusions unchanged (in particular, regarding 584
the fact that regulatory evolution may considerably accelerate degeneration). The difference in 585
scaling between the 1 and 50 genes cases may be due to the fact that the speed of degeneration 586
caused by selective interference increases faster than linearly with the mutation rate. Since the 587
one-gene case is less impacted by lowering the mutation rate than the 50 locus case, we conclude 588
25
overall that DRE is robust to our assumptions. If anything, it should play a greater role at lower 589
mutation rates, compared with selective interference. 590
Effect of deleterious mutations
591
Fig S8b shows the results of simulations with lower mean effect smean of deleterious mutations.
592
Interpreting the effect of smean is not straightforward, as the fitness effect of deleterious
593
mutations has a non-monotonic effect on the rate of fitness decline in Muller’s ratchet. With 10 594
times lower smean, we find that when regulators evolve, degeneration occurs twice as fast with
595
only one selected gene, but occurs at about the same rate with 50 genes. Simulations without 596
regulatory evolution show a different scaling (degeneration is 10 times faster and 5 times faster 597
with 1 and 50 loci, respectively). This difference in scaling may be expected as with regulator 598
evolution, dominance of the mutations carried on the Y declines, and tends to zero, which makes 599
the dynamics less dependent on smean. In any case, as with the simulations with lower mutation
600
rates, degeneration always occurs much more rapidly in simulations with regulatory evolution 601
than in simulations without. Our main conclusion is thus robust to our choice of parameters, even 602
if quantitative differences can arise with different parameter values. This is to be expected in all 603
cases, as the simulations with regulatory evolution also necessarily include the effect of selective 604
interference. It only adds an extra process that accelerates degeneration. Degeneration by 605
regulation can occur ‘alone’ (as in the 1 locus simulations), but it will necessarily combine and add 606
to selective interference in other cases. 607
Scalings
608
From diffusion theory, one expects that allele frequency dynamics should be roughly insensitive 609
to population size, as long as the product of population size Npop with the other parameters
610
(mutations rates, strength of selection, etc.) remains constant, and when time is measured in 611
units of Npop generations (provided that Npop is sufficiently large, while mutation and selection are
612
sufficiently weak). This scaling argument is interesting, as it indicates that the behaviour of very 613
large populations (that could not be simulated in a reasonable amount of time) can be deduced 614
from simulations of smaller populations [e.g. 36]. In order to test if such a scaling may hold in our 615
model, we compared simulations with Npop = 1000 and our default parameter values (REG
26
simulations) with simulations with Npop = 10000, and where the values of the parameters σC, σT,
617
s, I, Ug, Uc, Utm, Utf, Rg and Rc were divided by 10, so that the product between Npop and these
618
parameters stayed constant (SCAL simulations). The results show that SCAL simulations are 619
comparable but about 100 times slower on the accumulation of deleterious mutations on the Y 620
(10x caused by the scaling of time expressed in units of Npop generations, and 10x caused by the
621
scaling of the variable measured Npop sY). This scaling works for SCAL simulations with 1 or 50
622
genes, suggesting that our results may be extrapolated to other parameter combinations, 623
provided the products of deterministic parameters with Npop are kept constant.
624 625 626
27
KEY RESOURCES TABLE
627
Software and Algorithms
C++ Simulations This paper https://github.com/denisroze/Sex_chromosome_degenerat
ion Mersenne
Twister random number generator
M. Matsumoto and T. Nishimura (1998). Mersenne Twister: A 623-dimensionally equidistributed uniform pseudorandom number generator. ACM Trans. on Modeling and Computer Simulation 8:3-30
http://www.math.sci.hiroshima-u.ac.jp/~m-mat/MT/VERSIONS/C-LANG/MersenneTwister.h 628
Supplementary Fig S5
629 630Fig S5. Control simulations. (a) Cis-regulator runaway during the burn-in phase. Variation of
631
regulatory traits corresponding to the case illustrated in Fig 2, zooming on the burn-in phase. 632
Regulatory trait values are rescaled to one at the arrest of recombination (Generation 250 000) 633
for a fair comparison across simulations with different parameter values. Before recombination 634
arrest, cis-regulator strength tends to increase while trans-regulator strength decreases 635
28
(achieving the same overall expression level). These variations are however symmetric for the 636
regulators on the X and Y, and for female limited or male limited trans-regulators. Pink: X cis-637
regulator strength; Blue: Y cis-regulator strength; Brown: trans-regulator strength (plain: female 638
limited, dashed: male-limited). (b) Cis- and trans-regulator evolution in absence of deleterious 639
mutations in the gene. Variation of regulatory traits corresponding to the case illustrated in (a), 640
except that UG = 0. Pink: X cis-regulator strength; Blue: Y cis-regulator strength; Brown:
trans-641
regulator strength plain: female limited, dashed: male-limited. (c) Y degeneration under 642
regulatory evolution. Same as Figure 2a. Plain line correspond to simulations using Eq. 2 for 643
stabilizing selection, while dotted lines use the symmetrized version given in Eq. 4. (d) 644
Accumulation of deleterious mutations on the X for different population sizes (103, 104, 105).
645
Same parameter values than in Fig 2. x-axis number of generations in log-scale. y-axis: sX. Plain
646
lines: with evolving regulators. Dotted lines: without regulator evolution (NOCT simulations, UC =
647
UT = 0), but both are confounded at each population size.
648 649
29
30
Supplementary Fig S6
651652
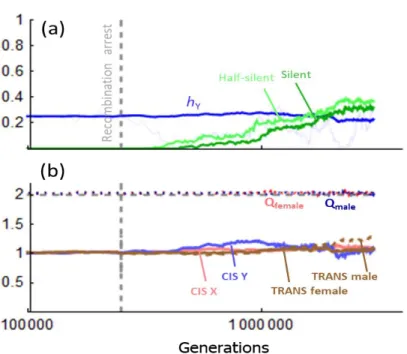
Fig S6. Regulatory system instability. Regulatory system instability in absence of deleterious
653
mutation in the coding sequence. Same parameter values than in Fig 2, except that UG = 0. (a)
x-654
axis: time in number of generations, in log-scale. Recombination stops between the X and Y 655
chromosome at generation 250000 (vertical dashed gray line); y-axis: The probability that a 656
coding gene on the Y is expressed at less than half the level of the X copy (half-silent, light green 657
curve), entirely silenced (dark green curve). The figure also shows the dominance of deleterious 658
mutations carried on the Y (hY, blue curve). A particular replicate is added (thin blue line) to show
659
how it can reach hY = 0 and can then rebound with hY > 0. (b) Time-variation of regulatory traits
660
corresponding to the case illustrated in panel a. x-axis: time in number of generations in log-scale; 661
y-axis: regulator trait values. Pink: X cis-regulator strength; Blue: Y cis-regulator strength; Brown: 662
trans-regulator strength plain: female limited, dashed: male-limited. Optimal dosage is 2 (dashed 663
gray line). Total expression in males and females is indicated by the dotted curves (male value in 664
blue, female in red). Note that panel (b) shows averages across replicates. Even if there is no bias 665
in the average regulatory trait values, there is always a chance that at a given time, in a given 666
replicate, the Y is silent. The divergence of cis-regulators corresponds here to a random walk with 667
the only constraint being that the overall level of expression is maintained. 668
31
Supplementary Fig S7
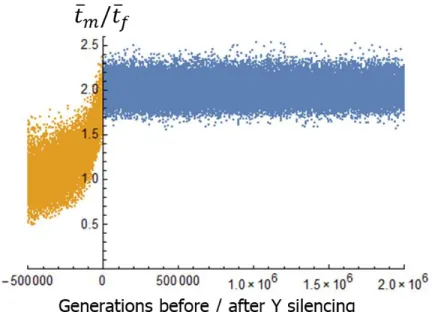
669670
Fig S7. Evolution of dosage compensation. Dosage compensation is measured by the 𝑡̅𝑚/𝑡̅𝑓 ratio
671
(methods). Simulation parameters corresponding to Fig 2a. The data of all replicates are 672
aggregated. x-axis: number of generations after Y silencing (defined as the time at which cY
673
reaches 10-4). Yellow: period before Y silencing. Blue: period after Y silencing.
674 675
32
Supplementary Fig S8
676677
Fig S8 Scaling and parameter values. (a). Simulations with lower mutation rates. y-axis:
678
accumulation of deleterious mutations on the non-recombining region of the Y (sY). Left panel, 1
679
gene simulations; right panel, 50 genes simulations. x-axis: time in generations for REG 680
simulations, but in units of 10 (left panel) or 20 (right panel) generations for LOWM simulations 681
(in reality LOWM simulations are 10 or 20 times slower). Npop =10000 for all simulations. Red: REG
682
simulations as in Fig 2. Orange: NOCT simulations (i.e. simulation without mutations in 683
regulators). LOWM simulations are simulations where mutations rates are divided by 10. (b). 684
Simulations with lower average effect of deleterious mutations in the genes. y-axis: accumulation 685
of deleterious mutations on the non-recombining region of the Y (sY). Left panel, 1 gene