READ THESE TERMS AND CONDITIONS CAREFULLY BEFORE USING THIS WEBSITE. https://nrc-publications.canada.ca/eng/copyright
Vous avez des questions? Nous pouvons vous aider. Pour communiquer directement avec un auteur, consultez la première page de la revue dans laquelle son article a été publié afin de trouver ses coordonnées. Si vous n’arrivez pas à les repérer, communiquez avec nous à [email protected].
Questions? Contact the NRC Publications Archive team at
[email protected]. If you wish to email the authors directly, please see the first page of the publication for their contact information.
NRC Publications Archive
Archives des publications du CNRC
This publication could be one of several versions: author’s original, accepted manuscript or the publisher’s version. / La version de cette publication peut être l’une des suivantes : la version prépublication de l’auteur, la version acceptée du manuscrit ou la version de l’éditeur.
Access and use of this website and the material on it are subject to the Terms and Conditions set forth at
Stress distribution below pavements under trolley bus loadings
Hardy, R. M.; Rivard, P. J.
https://publications-cnrc.canada.ca/fra/droits
L’accès à ce site Web et l’utilisation de son contenu sont assujettis aux conditions présentées dans le site
LISEZ CES CONDITIONS ATTENTIVEMENT AVANT D’UTILISER CE SITE WEB.
NRC Publications Record / Notice d'Archives des publications de CNRC:
https://nrc-publications.canada.ca/eng/view/object/?id=1b66ef10-283a-4535-bae7-78c923faa32c
https://publications-cnrc.canada.ca/fra/voir/objet/?id=1b66ef10-283a-4535-bae7-78c923faa32c
illade i n tile Uniled States of i l ~ n o i c a ,
Reprinted fro111 I'RO r:EDINGS O F TIIE THIRTIETII ANNUAL MEETISG O F T H E HICISWAY RESE.\RCFI
BOARD, December, 1950.
STRESS DISTRIBUTION BELOW PAVEMENTS U N D E R
TROLLEY BUS LOADINGS
ROBERT M. HARDY, Dean and Professor of Civil Engineering AND P. J. RIVARD, Instructor;
University of Alberla SYNOPSIS
Incidental to an investigation of the causes of rapid detcrioration of pave-
ments under Trolley Bus Loadings
Q
the City of Eilmonton a comprehensiveseries of stress measurements in the sub-soil was undertaken. The project was
commenced in 1948 in cooperation with the Kational liesearch Council of Canada
and the City Engineer's Department.
The stress distril~ution below both rigid and flexible pavements under normal
traffic loadings was investigated. The effect of dynamic forces was also assessed. Stresses were measured with U. S. Waterways Esperiment Station pressure cells using automatic recording equipment.
The data indicate that the pressure distribution below the flexible pavement was in close agreement with that computed by the Boussinesq equations of the elastic theory. This is also true of the pressure distribution below the rigid pave-
ment i f the thickness of concrete pavement is replaced by an equivalent thickness
oi soil obtained by multiplying the concrete slab thickness by a constant factor. The effects of impact, braking and acceleration forces were small compared to the stresses produced by static loads.
Many cities have espcrienced rapid deteri- oration of pavements on artcrial streets follo~v- ing loading by trolley bus traffic. The esperi-
ence, since 1945, of t,he City of Edmonton,
Alberta, Canada, is typical of a number of
cities in Western Canada. Both rigid and flesi-
ble typc pavements developed extensive
failures ~vithin a few months, and frequently
within only a few weeks, after being subjected to trollcy bus traffic for the first time. I n some Tiveil cases t h e road surface was old but had b'
satisfactory servicc for m a n y years, in others the surface was practically new.
Failures, in general, have been of the t y p c indicative of inaclequate pavement support, although sonle inslabilitv of the asphalt surface mas notccl, particularly a t the bus stop points. I n Edmonton, vvhere the sub-soil is a clay, the initinl failures invariably developed
a t t h e bus stop points.
An investigation of such fzilures was undcr-
talien i n 19-48 in the City of Edmoiiton by tlw
Civil Engineering Department of the Uni-
versity of Alberta with funds provided by t h e National Research Council of Canada and t h e City Engineer's Department of Edmonton.
Soil
Characteristics-Soil characteristics were surveyed over a stretch of some thirty-five blocks on t h e most heavily travelled bus line. Subgracle strength determinations xere made and the load carrying capacity of the pave- ment was checked with C B R design curves. Table 1 shows a summary of t h e soil properties. A comprehensivc series of stress measurements in the subgrade a t two route stop points was also undertaken. This paper deals primarily with t h e results of the stress measurements a? these are somewhat more general in signifi- cance than t h e results derived from the studv of the local soil properties and moisture conditions.Ilzlli'll I' .l.\'D RIVARD-SOIL S T R E S S E S
397
Stress Iiecording Eqz~iprnent-Pressure cells of
the type tleveloped by the
U.
S. KaterwaysIs:.;periment Station a t Vicksburg (1)' were uscd for stress measurement. These cells gave satisfactory performance when properly built and carefully installed, although it took the hest part of the first season's work t o :~rrive a t the stage where the cells were performing properly and a n adequate teclmiclue was ac- quired for their installation. The cells were calil~rated mith dead weights with a sponge rubber pad placed above and belon the cells.
A typical calibration curve is shown on
Figure 1.
T h e stresses were recorded using a Brush trro
rhanmel oscillograph, lilodel RL-202, ant1 :L
Brush strain analyzer lliodel 13L-310. This equipment gives a n instantaneous ant1 contill- uous record of the stress prorluced on the cell. Typical records are shoiv~i in Figure 2. A total of about 2,000 readiligs n.ere taken
TABLE 1. SOIL PROPIIRTIISS
3Tnximum. .... . . 83
Minimom ... . . . . . . .. . 56
Average for 16 Locations.. . . 66
3faximom. . . . .. . . .. . . 59
Minimum.. . . 30
Average for 16 Locutions.. . . ... . . 46
Range of Field Deter~ninntions for
11 Locat~ons-10.5 nt 14.8 pcrccnt hfoisture T o 3.1 a t 28.3 percent BIoisture. C.U.R.
1
Range of Soaked S a n l p l a FromI
11 Locntions-2.2 . i t -11 percent >loistore. T o 3.7 At 34 {jcrcent Moisture. wit11 approximately equal iiuin1)ers a t each of the two sites investigated.Soil
Projles-The profile a t Locatiori A con-sisted of 24 in. of asphaltic concrete over a n 8)-in. concrete slab laid clirectly on tlie natural subgmdc soil. T h e bottom 2 in. of the concrete slab was badlv deteriorated bv alternate freez- ing and thawing or alkali actiori or a combina- tion of both. For this reason the effective profile was considered t o be 2+ in. of asphaltic concrete over a 6;-in. co~lcrete sl:~b lying on 2 in. of gravel base placed directly on the sub- grade soil. T h e subgrade soil is n glacial de- posit of fairly uniform iiiolgaliic clay with a licluid limit of 57 ant1 a plasticity irltles of 32.
asphalt to11 nele 1:iitl in 1946 :iiitl i o uerc
relatively new. Tn-o thousantl poullcl conclete
mith no air entrainment was used in the slal). The profile a t Location B consistecl of 1: in. of asphaltic concrete over a 7-in. coilcrete slab laid directly on t h e n a t u ~ a l sub-soil. Black top soil t o a depth of 4 t o 6 in. existetl immediately belonr the pavement. The subgrade material below this mas a clay of tlie saine t y p e as : ~ t Location A. The pavement a t this site had been tlolrn fol. more than twenty year>. The
asphalt top was badly crackecl ill :L pattern
typical of inadequate base sul~port. T h c con-
L o a o - / b p . r s q /r?
Figure 1. Calibration Cume-Cell No. 2-Att.20
crete slab was craclietl into blocks wit11 a ~naximuiii surface climension of 4 t o 6 in. and
the bottom 1 in. was badly disintegrated. For
these reasoils the pavement a t Location B mas regartled as a flexible pavenieilt with the broken anrl disintegrated concrete acting only a s a grnvcl I~ase course for the :isphnlt surface.
he
subgrade moisture co~itent -tv:ls about 30percent during testing. Pressure Cell Locations-At eacli locatioil the
~h~ pavement at ~~~~~i~~~ n.as regarded pressure cells Lve1.e placed in a pattern as
as n rigid pavement. The concrete slab and shown in Figure 3. The installation was inadc
from :L hole dug outside the curb. A slot was
1 Italicized figures in refer t o cut into thesoil belowthepaven~ent t o take the
398
SOILSwas backfilled into the slot and thoroughly ticular cell upon which readings were to be tamped to a density exceeding that of the taken, was then nlarked on the pavement and natural soil. The larger hole was also back- subdivided into 6-in. squares. Lines at one-foot filled. A separate installation was made for intervals n7ere also marked along the curb for each position of the pressure cell. a distance of 12 ft. on each side of the cell. A three-foot square, centered over the par- These were used to locate the position of the
VEETICCJ, CELL BELOW A
R E ~ B L E P A v m - m - r
Figure 2. Typical Pressure Patterns
bus n~heels when stopping or starting or mov- ing across the area. Loadings were recorded for the busses operating on theh normal schedule. They moved across the area or were stopped and stnrtecl on directions given t o the drivers.
w
t
f
Trolley Bzts Types-Three models of trolleybus were in operation on the route of the loca-
-=T-
tions,A
andB.
These were designated types I,11,
and111.
Their dead neights were 18,700,HARDY AND RIVARD-SOIL STRESSES
399
distribution in each case was 35 percent on the front axle and 65 percent on the rear axle. In all cases the rear axles carried dual tires with a normal pressure of 65 psi. The front wheel normal tire pressures were 80 psi. All types of
bus had a innximum live load capacity of 88
passengers. Capacity loading only occurred during the morning, noon and evening rush hours and during these periotis pressure cell readings were not taken. The number of pas-
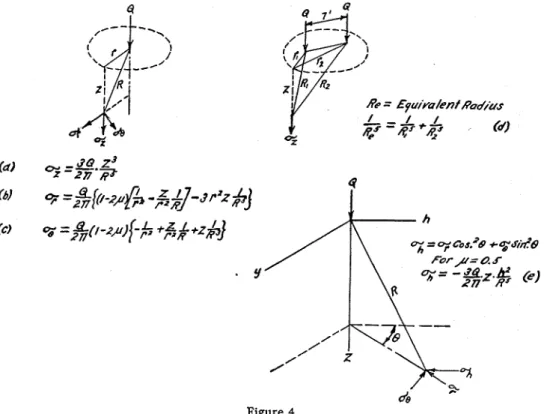
Fle.xible Pavetnent Results-Static Loncls-The
Bo~issincsq equations of the theoryof elasticity
( 2 ) express the stress conditions a t a point within a semi-infinite, elastic, homogeneous and isotropic nleclium having a constant ratio between stress and strain, ant1 loadetl by a perpendicular point load applied to the surface. The pertinent equations are shown in Figure 4. The assumptions upon which the Boussinesq equations are l~ased are of course not com-
Figure 4
sengers on the bus a t each reading mas re- corded. The average mas about twenty.
Two series of readings were taken for each cell location. For the first set the bus travelled continuously across the cell. However, the vehicle in some cases was moving a t a uniform speed and in others was accelerating or decel- erating as the pressure recording mas secured. For the second set the bus inoved through the area of influence of the pressure cell in a series of stops and starts estencling over a distance of 8 to 10 ft. on either side of the cell in the direction of travel. The purpose of the second series of readings was to assess the effect of braking and acceleration forces.
pletely satisfied by a wheel load bearing upon a roadway structure. Nevertheless, it is reason- able as a first approach to compare the re- corded stresses in the subgrade with the theo- retical values computed from the Boussinesq theory.
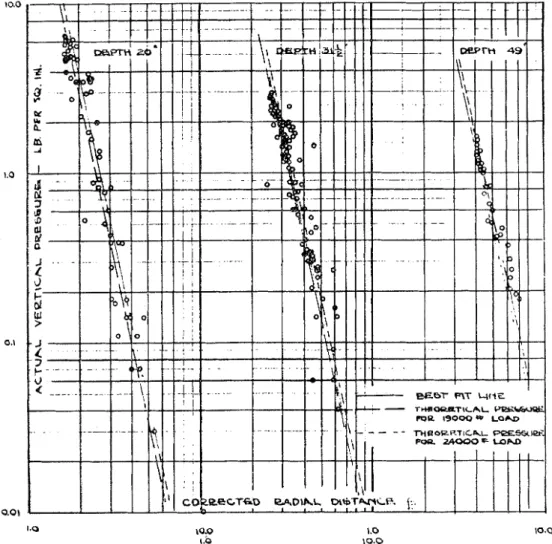
Figure 5 shows logarithmic plots of the recorded static vertical pressure against the cor~.ectecl radial distance for the cell a t depths of 20, 31.5, and 49 in. for front axle loadings a t the flesible pavement site. The corrected radial distance is computed from equation d (Fig. 4) and is made to include the effect of the total asle load, because it was found that in
400
SOILSpressurc on the cell in addition to that of t h e liilc for thc d a t a is produced a s
s
full linc onnear \\,heel. The plotted pressures are tile Figure 5. Thc extreme positions of the plot of
actual cell readings uncorrectetl for variation equation a are also plotted as broken lines for
of type of bus ant1 m:~gnitutle of live load. An minimum a n d maximum values of total bus
:inal!.sis of the tl:~ta sllo~vetl that the cor- \\,eight of 10,000 ant1 24,000 111. respectively,
rections for tllese f:l.ctors were sm:iller in mngnitutle th:in other exl)eri~nent'al errors.
If tllc experin1ent:~l cl:lta s:~tisfy eclu:~tion :I (Fig. 4) cnch of the l ~ l o t s of Figurc 5 slloultl cst:~.l~lisl~ :L str:light line, of slolle -5 anil each
lint shoultl f:dl ~vithin thc ~.:~ngc of tile corre- sporltling plots of equation :I (Fig. 4) fur the prob:~hlc r:lnge in
( 2
values tllie to type of \)us :~ntl :ic:tu:~l live 1o:ltl. T h e hest fit str:~ightFigure G shows similar plots for the cxpcri- mental tla.t:l for thc rear :ixlc lo:~di~lgs :ind Figurc 7 is a lot, for Iiorizontnl pressure. T h e t11eoretic:~l c.m,\.es on Il'igure 'i arc coml)utcd from cq11:~tion c (Fig. 4).
Tlle t l : ~ t : ~ of tllc scvcn plots show^^ 011 Fi'igr~re
5 to i are ill :~greement with t h c Roussiuesc-1 theory within t.11~ limits of esperimc11t:ll error. Thc conclusio~l is justitietl t h a t for tllc flcxiljle
HARDY Ail-D RIT'rlRD-SOIL S'I'RESSES
-10
1type pavement a t Location U tlie sul~grade It is possible t o iiicreasc thc depth to tlie
soil pressures due to static loatls are in ac- cell by a constant a,niou~lt to a new value C
cordance with the Baussinesq theory. such that the loga~.ithnlic plot of recordetl prea-
sure against :in equivalent radial tlistauce
Rigid
Pave7nentResztlls-Static
Loads-For tlie computed for the C: value is a straight line in rigid pa\rement site logarit,limir plots of tlic ('lose agreement, \\-it11 tlie Boussinesq thcory.1.0 10.0 LO 10.0
1.0 10.0
Figure 6. Actual Vertical Pressure Vs. Corrected Radial Distance-Static Load-Rear Wheel -Flexible Pavement
recsol.tletl stntic \-ertic:ll ~ ) r c s s u r ~ against tlic Tliis is t:u~t:lmount to rcl)l:~ci~lg the tl~ick~iess corrected radi:~l tlist,a~lce definctl curved lines of rigid sl:~11 119 a n equiv:llent thickness of soil typically sho\\~n in Figure S. T h e effect of the through \ ~ h i c l l t h e st~.cs!: \\-ill be distributctl in rigid slab in ~cduciiig the unit soil prcssuuc is nc:cortlnucc \\-it11 tho I3oussinesq cqu:ltions. clearly sho\\~n. I t will benoted Ilo\\-ever t l u t tllc For e:rch l~osition of the pressure cell se\-cr:d plot app.onches the t1icoretic:~l I3oussinesq values of the constant C were chosen L L I I ~ plots cur\,c 21s tl!e r:ldia1 t l i s t ~ a ~ i ~ e incre:~scs. n1:ltlc of rccoi~tlctl l)rcssurc : ~ ~ , z i ~ i s t e c j ~ ~ i u l c ~ i t
402
SOILSradial distance as typically shown on Figure 9. show similar plots for the experimental data For each C value a best fit straight line of for front and rear axle loadings and various slope -5 was then drawn through the plottecl positions of the pressure cell.
points. Each plot was then analyzed statisti- Corresponding analyses of the data from the cally and the C value determined for which the pressure cells in the vertical and inclined average root mean square deviation mas a positions are some\vl~at more difficult ancl minimum for the best fit straight line of slope results are not presented here. However, Figure 12 shows plots of the basic data from
Figure 7. Actual Horizontal Pressure Vs. Corrected Radial Distance-Static Load-Ver- tical Cell-Depth 20 in.-Flexible Pavement
-5. This analysis gave values for equivalent thickness of the 61-in. concrete slab of 24, 23
and 25 in. for front ~vhecl loading for the pres- sure cell a t depths of 15, 19, and 31 in. re- spectively.
The extreme positions of the plot of equation a using the equivalent raclial distance corre- sponding to a C value of 4.0 are plotted on Figure 9 as broken lines for minimuin and maximum values of total bus weight of 19,000 and 24,000 lb. respectively. Figures 10 and I 1
Figure 8. Actual Vertical Pressure Vs. Cor- rected Radial Distance-Static Load-Horizon- tal Cell-Rear Wheel-Rigid Pavement-Depth 31 in.
the cell in the horizontal position and also inclined at 45 cleg. with its face pcrpendiculal. to the direction of traffic movement.
It
will be noted that these plots show the effect of the rigid slab sinlilarly to the plots on Figure 9 for the cell horizontal.An anomaly occurred consistently in the l~orizontal pressures nleasured by the cell below the rigid pavement. As will
be
noted on Figure 2 this stress did not show a reduction with the load directly above the cell. In ac- cordance with the Boussinesq theory it should404
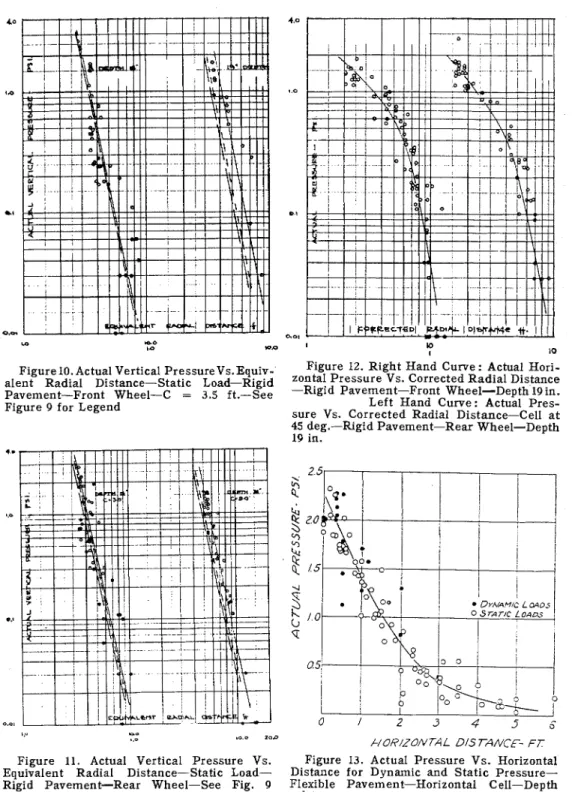
SOILSFigure10.Actual Vertical PressureVs.Equiv- Figure 12. Right Hand Curve : Actual ~ o r i - alent ~~d~~~ Distance-~tatic L~~,.-R~~~,.J zontal Pressure Vs. Corrected Radial Distance Pavement-Front wheel-c = 3.5 f t . - ~ e e -Rigid Pavement-Front Wheel-Depth 19 in.
Figure 9 for Legend Left Hand Curve: Actual Pres-
sure Vs. Corrected Radial Distance-Cell a t 45 deg.-Rigid Pavement-Rear Wheel-Depth
19 in.
Figure 11. Actual Vertical Pressure Vs. Figure 13. Actual Pressure Vs. Horizontal Equivalent Radial Distance-Static Load- Distance for Dynamic and Static Pressure- Rigid Pavement-Rear Wheel-See Fig. 9 Flexible Pavement-Horizontal Cell-Depth
HARDY AND RIVARD-SOIL STRESSES
405
Isezeio for this loading. I-Iowever, ingeneral the clata arc in agrecment with the Boussincsq theory within the limits of esperimental error if the 6i-in. concrete slab is replaccd by an equi.i-:dent, thickness of about 24 in. of soil. Dgnninic Effects-Figure I3 shows a 1)lot of recordecl pressure against horizontal radial distance in which pressures are plotted 110th for wheels passing continuously across the cell and for static loads. No significant difference betnreen thestntic ancl dynamic loadings is evi-
through t h e soil. T h e shock n a v e is sornewhat more severe for t h c flesihle than for the rigid pavement. However, in neither case is therc evidence t h a t t h e shock wave would cause stresses of a magnitude that coulcl result in appreciable overloading of the soil.
Design Significance-Tl~c results of t h e investi- gation are negative t o a certain estent from the point of vicw of solving the local problem in the City of Edmonton. Contr:~ry t o the local
ACTUAL STi? T / C P R E S S U ~ E - P S /
Figure 14. Braking Ratio Vs. Static Pressure -All Positions and Depths of Cell-Rigid Pavement-
Bratrig Ratio Repetiticns
1.0-1.1 149
1.1-1.2 283
1.2-1.2 7
1.3-1.4 0
1.4-1.5 1
dent, Similar plots for other positions of the cell :it Locations A and B also fail to show s significant clifferencc.
Braking ancl dccelcmlio?~ Efec.ts-The pressure records showed no measurable cffect clue to forces of acceleration, but ns shown on Figure 2
the effect of braliing forces is evident. Figurc 14 shows a plot of braliing ratio against static pressurc for t l ~ c rigid pavement location. The braking ratio is the ratio the masimunl pres- sure recordecl during t h e time the bus was brought t o :I stop clividecl b y the pressure
recorded for the bus a t rest.
h
similar plot is shown on Figurc 15 for thc f l c ~ i b l e pavement'
location.I t will be notecl from these plots that the avel age increase in stress due t o braliing forces is only about 5 percent for 110th rigid and flesible pavements.
I-Iowever, i t mill also bc notecl that t l ~ c percentage increase is somewhat larger a t the lowcr unit pressures. This mould appear to be the result of ,z shock wave being transmitted
Figure 15. Braking Ratio Vs. Static Pressurc -All Positions and Depths of Cell-Flexible Pavelnent
Braking Ratio Repetitions
1.0-1.1 126 1.1-1.2 3 0 1.2-1.3 S 1.3-1.4 2 1.4-1.5 2 1.5-1.6 2
opinion braking a n d acceleration forces a r e not major factors in overloading the pavement.
T l ~ e trolley busses when loaded t o capacity constitute a n l a s i n ~ u m loading exceeding by about 30 percent the gross load permitted on t h e high~vays in t h e Province of Alberta. Thc essential cause of the rapid deterioration of thc pavemcnt clue t o the busses appears there- fore to be the heavier loading from t h e busses combined with n much larger frequency of loading ns cornp:tred to normal l ~ e a v y truck traffic using t h e streets. At the bus stops earlier breakdo~vn results due t o t h e fact that the rcpetition of lo:~cl is confined t o a com- parativcly small :Ire;\.
The efiect of t h e overloading b y t h e trolley busses is well il1ustr:ztccl by the fact that using
a "worst" C.B.R.. value of 3 and design curves a s clevcloped by AIcLeod (3) for fles5ble pave- ments, the ~ n a s i n ~ n r n weight of truck per- mitted on the p~ovincial highn-ays requires a thicliness of g l a ~ ~ u l a r base and pavement of 11
inches. On the same basis a trolley b u s loading requires a thickness of 15 inches.
It
is perhaps worthy of comnlent in con- clusion that for these loadings essentially the same design of flexible pavement can be ar- rived a t by selecting a thickness of granular base and pavement such that the maximum shearing stress in the subgrade as computed by the Boussinesq theory is less than an esti- mated mavimum allowable shearing stress in the subgrade. This latter value can be arrived a t with a fair degree of accuracy from a mois- ture content-strength curve determined by a series of unconfined compression tests.Acknowledg?nents-The complete cooperation
of officials of the City Engineer's Department
and the City Transit System of Edmonton greatly facilitated the progress of the field
program. The valuable personal interest of
Mr. R.
F.
Leggett, director, Division of Build-ing Research, National Research Council of
Canada is also acknowledged. The paper is
published hith the approval of the National Research Council of Canada.
REFERENCES
1. "Soil Mechanics Fact Finding Surve.v-
Progrcsv Report, Cooperative Triasial Shear lteseareh Program of the Corps of
Engineers nnd I'ressure Distrit~ution
Theories, Earth Pressure Cell Irivestiga- tioria and I'ressure Distribution Data,"
prepat,ed by Donald W. Taylor and pub-
lished b y Walerways Experime~lt Sta-
tion, Vicltsburg.
2. Terznghi, K., "Theoretical Soil Mechan-
ics," Wiley, 1913.
3. McI,eod, Normun W., ".4irport Runway
Evaluation in Cansdn," Highway Rc- sei~rch Board Research R c p v r l N o . 4-U,