HAL Id: hal-02652615
https://hal.inrae.fr/hal-02652615
Submitted on 29 May 2020
HAL is a multi-disciplinary open access
archive for the deposit and dissemination of
sci-entific research documents, whether they are
pub-lished or not. The documents may come from
teaching and research institutions in France or
abroad, or from public or private research centers.
L’archive ouverte pluridisciplinaire HAL, est
destinée au dépôt et à la diffusion de documents
scientifiques de niveau recherche, publiés ou non,
émanant des établissements d’enseignement et de
recherche français ou étrangers, des laboratoires
publics ou privés.
Distributed under a Creative Commons Attribution - NonCommercial - NoDerivatives| 4.0
International License
embryonic stem cell pluripotency
Diana Coronado, Murielle Godet, Pierre-Yves Bourillot, Yann Tapponnier,
Agnieszka Bernat, Maxime Petit, Marielle Afanassieff, Suzy Markossian, Anna
Malashicheva, Roberto Iacone, et al.
To cite this version:
Diana Coronado, Murielle Godet, Pierre-Yves Bourillot, Yann Tapponnier, Agnieszka Bernat, et al..
A short G1 phase is an intrinsic determinant of naive embryonic stem cell pluripotency. Stem cell
research, Elsevier, 2013, 10 (1), pp.118 - 131. �10.1016/j.scr.2012.10.004�. �hal-02652615�
A short G1 phase is an intrinsic determinant
of naïve embryonic stem cell pluripotency
Diana Coronado
a,b,c, Murielle Godet
a,b,c,e, Pierre-Yves Bourillot
a,b,c,d,
Yann Tapponnier
a,b,c, Agnieszka Bernat
a,b,c,1, Maxime Petit
a,b,c,
Marielle Afanassieff
a,b,c,e, Suzy Markossian
a,b,c,e,
Anna Malashicheva
a,b,c,2, Roberto Iacone
f,3,
Konstantinos Anastassiadis
f, Pierre Savatier
a,b,c,d,e,⁎
aStem Cell and Brain Research Institute, 69500 Bron, France b
Inserm, U846, 18 Avenue Doyen Lepine, 69500 Bron, France c
Université de Lyon 1, 69000 Lyon, France d
Labex DEVweCAN e
INRA, USC 2008, PrimaStem, 69500 Bron, France
fBioInnovations Zentrum, Technische Universitaet Dresden, Tatzberg 47, 01307 Dresden, Germany
Received 10 September 2012; received in revised form 13 October 2012; accepted 13 October 2012 Available online 29 October 2012
Abstract A short G1 phase is a characteristic feature of mouse embryonic stem cells (ESCs). To determine if there is a causal relationship between G1 phase restriction and pluripotency, we made use of the Fluorescence Ubiquitination Cell Cycle Indicator (FUCCI) reporter system to FACS-sort ESCs in the different cell cycle phases. Hence, the G1 phase cells appeared to be more susceptible to differentiation, particularly when ESCs self-renewed in the naïve state of pluripotency. Transitions from ground to naïve, then from naïve to primed states of pluripotency were associated with increased durations of the G1 phase, and cyclin E-mediated alteration of the G1/S transition altered the balance between self-renewal and differentiation. LIF withdrawal resulted in a lengthening of the G1 phase in naïve ESCs, which occurred prior to the appearance of early lineage-specific markers, and could be reversed upon LIF supplementation. We concluded that the short G1 phase observed in murine ESCs was a determinant of naïve pluripotency and was partially under the control of LIF signaling.
Abbreviations: FUCCI, Fluorescence Ubiquitination Cell Cycle Indicator.
⁎ Corresponding author at: INSERM U846, 18 avenue Doyen Lépine, 69500 Bron, France. Fax: +33 472 01 34 61.
E-mail address:pierre.savatier@inserm.fr(P. Savatier).
1Present address: Laboratory of Molecular Diagnostics, Intercollegiate Faculty of Biotechnology, Medical University of Gdansk, Gdansk, Poland.
2Present address: Almazov Federal Heart, Blood and Endocrinology Centre Akkuratova, 2, 197341 Saint-Petersburg, & Department of
Embryology, St. Petersburg State University, Universitetskaya nab., 7/9, St. Petersburg, 199034, Russia.
3Present address: F. Hoffmann-La Roche Ltd., Pharma Research and Early Development, Basel, CVM Discovery, Switzerland.
A v a i l a b l e o n l i n e a t w w w . s c i e n c e d i r e c t . c o m
w w w . e l s e v i e r . c o m / l o c a t e / s c r
1873-5061
http://dx.doi.org/10.1016/j.scr.2012.10.004
© 2012 Elsevier B.V.Open access under CC BY-NC-ND license.
Introduction
Mouse embryonic stem cells (ESCs) are derived from the early epiblast of a pre-implantation blastocyst. They can self-renew in the so-called naïve state of pluripotency by exploiting LIF and BMP4 signaling pathways to block differentiation (Ying et al., 2003). It has been found that blockade of both extracellular regulated kinase (ERK) and glycogen synthase kinase-3 (Gsk3) pathways with selective small molecule inhibitors is sufficient to stabilize and sustain ESC self-renewal in the so-called ground state of pluripotency (Ying et al., 2008). Upon withdrawal of LIF and activation of FGF2 signaling, ESCs acquire the characteristics of Epiblast Stem Cells (EpiSCs) and self-renew in the so-called primed state of pluripotency (Brons et al., 2007; Tesar et al., 2007; Takehara et al., 2011). Ground pluripotency is believed to match the status of the pluripotent stem cells of the inner cell mass (ICM), whereas primed pluripotency may reflect the status of the late epiblast cells of the post-implantation embryo (Nichols and Smith, 2009).
ESCs in the naïve state of pluripotency are rapidly proliferating mammalian cells that exhibit an unusual cell cycle structure characterized by a G1 phase of less than 2 h (Savatier et al., 1994). This short duration is associated with a unique mechanism of cell cycle regulation, which is highlight-ed by lack of MAPK, cyclin D, and pRB control (Jirmanova et al., 2002; Savatier et al., 1996; White et al., 2005), lack of a functional p53–p21 pathway in response to DNA damage (Aladjem et al., 1998), active transcription of E2F target genes, and robust activity of cyclin E-Cdk2 and cyclin A-Cdk2 complexes throughout the cell cycle (Stead et al., 2002; White et al., 2005). As ESCs differentiate, their cell cycle structure drastically changes. A longer duration of the G1 phase results, and the mechanism of cell cycle regulation changes to that typically observed in other mammalian cells including the acquisition of p53- and RB-dependent checkpoints. The reason for the short G1 phase exhibited by ESCs is unclear. It might simply reflect a fundamental requirement of rapid prolifera-tion of epiblast cells to initiate gastrulaprolifera-tion in the developing embryo. However, it is possible that a short G1 phase might be involved in actively sustaining the pluripotent state, as discussed previously (Burdon et al., 2002; Kapinas et al., 2013).
An equally important question is the role of LIF signaling in regulating the ESC cell cycle. Some target genes of the LIF/STAT3 pathway, such as c-myc, Klf4, Klf5, and Pim-1 (Aksoy et al., 2007; Bourillot et al., 2009), participate in regulating the G1-to-S phase transition in differentiated cells and are often deregulated in cancer cells (Bureau et al., 2009; Ghaleb et al., 2005; Shirogane et al., 1999). In mESCs, Klf5 activates the G1/S transition by promoting Akt phosphoryla-tion and inhibiting the kinase inhibitor p21cip1 (Ema et al., 2008). Thus, it remains to be determined whether LIF signaling contributes to the regulation of the G1-to-S phase transition in naïve ESCs.
The Fluorescence Ubiquitination Cell Cycle Indicator (FUCCI) reporter system was developed to monitor cell cycle progres-sion in live cells (Sakaue-Sawano et al., 2008). Using this reporter system, we uncovered the alterations in the cell cycle distributions associated with the transitions between the ground, naïve, and primed pluripotent states. We explored the cell cycle dependency of differentiation commitment in
naïve ESCs and the role of cyclin E in this commitment. We also uncovered the role of LIF in regulating the G1-to-S phase transition.
Material and methods
Plasmid construction and shRNA design
pFUCCI G1 orange and pFUCCI S/G2/M green plasmids (MBL International Corporation, ref AM-VS0605) were digested with XbaI and BamHI. The resulting 1045-bp and 1106-bp fragments containing mKO2:Cdt1(30:120) and hmAG1:Geminin (1:110) coding sequences, respectively, were sub-cloned between the HindIII and BamHI sites in pGAE-CAG-eGFP-WPRE (Wianny et al., 2008) to generate pGAE-mKO2:Cdt1 and pGAE-mAG:Geminin, respectively.
Expression vectors for rat and human cyclin E that were suitable for conditional expression induced by Dox and Dex (Anastassiadis et al., 2002) were generated. Myc-tagged rat cyclin E cDNAs (both WT and S180D mutant) were ampli-fied by PCR from pINDCycEWTand pINDCycES180D, respectively (Matsumoto and Maller, 2004), using primers containing SalI and NotI sites (underlined) (Myc-cycE-SalI-F: 5′-ACGCGTCGAC ACCATGGAGCAAAAGCTCATTTC-3′; Myc-cycE-NotI-R: 5′-AAGG AAAAAAGCGGCCGCTCATTCTGTCTCCTGCTCAC-3′). Human cy-clin E cDNA was amplified by PCR from pCS2cycE1WT(Geng et al., 2007) using the following primers: hCycE1SalIF: 5′-ACG CGTCGACACCATGCCGAGGGAGCGCAGGGAC-3′; hCycE1Not1R: 5′-AAGGAAAAAAGCGGCCGCTCACGCCATTTCCGGCCCGC-3′. The PCR products were subsequently subcloned between the SalI and NotI sites in pSport1-SV40-PolyA to generate pSport1-cDNA plasmids. Similarly, pTet/CMV-INS2-Hygro was digested with SalI and SwaI. The resulting 5046-bp Tet/CMV-INS2-Hygro fragment was subcloned into each pSport1-cDNA plasmid by Red/ET recombination to generate pSport1-tet/CMV-INS2-cDNA-Hygro vectors.
Cyclin E (CycE) shRNA sequences were designed using the siDESIGN®Center application of Dharmacon (http://www. dharmacon.com). shRNA sequences were cloned into pENTRY and tested by transient transfection in CGR8 ESCs. The sequences of the tested shRNAs and interference resulting from transfection of pENTRY-shRNA vectors are given in Supplementary data 1. The selected shRNA sequence and the control scrambled shRNA were subcloned into pLenti6/ BLOCK-iT-PGKneor(Bourillot et al., 2009).
ESC culture, conversion into cEpiSCs, LIF rescue assay and differentiation
CGR8 and the E14tg2a-derivative Rex1GFP-bla/Oct4CFP-puroESC lines (129/Sv strain) were routinely cultured in the absence of feeder cells in Glasgow's Modified Eagle's Medium (GMEM) supplemented with 10% fetal calf serum (PerbioScience CRC0406) and 1000 U/ml of LIF (Savatier et al., 1994; Toyooka et al., 2008). They were also cultured in N2B27 medium supplemented with PD0325901, CHIR99021, and 1000 U/ml LIF (2i/LIF medium). To convert ESCs to cEpiSCs, culture dishes were pre-coated with 15 mg/ml of human fibronectin (Chemicon) for 2 h at 37 °C. Subsequently, 106 ESCs were plated in chemically defined medium (Brons et al., 2007) supplemented with Activin A (10 ng/ml; R&D systems) and
FGF2 (12 ng/ml; R&D systems). After 1 week, cells were treated with 0.1% trypsin-EDTA and the single cell suspension was plated onto a new pre-coated plate. After 1 week, cells were harvested using 0.5 mg/ml collagenase II (Sigma) and plated onto two new plates. During the next 3 weeks, converted ES cells were passaged every 3 days with collagenase treatment at a subculture ratio of 1:3. cEpiSC cell lines were considered to have been established after at least seven passages.
For LIF rescue assays, ES cells were plated at 103cells per gelatin-coated 100-mm tissue culture dish in complete ES cell medium. Cells were exposed to medium without LIF for 12–48 h and subsequently cultured in normal ES cell medium with 1000 U/ml of LIF for 6 days. To detect cells that expressed alkaline phosphatase, dishes were fixed in methanol for 15 min, followed by staining for 15 min with a solution containing 1 mg/ml Fast Red TR saltTM (Sigma) dissolved in 0.1 M Tris, pH 9.2, containing 200 mg/ml naphthol AS-MX phosphate. For each treatment, the percentages of undifferentiated, mixed, and differentiated colonies were determined in triplicate.
To induce differentiation, cells were allowed to aggregate in hanging drops in ES cell medium without LIF (100 cells/drop). After 3 days, EBs were collected and then grown in suspension for 1–7 days in non-adherent Petri dishes.
Production of lentiviral vectors and infection of ESCs
To produce SIV-derived lentivectors, 293 T cells were transfected with a mixture of DNA containing 7.5μg of a pGRev plasmid encoding for the vesicular stomatitis virus glycoprotein (VSV-G) envelope; 4μg of a pSIV3+ plasmid encoding for the gag, pol, tat, and rev proteins; and 11.5μg of vector plasmids using the calcium phosphate precipitation technique. For infection, CGR8 and Rex1GFP-bla/Oct4CFP-puro ESCs were plated at a density of 104cells in 24-well plates in 1 ml of medium containing 100μl of ES cell medium and 900μl of culture supernatant from virus producer cells. After 48 h, ES cells were trypsinized, replated at 104 cells per gelatin-coated 10 mm tissue culture dish, and cultured in complete ES cell medium.
Semi-quantitative and real-time PCR analyses
Total RNA was extracted using RNAeasy kits with on-column DNAse digestion (Qiagen). Reverse transcription was per-formed using M-MLV Reverse Transcriptase (Promega Corp., Madison, WI) and Random Primers (MWG-Biotech AG, Ebersberg, Germany) according to the manufacturer's recom-mendations. PCR reactions were performed with a Perkin-Elmer thermal cycler at 94 °C for 30 s, 55–62 °C (according to primers) for 30 s, and 72 °C for 60 s. Quantitative PCR was performed with Step One Plus thermal cycler (Applied Biosystem) at 94 °C for 45 s, 55 °C for 45 s, and 72 °C for 45 s for 40 cycles with Quantitec SYBR Green (Qiagen). In all cases, the expressions of the target genes were normalized to that ofβ-actin. Primers, annealing tempera-tures, and number of cycles were as described in a previous study (Bourillot et al., 2009). Primer sequences for mouse/ rat cyclin E (mCycE) were 5′-TGGAG TTGATGCAGAAGGTC and
3′-ATGGCTTTCTTTGCTTGGGC. Primer sequences for human cyclin E (hCycE) were 5′-AGCACTTCAGGGGCGTCGC and 3′-CTGGGGAGAGGAGAAGCCC.
Flow cytometry and fluorescence microscopy
Cells were washed with PBS and dissociated by treatment with trypsin-EDTA. For cell cycle analysis, 1·106cells were incubated with 20μl of Hoechst 33342 (SIGMA B2261) in the dark for 30 min at 37 °C. For SSEA1 immunostaining, 5·105 cells were incubated for 15 min at room temperature in GMEM + 10% fetal calf serum. Then 10 to 30 ng of SSEA1-Alexafluor 647 (sc21702, Santa Cruz) antibody was added and cells were further incubated for 30 min at room temperature. Cells were analyzed using a FACS LSR II (Becton-Dickinson) equipped with 355, 488, and 561 nM lasers or were sorted with an Aria cell sorter (Becton-Dickinson) equipped with 405, 488, and 633 nM lasers. Data were acquired and analyzed using DiVa software.
Time-lapse videomicroscopy recording
Cells were grown in a 5% CO2 atmosphere at 37 °C for 24 h in a Pecon incubating chamber placed on a Leica DMIRBE inverted microscope stage. Observations were made with a 20 × objective under halogen illumination and fields were scanned using Metamorph software.
Results
Direct visualization of cell cycle progression using the FUCCI reporter
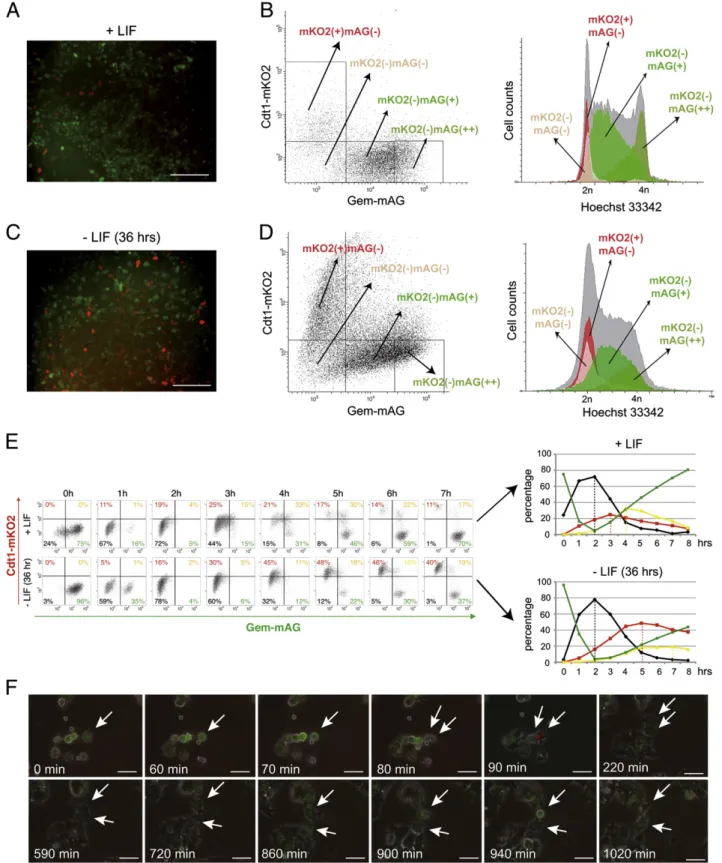
The Fluorescence Ubiquitination Cell Cycle Indicator (FUCCI) reporter system uses two distinct fluorescence-emitting pro-teins to distinguish cells in the G1 phase from those in the other cell cycle phases (Sakaue-Sawano et al., 2008). Thus, it provides for direct visualization of cell cycle progression and FACS sorting. We engineered an ESC line that stably expressed FUCCI reporters. For this purpose, mouse CGR8 ESCs were transduced with two lentiviral vectors that expressed orange-emitting Cdt1-mKO2 and green-emitting Geminin-mAG fusion proteins, both of which were under the control of the robust CAG promoter. One clone (designated ESC–FUCCI) that expressed both fluorescent proteins at high levels was chosen for subsequent studies (Fig. 1A). Flow cytometry analysis for orange and green fluorescence, which was associated with DNA staining with Hoechst, demonstrated the following: (i) 10.4% of ESC–FUCCI cells had a 2n DNA content and no fluorescent signals above background [mKO2(−)mAG(−)], which corresponded to cells in early G1 phase (Fig. 1B); (ii) 9.4% had a 2n DNA content and exhibited an orange fluorescent signal [mKO2(+)mAG(−)], which corresponded to cells progressing toward the G1/S transition; and (iii) 74.8% had a N2n DNA content and expressed a green fluorescent signal [mKO2(−) mAG(+)]. mAG-positive cells that exhibited low green fluores-cence intensity were primarily in the S phase [designated (mKO2(−)mAG(+)) cells], whereas those with strong green fluorescence intensity were primarily in the G2 phase [desig-nated (mKO2(−)mAG(++)) cells]. LIF deprivation for 36 h dramatically increased the percentage of [mKO2(+)mAG(−)]
Figure 1 Generation of pluripotent stem cell lines expressing the FUCCI reporter. (A, C) Representative fluorescence images of ESCs expressing mKO2-hCdt1 and mAG-hGem in the presence of LIF (A) or after LIF withdrawal (C) for 36 h. Scale bar represents 100μM. (B, D) Dot plots of ESC–FUCCI (+LIF) and LIF-deprived ESCs (−LIF 36 h) showing red [mKO2(+)mAG(−)], yellow [mKO2(+)mAG(+)], and green [mKO2(−)mAG(+)] fluorescence. The histograms show the cell cycle position of each cell type after staining with Hoechst 33342 and FACS analysis. (E) Synchronization of ESC–Fucci with colcemid (60 ng/ml for 4 h) followed by their release from the mitotic block. Cells were harvested at different time points and the percentages of [mKO2(−)mAG(−)], [mKO2(+)mAG(−)], [mKO2(+)mAG(+)], and [mKO2(−) mAG(+)] cells were analyzed by flow cytometry. (F) Cell cycle-dependent changes in fluorescence of mKO2-hCdt1 and mAG-hGem in ESC analyzed by time-lapse videomicroscopy. Arrows indicate the tracked cells. Scale bar represents 10μM.
cells, which reflects the lengthening of the G1 phase that accompanies ESC differentiation (Savatier et al., 1994) (Figs. 1C,D).
ESC–FUCCI were synchronized by colcemid treatment for 5 h followed by mitotic shake-off. Between 1 and 8 h after their release from the mitotic block, four successive waves of cells were observed (Fig. 1E): (i) a first wave of [mKO2(−) mAG(−)] cells (early G1); (ii) a second wave of [mKO2(+) mAG(−)] cells (late G1); (iii) a third wave of [mKO2(+) mAG(+)] cells (G1/S transition); and (iv) a fourth wave of [mKO2(−)mAG(+)] cells (S and G2 phases). These observa-tions were consistent with the rapid transition from the G1-to-S phase that characterizes ESCs (Savatier et al., 1994). In a parallel experiment, ESC–FUCCI were deprived of LIF for 36 h prior to synchronization. The first wave of [mKO2(−) mAG(−)] cells peaked at 2 h, as previously observed with LIF-stimulated cells. In contrast, the waves of [mKO2(+) mAG(−)], [mKO2(+)mAG(+)], and [mKO2(−)mAG(+)] cells were delayed, which indicated that LIF withdrawal increased the G1 phase duration and delayed the entry of cells into the S phase. A cell cycle study using time-lapse videomicroscopy revealed transitions from [mKO2(−)mAG(++)] to [mKO2(−) mAG(−)], from [mKO2(−)mAG(−)] to [mKO2(+)mAG(−)], from [mKO2(+)mAG(−)] to [mKO2(+)mAG(+)], and from [mKO2(+) mAG(+)] to [mKO2(−)mAG(+)]. This confirmed the identity of each colored phenotype (Fig. 1F).
G1 phase duration varies according to the pluripotency state
Mouse ESCs display a mosaic expression pattern for the transcription factor Zfp42 (Rex1). Only Rex1+ cells can efficiently colonize the blastocyst and contribute to embry-onic development, a characteristic feature of ESCs in the naïve state of pluripotency (Toyooka et al., 2008). Therefore, a question arised as to whether Rex1+and Rex1−ESCs differed in their cell cycle distributions. To address this issue, we took advantage of the Rex1GFP-bla/Oct4CFP-puro ESC line, which harbors a knock-in of the Green Fluorescent Protein (GFP) and blarselectable genes into Rex1, and a knock-in of the Cyan Fluorescent Protein (CFP) and puror selectable genes into Oct4. Rex1GFP-bla/Oct4CFP-puroESCs were further engineered by lentiviral vector infection to express the orange-emitting Cdt1-mKO2 G1-specific fusion protein. The resulting cell line, Rex1GFP-bla/Oct4CFP-puro/mKO2, was continuously cultured in puromycin to eliminate Oct4−[CFP(−)] cells (Fig. 2A). Ninety percent of the CFP(+) cells exhibited a strong GFP fluores-cence (GFPhigh) and 10% exhibited a weak GFP fluorescence (GFPlow) (Figs. 2A,B). Real-time PCR analysis showed that the GFPlow and GFPhigh phenotypes corresponded to Rex1− and Rex1+cells, respectively. Both expressed Oct4 at similar levels (Fig. 2C). We then determined the percentage of cells that expressed mKO2 in the two cell populations. mKO2(+) cells represented 15% of the GFPlowpopulation and only 0.9% of the GFPhighpopulation (Figs. 2B,D). Moreover, the mean intensity of mKO2-associated fluorescence was significantly higher in Rex1− cells than in Rex1+ cells (Fig. 2B). Together, these observations indicated that a larger fraction of the Oct4+/ Rex1−ESC population was in the G1 phase compared to the Oct4+/Rex1+population.
We next examined the changes in cell cycle distributions associated with the conversion of ESCs into EpiSCs as
paradigms of naïve and primed pluripotency. For this purpose, Rex1GFP-bla/Oct4CFP-puro/mKO2 ESCs were treated with FGF2, activin, and fibronectin (Takehara et al., 2011). After 4 weeks (7 passages), the resulting cEpiSCs displayed the cardinal markers of primed pluripotency, including increased ectoder-mal (Fgf5), mesoderectoder-mal (Eomes, Brachyury), and endoderectoder-mal (GATA6, FoxA2) markers, and the downregulated naïve pluripotency markers (Gbx2, Klf4, PECAM1, and Rex1) (Supplementary data 2). An SSEA1+ sub-population was FACS-sorted from both ESCs and cEpiSCs, and the percentages of mKO2(+) cells in each were determined (Fig. 2E). SSEA1+ cEpiSCs had a dramatically higher percentage of mKO2(+) cells (25%) as compared to SSEA1+ESCs (2.7%). A similar increase in the G1 fraction was observed in the Oct4+ sub-population (17.5% in cEpiSCs vs. 7.8% in ESCs). This indicated that the ESC-to-EpiSC transition was paralleled by an increase in the G1 phase duration. The percentage of mKO2(+) cells decreased in the SSEA1+population to 0.7% when Rex1GFP-bla/Oct4CFP-puro/ mKO2 cells were cultured in N2B27 medium supplemented with MEK (PD0325901) and GSK3β (CHIR99021) inhibitors, which results in ESC self-renewal in the ground state of pluripotency (2i cells). Only rare mKO2(+) cells were observed in the GFP(−) population (Supplementary data 3).
Together, all of these results indicate that a short G1 phase is a characteristic of the ground and naïve pluripotent states, and that spontaneous or induced transition from the naïve state toward primed pluripotency is associated with a lengthening of the G1 phase.
mESCs in the G1 phase have an increased susceptibility to differentiation
We used the ESC–FUCCI line to determine whether the susceptibility of ESCs to retinoic acid (RA)-induced differenti-ation varied according to their position in the cell cycle. ESC– FUCCI were FACS-sorted into three distinct cell populations that corresponded to G1 [R1: mKO2(−)mAG(−)+mKO2(+) mAG(−)], S [R2: mKO2(−)mAG(+)], and G2 [R3: mKO2(−) mAG(++)] cell cycle phases (Fig. 3A). FACS-sorted cells were treated with 10−6and 10−5M RA (or with DMSO alone) for 1 h, cultured for 24 and 48 h in the absence of LIF, and subsequently restimulated with LIF for 5–7 days. This self-renewal assay determines the capacity of ESCs to withstand transient LIF starvation and subsequently, to form alkaline phosphatase-positive (AP+) undifferentiated colonies when plated at clonal density. The percentages of undifferentiated (AP+), mixed (AP+/AP−), and differentiated (AP−) colonies were determined (Figs. 3B,C, and Supplementary data 4). The percentages of mixed and differentiated colonies were significantly increased when cells were treated with 10−6M RA during the G1 phase, as compared to cells that were treated during the other cell cycle phases. At 10−5M, RA treatment during any cell cycle phase resulted in considerably increased percentages of these colonies. Moreover, the effect was more pronounced when cells were treated during the G1 phase. Of note, even without RA treatment, the G1 phase cells produced significantly more mixed and differentiated colonies as compared to the S and G2/M phase cells, which suggested that cells had an increased sensitivity to differentiation when they were transiting through the G1 phase prior to FACS sorting and replating at a low density.
Because Rex1− cells appeared to have a significantly longer G1 phase as compared to Rex1+cells, the increased sensitivity of the G1 phase cells to RA might have resulted
from the accumulation of Rex1− cells. To eliminate this confounding effect of cell population heterogeneity, we sought to eliminate Rex1−cells from the population prior to
A
C
B
D
Topro 3 Oct4CFP Cdt1-mKO2 overlay (- Topro 3)
E
Q1 = 1.5% Q2 = 0.8% Q4 = 89.6% Q3 = 8.1% Rex1-GFP Cdt1-mKO2Rex1GFP-Oct4CFP-mKO2
CFP GFP
mKO2 Merge
CFP GFP
mKO2 Merge Merge
GFP CFP mKO2 Rex1-GFP Cdt1-mKO2 0.2% 0.5% 15.9% 83.4% Rex1-GFP Cdt1-mKO2 0.1% 0.6% 2.6% 96.8% Rex1-GFP Cdt1-mKO2 25% 75% 0% 0% Sorting SSEA1+ cells Counting Oct4+ cells Sorting SSEA1+ cells Counting Oct4+ cells Sorting SSEA1+ cells Counting Oct4+ cells 2.7% mKO2+ 7.8% mKO2+ 17.5% mKO2+ 2 0 l e v el A N R Rex1 Oct4 1 3 2 0 1 3 Q1 Q3 Q2 Q4 Q1 Q3 Q2 Q4 GFP Low GFP High st n u o c ll e C Hoechst 33342 mKO2 (15%) mKO2 (0.9%) GFPLow GFPHigh
Rex1GFP-Oct4CFP-mKO2
(ground state)
Rex1GFP-Oct4CFP-mKO2
(ESC)
Rex1GFP-Oct4CFP-mKO2
(cEpiSc)
Rex1GFP
Figure 2 G1 phase duration varies according to the pluripotent state. (A) Representative fluorescence images of undifferentiated Rex1GFP-bla/Oct4CFP-puro/mKO2 ESCs that expressed CFP (blue), GFP (green), and mKO2 (red). (B) Dot plot of Rex1GFP-bla/Oct4CFP-puro/ mKO2 ESCs showing GFP fluorescence associated with Rex1 expression and red fluorescence associated with mKO2 expression, analyzed by flow cytometry. (C) Histograms for the mRNA levels of Oct4 and Rex1 analyzed by real-time PCR in each fraction. (D) Histograms showing the cell cycle positions of the GFPlow/mKO2(+), GFPhigh/mKO2(+), GFPlow/mKO2(−), and GFPHigh/mKO2(−)
fractions after staining with Hoechst 33342. (E) Upper panels: representative fluorescence images of Rex1GFP-bla/Oct4CFP-puro/mKO2
ESCs cultured in conditions with 2i/LIF (left panel), conditions with LIF + FCS (central panel), and after conversion into cEpiSCs (right panel). Bottom panels: dot plot of SSEA1+ Rex1GFP-bla/Oct4CFP-puro/mKO2 cells showing GFP fluorescence associated with Rex1
the RA assay. For this purpose, Rex1GFP-bla/Oct4CFP-puro/ mKO2 were sorted into four distinct cell populations that corresponded to S/G2/M Rex1− cells [P1: mKO2(−)GFPlow], G1 Rex1− cells [P2: mKO2(+)GFPlow], S/G2/M Rex1+ cells [P3: mKO2(−)GFPhigh], and G1 Rex1+ cells [P4: mKO2(+) GFPhigh] (Fig. 3D). The sorted cells were treated with 10−6M RA for 1 h and subsequently analyzed with the LIF rescue assay. The percentages of mixed and differentiated colonies were significantly increased when GFPhighcells were treated with 10−6M RA during the G1 phase as compared to similar cells treated during the other cell cycle phases (Figs. 3E,F). Moreover, the clonogenicity of the G1 phase GFPhigh cells was significantly reduced (pb0.001) as compared with the GFPhigh cells in the other cell cycle phases (Fig. 3G). The same held true for GFPlow cells (Rex1−), which exhibited both an increased sensitivity to 10−6M RA and a reduced clonogenicity while transiting through the G1 phase as compared with the other cell cycle phases. Collectively, these results indicated that Rex1+ naïve pluripotent stem cells became highly susceptible to commitment to differen-tiation when transiting through the G1 phase.
Cyclin E-mediated alteration of the G1/S transition alters the balance between self-renewal
and differentiation
Overexpression of cyclin E, encoded by the CycE gene, activity causes cells to progress through the G1 phase more rapidly and prematurely enter S-phase (Ohtsubo and Roberts, 1993; Resnitzky et al., 1994). Previous results have clearly shown that cyclin E-Cdk2 inhibition delays S phase entry (Ohtsubo et al., 1995; Tsai et al., 1993; van den Heuvel and Harlow, 1993). Based on our observations that the G1 phase provided a window of increased sensitivity to differentiation inducers, we assumed that overexpression of cyclin E would result in reinforced self-renewal, whereas knockdown of cyclin E would facilitate differentiation. To address this issue, ESCs were co-electroporated with the following plasmids: CAG-irtetR-VP16-GBD*-IRES-puro, a plasmid expressing a dexa-methasone (Dex)-dependent rtTA (Anastassiadis et al., 2011); pSport1-tetCMVratCycEWTpA-INS-Hygro [expressing a rat wild-type (WT) cyclin E cDNA); pSport1-tetCMVratCycES180D pA-INS-Hygro (expressing a mutant form of rat cyclin E
with a S180D mutation that abolishes binding of cyclin E to Cdk2 (Matsumoto and Maller, 2004); and pSport1-tetCMVhumCycEWTpA-INS-Hygro (expressing a human WT cyclin E cDNA). Each of these was under the control of the doxycyclin (Dox) inducible promoter tetCMV. Stably transfected cells were selected with appropriate antibiotics, and dually resistant clones were analyzed by real-time PCR to determine Dox/Dex-induced expression of WT or mutant cyclin E. Two clones, ESC-IND_ratCycEWT and ESC-IND_ ratCycES180D, exhibited a 60- and 20-fold increase in CycE RNA levels, respectively, as determined by qPCR using rat CycE-specific primers (Figs. 4A,B). They exhibited a 2.5- and 2-fold increase in CycE RNA levels, respectively, using primers that matched both mouse and rat CycE. The third clone, ESC-IND_humCycEWT, exhibited an 18-fold increase in human Cyclin E RNA levels, as determined by qPCR using human CycE-specific primers. Robust expression of human cyclin E after treatment with Dox/Dex was confirmed by immunostaining (Fig. 4C). All three clones were analyzed with a LIF rescue assay. Dox/Dex-treated ESC-IND_ratCycEWT produced a sig-nificantly higher percentage of undifferentiated colonies as compared to untreated cells, both in the presence of LIF and after LIF deprivation for 12, 24, 36, and 48 h (Fig. 4D). Dox/ Dex-treated ESC-IND_humCycEWTproduced similar results. Of note, the overexpression of human cyclin E reduced the percentage of differentiated colonies by 2.5-fold upon LIF starvation for 48 h. In contrast, Dox/Dex-treated and -untreated ESC-IND_ratCycES180D exhibited no significant differences in their yields of undifferentiated colonies at all time points analyzed. Together, these results indicated that overexpression of cyclin E resulted in harnessing self-renewal and delaying the commitment to differentiation.
To further evaluate the role of cyclin E in the stabilization of the undifferentiated state, we knocked down cyclin E expression in ESC–FUCCI, by means of an interfering lentiviral vector expressing a CycE shRNA. A 5-fold reduction in CycE mRNA level, as compared to cells infected with the control vector (sh-scrambled), was observed after selection with G418 to kill the non-infected cells (Fig. 4E). ESC–FUCCI–shCycE cells formed smaller colonies, which could be explained by an increase in the G1 phase duration (26% of mKO2(+) cells in ESC–FUCCI–shCycE cells vs. 17% in control cells) (Fig. 4E).
When ESC–FUCCI–shCycE were induced to differentiate by EB formation, we observed both the reduced expression of
Figure 3 Cell-cycle dependency on RA-induced differentiation. (A) FACS sorting of ESC–Fucci in three distinct fractions, R1 [mKO2(−) mAG(−)+mKO2(+)mAG(−)], R2 [mKO2(−)mAG(+)], and R3 [mKO2(−)mAG(++)], corresponding to cells in the G1, S, and G2/M phases, respectively. (B) Histogram for the percentages of undifferentiated (blue), mixed (red), and differentiated (yellow) colonies observed in a LIF rescue assay after treatment with 0, 10−6, and 10−5M retinoic acid for 1 h, followed by plating on gelatin-coated dishes at a density of 100 cells/cm2. The duration of LIF starvation varied from 0 to 48 h, as indicated. (D) FACS sorting of Rex1GFP-bla/Oct4CFP-puro/mKO2 ESCs in four distinct fractions, P1 [GFPlow/mKO2(−)], P2 [GFPlow/mKO2(+)], P3 [GFPhigh/mKO2(−)], and P4 [GFPHigh/mKO2(+)], corresponding to Rex1−/
S-G2-M, Rex1−/G1, Rex1+/S-G2-M, and Rex1+/G1 cells, respectively. (E) Histogram for the percentages of undifferentiated (blue), mixed (red), and differentiated (yellow) colonies observed in a LIF rescue assay after treatment with 10−6M retinoic acid for 1 h, followed by plating on gelatin-coated dishes at a density of 100 cells/cm2. The duration of LIF starvation varied from 0 to 48 h, as indicated. (G) Histogram for the clonogenicity of each fraction after plating at a density of 100 cells/cm2. (C,F) Box-and-whiskers plot showing the median (line inside
the box) and the first and third quartiles (lower and upper edges of the box); the whiskers indicate the lowest and highest values within 1.5 times the interquartile range. Because the box plots limits overlapped and to confirm the tendency observed, we used a general linear model to quantify the effects of cell cycle phase on the percentages of differentiated colonies. *, pb0.05; **, pb0.01; ***, pb0.001. (B,E,G) Means and standard errors were determined from three replicates.
pluripotency markers Oct4 and Nanog and the advanced up-regulation of the endodermal markers GATA4, GATA6 and Sox17, as compared to control cells (Fig. 4F). Notably, the ectodermal markers Fgf5 and Nestin were expressed at lower levels in EBs made from ESC–FUCCI–shCycE, suggesting that
knockdown of cyclin E expression induced differentiation toward extra-embryonic endoderm at the expense of ecto-dermal derivatives. Together, these results indicate that the cyclin E level is rate-limiting during the G1-to-S phase transition and opposes the differentiation of naïve ESCs.
A
B
RA (1 hr) Undifferentiated colonies G1 S G2 G1 S G2 G1 S G2 0h 24h 48h 0 M retinoic acid LIF starvation 80 60 40 20 0 e g at n e cr e P 100 G1 S G2 G1 S G2 G1 S G2 0h 24h 48h 10-6 M retinoic acid LIF starvation 80 60 40 20 0 e g at n e cr e P 100 G1 S G2 G1 S G2 G1 S G2 0h 24h 48h 10-5 M retinoic acid LIF starvation 80 60 40 20 0 e g at n e cr e P 100 Differentiated coloniesD
R1 R2 R3 R1 R2 R3 P1 P3 R3 P4 P2 G1 S G2/MC
F
G1 (Rex1-) S/G2/M (Rex1-) G1 (Rex1+) RA (1 hr) S/G2/M (Rex1+) Undifferentiated colonies Mixed colonies Dfferentiated coloniesG
P1 P2 P3 P4E
h si d m c 0 1/ s ei n ol o c f o r b n Clonogenicity % dif ferentiated colonies S+G2/M (Rex1-) G1 (Rex1-) S+G2/M (Rex1+) G1 (Rex1+) % dif ferentiated colonies Gem-mAG 2 O K m-1t d C 10 3 10 4 10 5 10 3 10 4 10 5 10 2 0 10 2 10 3 10 4 10 5 10 5 10 4 10 3 10 2 0 10 5 10 4 10 3 10 2 0 0 10 2 10 3 10 4 10 5 0 10 2 10 3 10 4 10 5 2 O K m-1t d C Rex1-GFP LIF starvation 10-6 M retinoic acid 0 20 40 60 80 100 P1 P2 P3 P4 P1 P2 P3 P4 P1 P2 P3 P4 0h 24h 48h e g at n e cr e P 0 200 400 600 800 1000 1200 1400 P1 P2 P3 P4 P1 P2 P3 P4 P1 P2 P3 P4 0h 24h 48h 0 0 0 0 0 0 0 0 0 0 0 0 0 0 0 0 0 mixed colonies 10 5 10 4 10 3 10 2 0 *** *** 80 60 40 20 0 100 80 60 40 100 G1 S G2/M * ** ESC-FUCCILengthening of the G1 phase is an early, reversible response to LIF withdrawal
Withdrawing LIF from the ESC culture medium results in the lengthening of the G1 phase. Whether this process takes place before or after irreversible commitment to differentiation is an important issue for understanding the functional relation-ship between cell cycle regulation and self-renewal in ESCs. To address this issue, ESC–FUCCI were LIF-deprived for 24, 36, and 48 h, and then restimulated with LIF for 12, 24, 36, and 48 h. The percentages of G1 phase ESCs [(mKO2(+)mAG(−)) phenotype] increased by 1.23-, 1.74-, and 2.27-fold upon LIF deprivation for 24, 36, and 48 h, respectively (Figs. 5A,B). After stimulation with LIF for 12 h, these percentages further increased by 2.2-, 1.56-, and 1.23-fold (after LIF starvation for 24, 36, and 48 h, respectively), and then progressively returned to their original levels after 48 h of stimulation. The observed 12-h delay to achieve a maximum lengthening of the G1 phase might have reflected the duration of the entire cell cycle, as each cell had to pass through the G1 phase before undergoing cell cycle acceleration. Of note, after LIF starvation for 36 and 48 h, followed by restimulation for 48 h, many cells continued to accumulate mKO2 protein and went off-scale on the contour plots. These were most likely cells that were irreversibly committed to differentiation, and therefore failed to re-accelerate G1 phase transit upon LIF restimulation. This interpretation was supported by the observation that following LIF starvation for 36 and 48 h and despite restimulation with LIF, an increased number of cells exhibited a [mKO2(+)mAG(+)] phenotype that characterized differentiating cells (seeFig. 1D). The transient lengthening of the G1 phase was paralleled by transient alterations in gene expression patterns; specifically, there were decreased expres-sions of pluripotency markers (Oct4, Nanog, and Rex1) and increased expressions of lineage-specific markers (Brachyury, Fgf5, and sox17) (Fig. 5C). Overall, these markers returned to their original levels after LIF stimulation. However, after 36 and 48 h of LIF starvation followed by restimulation for 48 h, the expressions of Brachyury, Fgf5, and sox17 did not return to their original levels, which indicated that many cells had been irreversibly committed to differentiation. Based on these results, we concluded that lengthening of the G1 phase is an early, reversible response to LIF starvation that takes place prior to commitment to differentiation.
LIF regulates G1 phase progression in the Rex1+ naïve cell population
The observed changes in G1 phase duration following LIF starvation might have resulted from a transient increase in the percentage of Rex1− cells in the population. Therefore, to eliminate the confounding effect of varying Rex1+/Rex1− ratios, we used the Rex1GFP-bla/Oct4CFP-puro/mKO2 ESC line to study the cell cycle response of Rex1+ESCs to LIF stimulation. Rex1GFP-bla/Oct4CFP-puro/mKO2 cells were LIF-deprived for 24 h, and then restimulated with LIF for 12, 24, 36, and 48 h (Fig. 6A). LIF starvation resulted in a 4.4-fold increase in the percentage of Rex1−cells, which returned to normal after LIF stimulation for 48 h (Fig. 6B). Consistent with the data obtained with ESC–FUCCI, the percentage of Rex1+ ESCs with a [mKO2(+)] phenotype increased by 2.8-fold upon LIF
deprivation for 24 h, and then returned to its original level after 24 h of LIF restimulation (Fig. 6C). In contrast, the percentage of Rex1− ESCs that expressed a [mKO2(+)] phenotype only increased by 1.3-fold after LIF deprivation. These results indicated that stimulation with LIF signaling resulted in a considerable decrease in the G1 phase duration in the Rex1+ESC sub-population, and to a much lesser extent in the Rex1−ESC sub-population.
In order to match the observed changes in G1 phase duration with alterations in gene expression patterns in the Rex1+cell population, the GFPhighpopulation (comprising mKO2-positive and -negative cells) was sorted by FACS, and the expressions of pluripotency and lineage-specific markers were analyzed by quantitative RT-PCR (Figs. 6D,E). Only Nanog and Fgf5 exhibited significant changes in their expression levels among the six genes that were tested. In contrast, the levels of expressions of Oct4, Brachyury, and Sox17 remained constant. Thus, our results indicate that lengthening of the G1 phase is an early response to LIF withdrawal that takes place either shortly before or concomitantly with the transient activation of early lineage-specific markers in the Oct4+/Rex1+ naïve cell population.
Discussion
Our results show that a short G1 phase duration results from the activity of LIF signaling and that this short duration contributes to the maintenance of the naïve pluripotent state. We have presented the following five independent lines of evidence to support these conclusions: (i) the G1 phase duration increases as ESCs transit from the naïve pluripotent state to the primed state; (ii) the G1 phase of naïve ESCs is a phase of increased susceptibility to differentiation; (iii) overexpression of the G1-to-S phase transition-promoting cyclin E1 enhances self-renewal, whereas knocking down endogenous cyclin E1 expres-sion results in lengthening of the G1 phase and spontaneous differentiation; and (iv) LIF signaling regulates the G1 phase duration in naïve ESCs.
FUCCI expression reveals somatic-like activities of APCcdh1 and SCFskp2 ubiquitination complexes in ESCs
It has been reported that the levels of major APC/C substrates, including Geminin, remain nearly constant during the plurip-otent cell cycle (Fujii-Yamamoto et al., 2005; Yang et al., 2011). Our findings that the Geminin-mAG fusion protein was only expressed during the S and G2 phases and disappeared during the M and G1 phases, thus following a somatic-like pattern of expression, indicate that these previous conclusions were incorrect. A recent study had already questioned these conclusions by presenting a finding of the loss of Geminin expression during G1 transit in synchronized ESCs (Ballabeni et al., 2011). Our data corroborates this finding, using an experimental paradigm that does not require cell synchroni-zation. We also showed that mKO2 expression was observed only in ESCs with a 2n DNA content. This was rapidly degraded during the G1-to-S phase transition, which demonstrated that SCFskp2ubiquitination complexes were active throughout the S and G2/M phases. The Cdt1-mKO2 fusion protein is expressed at low levels in naïve ESCs. These levels moderately increase
as naïve cells convert to the primed pluripotent state and dramatically increase when they differentiate upon LIF withdrawal. We can explain these increases in
mKO2-associated fluorescence by the accumulation of the red fluorescence probe during G1 phase progression. Thus, the longer the G1 phase, the stronger is the mKO2-associated
B
C
D
80 60 40 20 0 100Duration of LIF starvation
0h 12h 24h 36h 48h
0h 12h 24h 36h 48h
Duration of LIF starvation
80 60 40 20 0 100
Duration of LIF starvation
0h 12h 24h 36h 48h 80 60 40 20 0 100
- Dox/Dex+ Dox/Dex - Dox/Dex+ Dox/Dex
ESC-IND_ ratCycEWT ESC-IND_ ratCycES180D ESC-IND_ratCycEWT ESC-IND_ratCycES180D Differentiated colonies Mixed colonies Undifferentiated colonies - Dox/Dex + Dox/Dex - Dox/Dex + Dox/Dex - Dox/Dex + Dox/Dex ESC-IND_ humCycEWT ESC-IND_humCycEWT % % % 0 1 2 3 4 0 5 10 15 20 - Dox/Dex+ Dox/Dex DAPI anti-hCycE - Dox/Dex + Dox/Dex 0 20 40 60 80
F
E
0 2 4 6 1 2 3 4 Oct4 Nanog 0 5 10 15 20 0 1 2 3 0 0 200 400 600 800GATA4 GATA6 Sox17
0 2 4 6 Nestin 0 200 400 600 Fgf5 0 2 4 6 Cyclin E 0 1 2 3 4 0 1 2 3 4 0 1 2 3 4 0 1 2 3 4 0 1 2 3 4 0 1 2 3 4 0 1 2 3 4 0 1 2 3 4 Sh-scr Sh-CycE Gem-mAG 2 O K m-1t d C Gem-mAG 2 O K m-1t d C Sh-CycE Sh-scr 17% 5% 50% 28% 26% 7% mRNA levels
Mouse + rat cyclin E rat cyclin E
mRNA levels ESC-FUCCI-Sh-scr 40% 27% mRNA levels mRNA levels mRNA levels
A
0h 24h 48h Dox+Dex qPCR- Dox/Dex+ Dox/Dex - Dox/Dex+ Dox/Dex
ESC-IND_ ratCycEWT
ESC-IND_ ratCycES180D
0, 1, 2, 3, 4 : days of differentiation
Figure 4 Cyclin E1 opposes differentiation. (A) Strategy of validation of the ESC-IND_CylE1 cell lines. (B) qPCR analysis of CycE mRNA levels in ESC-IND_ratCylEWT (mouse/rat CycE-specific and myc-tagged CycE-specific primers), and ESC-IND_ratCylES180D
(mouse/rat CycE-specific and myc-tagged CycE-specific primers), before and after treatment with Dox/Dex. (C) Left panel: qPCR analysis of CycE mRNA levels in and ESC-IND_humCylE1WT (human CycE-specific primers). Right panel: immunostaining of human
Cyclin E in ESC-IND_humCycEWT, using an antibody specific of human cyclin E. Scale bar represents 10μM. (D) LIF rescue assay with ESC-IND_ratCycEWT, ESC-IND_ratCycES180D, and ESC-IND_humCycEWT. Means and standard errors were determined from three replicates. (E) Left panels: Morphology of ESC-Fucci-shCycE and ESC-FUCCI-shScrambled after staining for alkaline phosphatase activity. Right panels: Dot plots showing red [mKO2(+)mAG(−)], yellow [mKO2(+)mAG(+)], and green [mKO2(−)mAG(+)] fluorescence. Figures indicate the percentages of cells of each color phenotype. (F) qPCR analysis for pluripotency and lineage-specific markers in ESC-Fucci-shCycE and ESC-FUCCI-shScrambled during differentiation (day 0 to day 4) induced by the formation of embryoid bodies.
A
Cdt1-mKO2 Gem-mAG +LIF 48h - LIF 48h 12h 24h 36h 48h LIF stimulationB
LIF stimulation LIF stimulation +LIF 36h - LIF 36h 12h 24h 36h 48h +LIF 24h - LIF 24h 12h 24h 36h 48h 12h 24h 36h 48h PLATING (G1 phase) 3 6 9 12 15 % mKO(+)mAG(-) 0 3 6 9 12 15 0 20 40 60 80 (S/G2/M phases) + LIF 24h+ LIF 24h 12h 24h 36h 48h + LIF 24h- LIF 24h 12h 24h 36h 48h + LIF 36h- LIF 36h 12h 24h 36h 48h + LIF 48h- LIF 48h 12h 24h 36h 48hno LIF starvation 24h LIF starvation 36h LIF starvation 48h LIF starvation
(G1/S transition) Rex-1 - LIF 48h Oct4 2 1 - LIF 24h
no LIF starvation - LIF 36h
Nanog 2 1 2 1 Brachyury Fgf5 Sox17 2 1 12 24 2 1 +LIF 24h 12h 24h 36h 48h - LIF 24h 12h 24h 36h 48h +LIF 24h - LIF 36h 12h 24h 36h 48h +LIF 36h - LIF 48h 12h 24h 36h 48h +LIF 48h
LIF stimulation LIF stimulation LIF stimulation LIF stimulation
0 mRNA level mRNA level mRNA level mRNA level mRNA level mRNA level
C
LIF stimulation 1 2 1 2 % mKO(+)mAG(+) % mKO(-)mAG(+) +LIF 24hFigure 5 Lengthening of the G1 phase is an early, reversible response to LIF withdrawal. (A) Contour plots of ESC–FUCCI showing the fluorescence levels associated with mAG and mKO2 after withdrawing LIF for 24 h, followed by restimulation for 12, 24, 36, and 48 h. (B) Histograms for the percentages of mKO(+)mAG(−) (G1), mKO(+)mAG(+) (G1/S transition), and mKO(−)mAG(+) (S-G2/M) cells in each of the experimental conditions defined in A. (C) qPCR analysis of pluripotency and lineage-specific markers after LIF starvation for 24 (−LIF 24 h), 36 (−LIF 36 h), and 48 (−LIF 48 h) h, followed by restimulation for 12, 24, 36, and 48 h. (B, C) “no LIF starvation” indicates control cells. Means and standard errors were determined from three replicates.
A
B
Cdt1-mKO2C
+ LIF - LIF 12h 24h 36h 48h 24h 24h LIF stimulation 0 5 10 15 20 % GFP low % mKO2+ cells 0 10 20 30 Rex1-GFP + LIF 24h - LIF 24h 12h 24h 36h 48h LIF stimulation + LIF 24h - LIF 24h 24h 48h P1 LIF stimulation P1 P1 P1D
E
Oct4 (P1) 0 1 2 3 LIF stimulation +LIF - LIF 24h 48h 24h 24h Nanog (P1) 0 1 2 3 LIF stimulation +LIF - LIF 24h 48h 24h 24h Rex-1 (P1) 0 1 2 3 LIF stimulation +LIF - LIF 24h 48h 24h 24h 0 1 2 3 Brachyury (P1) LIF stimulation +LIF - LIF 24h 48h 24h 24h Fgf5 (P1) 0 5 10 15 LIF stimulation +LIF - LIF 24h 48h 24h 24h Sox17 (P1) 0 1 2 3 LIF stimulation +LIF - LIF 24h 48h 24h 24h PLATING Q1 Q2 Q3 Q4 GFPhigh GFPlow GFPhigh GFPlow mKO2+ mKO2- + LIF - LIF 12h 24h 36h 48h 24h 24h LIF stimulation P1 = GFPhighF
10 3 10 5 10 2 10 3 10 4 10 5 10 2 10 2 10 3 10 4 10 5 10 2 10 3 10 4 10 5 10 2 10 3 10 4 10 5 10 4 10 5 10 3 10 2 10 4 10 5 10 3 10 2 10 4 10 5 10 3 10 2 10 4 10 5 10 Self Renewal Permissive State for Differentiation mKO2+ mKO2+ 2i LIF LIF Differentiation bFGF Ground State d e m i r P e v i a N Nanog FGF5 Cdt1-mKO2 Rex1-GFP mRNA levels mRNA levelsFigure 6 LIF regulates G1 phase progression in the Rex1+cell population. (A) Contour plots of Rex1GFP-bla/Oct4CFP-puro/mKO2 ESCs showing the fluorescence levels associated with GFP (Rex1 expression) and mKO2 after LIF withdrawal for 24 h, and followed by re-stimulation for 12, 24, 36, and 48 h. (B) Histogram for the percentages of GFPlow(Rex1−) cells [GFPlow/mKO2(−)]+[GFPlow/ mKO2(+)]→[(Q1+Q2)/(Q1+Q2+Q3+Q4)]. (C) Histograms for the percentages of [GFPlow/mKO2(+)] [Rex1−in G1 phase, Q1/(Q1 + Q2)]
and [GFPhigh/mKO2(+)] [Rex1+in G1 phase, Q3/(Q3 + Q4)]. (D) FACS sorting of GFPhighcells from Rex1GFP-bla/Oct4CFP-puro/mKO2 ESCs treated as indicated. (E) Histograms for the mRNA levels of Oct4, Nanog, Rex1, Brachyury, Fgf5, and Sox17 in the P1 (GFPhigh) fractions. (B, C, E) Means and standard errors were determined from three replicates. (F) Model for ESC self-renewal that incorporates the G1 phase for differentiation commitment and the role of LIF in regulating the G1 phase duration.
fluorescence. These increases could also be explained by Cdt1 stabilization during differentiation, independently from the G1 phase duration. However, we think that this is highly unlikely because it was recently reported that Cdt1 was actually more stable in mouse ESCs than in their differentiated derivatives (Ballabeni et al., 2011). Furthermore, the increase in mKO2-associated fluorescence was paralleled by an increase in the fraction of cells with a 2n DNA content, which further demonstrated the accumulation of cells in the G1 phase with respect to cells in the other cell cycle phases. Therefore, our data indicate that the FUCCI reporter system can be successfully used to study the cell cycle regulation of pluripotent stem cells in a wide variety of experimental paradigms.
ESCs exhibit an increased propensity to differenti-ate while they are transiting through the G1 phase
A link between the G1 phase and commitment of pluripotent stem cells into differentiation was first described in P19 embryonal carcinoma (EC) cells (Mummery et al., 1987). In ES cells, the same conclusion was proposed after observing that roscovitin, a pharmacological inhibitor of Cdk2, slowed down the mitotic cycle, delayed the G1-to-S phase transition, and induced spontaneous differentiation of mouse and human ESCs (Filipczyk et al., 2007; Koledova et al., 2009; Neganova et al., 2009). This differentiation, however, does not necessarily reflect an increased propensity to differentiate in the G1 phase. It may be caused by growth retardation irrespective of the cell cycle phase, or even by the direct effect of decreased Cdk2 activity on pluripotency regulators (Filipczyk et al., 2007). In a recent study, this issue was addressed more directly by separating live human ESCs at different cell cycle phases by elutriation, followed by analyzing their propensity to differentiate. It was shown that G1 cells were more prone to differentiate compared with S/G2 cells (Sela et al., 2012). However, this conclusion is flawed because spontaneously differentiating cells incorporate a longer G1 phase, and therefore would preferentially elutriate within the G1 fraction. Using the FUCCI reporter system, we could eliminate the spontaneously occurring Rex1−cells and FACS-sort the G1 Oct4+/Rex1+ ESCs at nearly 100% purity. Hence, we could conclusively demonstrate that Oct4+Rex1+ESCs exhibited an increased propensity to differentiate during the G1 phase than the S and G2 phases. This conclusion was supported by our observation that overexpression of cyclin E increased the resistance of ESCs to transient LIF deprivation, whereas knockdown of cyclin E increased the G1 phase duration and facilitated differentiation. Thus, G1 provides a window of opportunity for differentiation signals, the aperture of which can be reduced or increased according to the level of kinase-active cyclin E. We also showed that the G1 phase duration varied according to the pluripotent state. G1 was shorter in 2i cells (ground state), and then gradually increased in duration as ESCs first progressed from the ground to the naïve state, and then from the naïve state to the primed state of pluripotency. It is tempting to speculate that this increase in G1 phase duration brings primed pluripotent stem cells closer to their commitment to differentiation. An important question is whether the increase in G1 phase duration that parallels the naïve-to-primed transition is associated with
changes in the mode of regulation of the G1-to-S phase transition.
LIF signaling contributes to the regulation of the G1 phase duration in naïve ESCs
Highlighting the role of LIF signaling in regulating the ESC cell cycle is difficult because of the confounding effect of differentiation, which can induce an increased G1 phase duration. To try to overcome this difficulty, we designed an experimental paradigm that distinguished the early effects of LIF starvation on the kinetics of G1 phase transit from its later effects on differentiation commitment. Using this paradigm, we observed that LIF withdrawal for 24 h reduced the kinetics of G1 phase transit of Oct4+/Rex1+ cells, and that LIF restimulation accelerated this transit so as to restore the original kinetics. This effect was observed prior to the irreversible changes in the expression levels of pluripotency and lineage-specific genes. We conclude that the altered kinetics of G1 transit induced by LIF starvation for 24 h is not an indirect consequence of differentiation commitment, but rather is the direct consequence of LIF-dependent regulation of the kinetics of G1 transit in Oct4+/Rex1+ESCs. Thus, we propose that one function of LIF is to accelerate transit through the G1 phase and thereby protect ES cells from undesired differentiation signals. LIF withdrawal results in increasing this window of opportunity for differentiation cues (Fig. 6F). The molecular mechanism of this novel function of LIF remains to be explored.
Acknowledgments
This work was supported by the LabEX DEVweCAN (ANR-10-LABX-61). DC is a recipient of a fellowship from the Association pour la Recherche contre la Cancer (ARC). We are grateful to Peter Sicinski
for the gift of the pCS2cycEWTplasmid, and Jim Maller for the gift
of pINDCycEWT and pINDCycES180D plasmids. We are grateful to
Sébastien Dussurget and Thibault Andrieu (IFR Bioscience-Gerland) for their assistance with flow cytometry.
Appendix A. Supplementary data
Supplementary data to this article can be found online at http://dx.doi.org/10.1016/j.scr.2012.10.004.
References
Aksoy, I., Sakabedoyan, C., Bourillot, P.Y., Malashicheva, A.B., Mancip, J., Knoblauch, K., Afanassieff, M., Savatier, P., 2007. Self-renewal of murine embryonic stem (ES) cells is supported by the serine/threonine kinases Pim-1 and Pim-3. Stem Cells 25,
2996–3004.
Aladjem, M.I., Spike, B.T., Rodewald, L.W., Hope, T.J., Klemm, M., Jaenisch, R., Wahl, G.M., 1998. ES cells do not activate p53-dependent stress responses and undergo p53-inp53-dependent apoptosis
in response to DNA damage. Curr. Biol. 8, 145–155.
Anastassiadis, K., Kim, J., Daigle, N., Sprengel, R., Scholer, H.R., Stewart, A.F., 2002. A predictable ligand regulated expression strategy for stably integrated transgenes in mammalian cells in
culture. Gene 298, 159–172.
Anastassiadis, K., Rostovskaya, M., Lubitz, S., Weidlich, S., Stewart, A.F., 2011. Precise conditional immortalization of mouse cells
using tetracycline-regulated SV40 large T-antigen. Genesis 48,
220–232.
Ballabeni, A., Park, I.H., Zhao, R., Wang, W., Lerou, P.H., Daley, G.Q., Kirschner, M.W., 2011. Cell cycle adaptations of embryonic stem
cells. Proc. Natl. Acad. Sci. U. S. A. 108, 19252–19257.
Bourillot, P.Y., Aksoy, I., Schreiber, V., Wianny, F., Schulz, H., Hummel, O., Hubner, N., Savatier, P., 2009. Novel STAT3 target genes exert distinct roles in the inhibition of mesoderm and endoderm differentiation in cooperation with Nanog. Stem Cells
27, 1760–1771.
Brons, I.G., Smithers, L.E., Trotter, M.W., Rugg-Gunn, P., Sun, B., de Sousa, Chuva, Lopes, S.M., Howlett, S.K., Clarkson, A., Ahrlund-Richter, L., Pedersen, R.A., et al., 2007. Derivation of pluripotent epiblast stem cells from mammalian embryos.
Nature 448, 191–195.
Burdon, T., Smith, A., Savatier, P., 2002. Signalling, cell cycle and pluripotency in embryonic stem cells. Trends Cell Biol. 12,
432.
Bureau, C., Hanoun, N., Torrisani, J., Vinel, J.P., Buscail, L., Cordelier, P., 2009. Expression and function of Kruppel like-factors (KLF) in
carcinogenesis. Curr. Genomics 10, 353–360.
Ema, M., Mori, D., Niwa, H., Hasegawa, Y., Yamanaka, Y., Hitoshi, S., Mimura, J., Kawabe, Y., Hosoya, T., Morita, M., et al., 2008. Kruppel-like factor 5 is essential for blastocyst development and
the normal self-renewal of mouse ESCs. Cell Stem Cell 3, 555–567.
Filipczyk, A., Laslett, A.L., Mummery, C., Pera, M., 2007. Differen-tiation is coupled to changes in the cell cycle regulatory apparatus
of human embryonic stem cells. Stem Cell Res. 1, 45–60.
Fujii-Yamamoto, H., Kim, J.M., Arai, K., Masai, H., 2005. Cell cycle and developmental regulations of replication factors in mouse
embryonic stem cells. J. Biol. Chem. 280, 12976–12987.
Geng, Y., Lee, Y.M., Welcker, M., Swanger, J., Zagozdzon, A., Winer, J.D., Roberts, J.M., Kaldis, P., Clurman, B.E., Sicinski, P., 2007.
Kinase-independent function of cyclin E. Mol. Cell 25, 127–139.
Ghaleb, A.M., Nandan, M.O., Chanchevalap, S., Dalton, W.B., Hisamuddin, I.M., Yang, V.W., 2005. Kruppel-like factors 4 and 5: the yin and yang regulators of cellular proliferation. Cell Res.
15, 92–96.
Jirmanova, L., Afanassieff, M., Gobert-Gosse, S., Markossian, S., Savatier, P., 2002. Differential contributions of ERK and PI3-kinase to the regulation of cyclin D1 expression and to the control of the G1/S transition in mouse embryonic stem cells.
Oncogene 21, 5515–5528.
Kapinas, K., Grandy, R., Ghule, P., Medina, R., Becker, K., Pardee, A., Zaidi, S.K., Lian, J., Stein, J., van Wijnen, A., et al., 2013. The
abbreviated pluripotent cell cycle. J. Cell. Physiol. 228 (1), 9–20.
Koledova, Z., Raskova Kafkova, L., Calabkova, L., Krystof, V., Dolezel, P., Divoky, V., 2009. Cdk2 inhibition prolongs G1 phase progression in mouse embryonic stem cells. Stem Cells Dev. 19,
181–194.
Matsumoto, Y., Maller, J.L., 2004. A centrosomal localization signal in cyclin E required for Cdk2-independent S phase entry. Science
306, 885–888.
Mummery, C.L., van den Brink, C.E., de Laat, S.W., 1987. Commitment to differentiation induced by retinoic acid in P19 embryonal carcinoma cells is cell cycle dependent. Dev. Biol.
121, 10–19.
Neganova, I., Zhang, X., Atkinson, S., Lako, M., 2009. Expression and functional analysis of G1 to S regulatory components reveals an important role for CDK2 in cell cycle regulation in human
embryonic stem cells. Oncogene 28, 20–30.
Nichols, J., Smith, A., 2009. Naive and primed pluripotent states.
Cell Stem Cell 4, 487–492.
Ohtsubo, M., Roberts, J.M., 1993. Cyclin-dependent regulation of
G1 in mammalian fibroblasts. Science 259, 1908–1912.
Ohtsubo, M., Theodoras, A.M., Schumacher, J., Roberts, J.M., Pagano, M., 1995. Human cyclin E, a nuclear protein essential for
the G1-to-S phase transition. Mol. Cell. Biol. 15, 2612–2624.
Resnitzky, D., Gossen, M., Bujard, H., Reed, S.I., 1994. Acceleration of the G1/S phase transition by expression of cyclins D1 and E
with an inducible system. Mol. Cell. Biol. 14, 1669–1679.
Sakaue-Sawano, A., Kurokawa, H., Morimura, T., Hanyu, A., Hama, H., Osawa, H., Kashiwagi, S., Fukami, K., Miyata, T., Miyoshi, H., et al., 2008. Visualizing spatiotemporal dynamics of multicellular
cell-cycle progression. Cell 132, 487–498.
Savatier, P., Huang, S., Szekely, L., Wiman, K.G., Samarut, J., 1994. Contrasting patterns of retinoblastoma protein expression in mouse embryonic stem cells and embryonic fibroblasts. Oncogene
9, 809–818.
Savatier, P., Lapillonne, H., van Grunsven, L.A., Rudkin, B.B., Samarut, J., 1996. Withdrawal of differentiation inhibitory activity/leukemia inhibitory factor up-regulates D-type cyclins and cyclin-dependent kinase inhibitors in mouse embryonic stem
cells. Oncogene 12, 309–322.
Sela, Y., Molotski, N., Golan, S., Itskovitz-Eldor, J., Soen, Y., 2012. Human embryonic stem cells exhibit increased propensity to differentiate during the G1 phase prior to phosphorylation of
pRB. Stem Cells 30, 1097–1108.
Shirogane, T., Fukada, T., Muller, J.M., Shima, D.T., Hibi, M., Hirano, T., 1999. Synergistic roles for Pim-1 and c-Myc in STAT3-mediated cell cycle progression and antiapoptosis.
Immunity 11, 709–719.
Stead, E., White, J., Faast, R., Conn, S., Goldstone, S., Rathjen, J., Dhingra, U., Rathjen, P., Walker, D., Dalton, S., 2002. Pluripotent cell division cycles are driven by ectopic Cdk2,
cyclin A/E and E2F activities. Oncogene 21, 8320–8333.
Takehara, T., Teramura, T., Onodera, Y., Hamanishi, C., Fukuda, K., 2011. Reduced oxygen concentration enhances conversion of embryonic stem cells to epiblast stem cells. Stem Cells Dev. 21,
1239–1249.
Tesar, P.J., Chenoweth, J.G., Brook, F.A., Davies, T.J., Evans, E.P., Mack, D.L., Gardner, R.L., McKay, R.D., 2007. New cell lines from mouse epiblast share defining features with human
embryonic stem cells. Nature 448, 196–199.
Toyooka, Y., Shimosato, D., Murakami, K., Takahashi, K., Niwa, H., 2008. Identification and characterization of subpopulations in
undifferentiated ES cell culture. Development 135, 909–918.
Tsai, L.H., Lees, E., Faha, B., Harlow, E., Riabowol, K., 1993. The cdk2 kinase is required for the G1-to-S transition in mammalian
cells. Oncogene 8, 1593–1602.
van den Heuvel, S., Harlow, E., 1993. Distinct roles for
cyclin-dependent kinases in cell cycle control. Science 262, 2050–2054.
White, J., Stead, E., Faast, R., Conn, S., Cartwright, P., Dalton, S., 2005. Developmental activation of the Rb-E2F pathway and establishment of cell cycle regulated Cdk activity during embryonic
stem cell differentiation. Mol. Biol. Cell 16, 2018–2027.
Wianny, F., Bernat, A., Marcy, G., Huissoud, C., Markossian, S., Leviel, V., Kennedy, H., Savatier, P., Dehay, C., 2008. Derivation and cloning of a novel Rhesus ES cell line stably expressing tau-GFP.
Stem Cells 26, 1444–1453.
Yang, V.S., Carter, S.A., Hyland, S.J., Tachibana-Konwalski, K., Laskey, R.A., Gonzalez, M.A., 2011. Geminin escapes degradation in G1 of mouse pluripotent cells and mediates the expression of
Oct4, Sox2, and Nanog. Curr. Biol. 21, 692–699.
Ying, Q.L., Nichols, J., Chambers, I., Smith, A., 2003. BMP induction of Id proteins suppresses differentiation and sustains embryonic stem
cell self-renewal in collaboration with STAT3. Cell 115, 281–292.
Ying, Q.-L., Wray, J., Nichols, J., Batlle-Morera, L., Doble, B., Woodgett, J., Cohen, P., Smith, A., 2008. The ground state of