Creating the Perception-based
LADDER sketch recognition language
The MIT Faculty has made this article openly available. Please share
how this access benefits you. Your story matters.
Citation
Tracy Hammond and Randall Davis. 2010. Creating the
perception-based LADDER sketch recognition language. In Proceedings of the
8th ACM Conference on Designing Interactive Systems (DIS '10).
ACM, New York, NY, USA, 141-150. DOI=10.1145/1858171.1858197
http://doi.acm.org/10.1145/1858171.1858197
As Published
http://dx.doi.org/10.1145/1858171.1858197
Publisher
Association for Computing Machinery (ACM)
Version
Author's final manuscript
Citable link
http://hdl.handle.net/1721.1/71125
Terms of Use
Creative Commons Attribution-Noncommercial-Share Alike 3.0
Creating the Perception-based LADDER Sketch
Recognition Language
Tracy Hammond
Sketch Recognition Lab
Department of Computer Science &
Engineering
Texas A&M University
[email protected]
Randall Davis
Design Rationale Group
Computer Science and Artificial
Intelligence Lab
Massachusetts Institute of Technology
[email protected]
ABSTRACT
Sketch recognition is automated understanding of hand-drawn diagrams. Current sketch recognition systems exist for only a handful of domains, which contain on the order of 10-20 shapes. Our goal was to create a generalized method for recognition that could work for many domains, increasing the number of shapes that could be recognized in real-time, while maintaining a high accuracy. In an effort to effectively recognize shapes while allowing drawing freedom (both drawing-style freedom and perceptually-valid variations), we created the shape description language modeled after the way people naturally describe shapes to 1) create an intuitive and easy to understand description, providing transparency to the underlying recognition process, and 2) to improve recognition by providing recognition flexibility (drawing freedom) that is aligned with how humans perceive shapes. This paper describes the results of a study performed to see how users naturally describe shapes. A sample of 35 subjects described or drew approximately 16 shapes each. Results show a common vocabulary related to Gestalt grouping and singularities. Results also show that perception, similarity, and context play an important role in how people describe shapes. This study resulted in a language (LADDER) that allows shape recognizers for any domain to be automatically generated from a single hand-drawn example of each shape. Sketch systems for over 30 different domains have been automatically generated based on this language. The largest domain contained 923 distinct shapes, and achieved a recognition accuracy of 83% (and a top-3 accuracy of 87%) on a corpus of over 11,000 sketches, which recognizes almost two orders of magnitude more shapes than any other existing system.
"Permission to make digital or hard copies of all or part of this work for personal or classroom use is granted without fee provided that copies are not made or distributed for profit or commercial advantage and that copies bear this notice and the full citation on the first page. To copy otherwise, to republish, to post on servers or to redistribute to lists, requires prior specific permission and/or a fee.
DIS 2010, August 16-20, 2010, Aarhus Denmark
Copyright © 2010 ACM ISBN 978-1-4503-0103-9, 2010/08 - $10.00."
ACM Classification Keywords
H5.2. Input devices and strategies; I.7.5. Graphics recognition and interpretation
INTRODUCTION
Sketch interfaces recognize hand-drawn sketches in real time, combining the drawing freedom of paper with the powerful beautification, editing, and simulation capabilities of a computer-interpreted drawing. Most existing sketch recognition algorithms use either gesture or template-based recognition. Gesture recognition algorithms classify gestures based on a selection of drawing style features. The disadvantage of this method is that either the system has to be trained for each user and/or users have to draw each gesture in a specific manner (order, direction, number of strokes) in order for it to be recognized [10][12]. Template recognition algorithms recognize shapes by what they look like rather than how they were drawn, providing additional drawing freedom. The disadvantage of template-based recognizers is that a shape must be drawn to look just like its template, and a separate template must be provided for each acceptable variation. Providing a separate template for every possible drawing variation can prove to be boundless. For example, think of an arrow that has a limited number of acceptable variations.
Current sketch recognition systems have been limited to on the order of 10-20 sketched shapes. Additionally these shapes usually contain a number of drawing requirements that limit the way that the users can draw each of the shapes. Alternatively, our goal is to develop a generalized method of recognition that recognizes more shapes in real time without having to sacrifice accuracy. In order to do this, the authors attempted to develop a shape language modeled after the way people naturally describe shapes, allowing shapes to be described compositionally by the geometric components each shape is made up of and the constraints between them. Recognizing shapes based on a geometric description provides both drawing style freedom, in that users are not constrained to draw shapes with a specific number, order, or direction of strokes, as well as perceptual variable drawing freedom, in that users can draw
acceptable variations provided the variations still abide by the specified constraints and subcomponents. To give an examples, an arrow can be described as two lines and a path all connecting at a single point, where the two lines are of equal length and form equal acute angles with itself and the path (arrow shaft). Such a geometric description allows the arrow to be drawn in one to three strokes (as opposed to a gesture-based recognition algorithm) and allows the shaft of the arrow to be of any shape or size.
When creating the shape description language, the authors had several goals. The language should:
1) Be able to describe domain information
2) Be broad enough to support a wide range of domains
3) Provide a high level of abstraction
4) Remain narrow enough to remain comprehensible 5) Be easy to read, understand, and debug; be
intuitive; help make the recognition process transparent to the user
6) Allow the description of a generalized version of a shape that includes acceptable variations.
7) Allows for recognition of a shape based on what it looks like rather than how it was drawn
8) Allows users to also specifying some drawing style information when desired
9) Allows for the specification of drawing context 10) Supports hierarchical descriptions and abstract
descriptions.
In an effort to find a complete, yet concise, understandable shape description language, the authors set out to find out 1) how people naturally describe shapes when trying to convey that shape to another human, and 2) what subcomponents and constraints are commonly used and how specific are people naturally in their descriptions. By modeling recognition after humans, the authors hope that 1) recognition will be transparent and understandable to the user, and that 2) recognition will be more accurately aligned to how humans recognize shapes, possibly implying higher accuracy rates and more intuitive failures.
This paper describes the results from a study performed by the authors to determine how users naturally describe shapes to other human.
This paper proceeds as follows. The next section describes related work in sketch recognition. It then details the methodology and results of this study. Next, it compares the results of this study with results from Gestalt principles. Finally, we briefly describe language choices as well as the overall effectiveness of the language in the automatic generation of sketch recognition user interfaces. PREVIOUS WORK
Shape Description Languages
Shape description languages, such as shape grammars, have been around for a long time [19]. Shape grammars are studied widely within the field of architecture, and many systems are continuing to be built using these shape grammars [5]. However, shape grammars have been
developed for shape generation rather than for recognition. More recent shape description languages have been created for use in diagram parsing [4].
However, none of the above languages were built to recognize hand-drawn shapes. Hand-drawn shapes necessarily contain noise and approximations. Hand-drawn shapes are never exactly the same as the original cleaned example. They are different because they contain not only the messy jagged lines of a hand-drawn shape, but also allowable perceptual variations. Thus, we need a language that identifies the perceptually important details of a shape and uses those details for recognition.
Lee performed recognition using attribute relational graphs [11]. Their language differs significantly from the one described here in that their language is quantitative rather than perceptually based, requiring specific details of the shape’s position. Keating and Mason [10] also performed recognition by matching a graph representation of a shape; their language differs from the one described in this paper in that theirs is statistical and specifies the probable location of each subpart, whereas ours is based on the way humans describe shapes, which tends instead to be categorical, describing the ideal location of the shape and allowing the perceptually based recognition engine to automatically determine the allowable variance.
Within the field of sketch recognition, other attempts have been made to create languages for sketch recognition. Mahoney [13] used a language to model and recognize stick figures. Saund developed a symbolic method for constructing higher-level primitive shapes, such as curved contours, corners, and bars. Bimber, Encarnacao, and Stork created a multilayer architecture for sketch recognition [1] of 3D sketches. Their system recognized objects created by multiple strokes with the use of a simple BNF grammar to define the sketch language. Their sketch domain differs from ours in that we wish to allow free-hand sketching, which they did not. Caetano et al. [2] used Fuzzy Relational Grammars to describe shapes by combining fuzzy logic and special relation syntax in a unified formalism [9]. Shilman has developed a statistical language model for ink parsing with a similar intent of facilitating development of sketch recognizers. The language consists of seven constraints:
distance, deltaX, deltaY, angle, width ratio, height ratio,
and overlap, and allows the user to specify concrete values, using either a range or a Gaussian [18]. However, based on our studies we find that humans find it more intuitive to state (contains shape1 shape2) rather than have to specify two deltaX and two deltaY constraints, using discrete constraints, each of the form deltaX (shape1.WEST <
shape2.WEST).range(0,100)). Egenhofer [7] has used a
shape language for searching for images using cardinal directions, topology, and a metric refinement to determine the amount of area or border intersection. Myers et al. [14] designed programming language for designing user interfaces; however, shapes are not described using a geometric formalism.
None of the above shape languages were based on a preliminary study that attempted to model how humans naturally describe shapes in order to create an intuitive language that would be easy for users to understand. Perception Based Sketch Recognition
While no hand-drawn shape description studies have been yet performed in attempts to create a language for sketch recognition, several systems have dealt with human perception. Veselova [21] has automatically generated shape descriptions using perceptual rules. David [3] has developed a method for recognizing deformable shapes based on perception. Sarkar developed metrics for quantifying Gestalt properties of similarity between arcs and lines [16]. Saund has used perception to aid in object grouping [17].
Gestalt Principles
In 1890, Christian von Ehrenfels said that Gestalt principles describe “experiences that require more than the basic sensory capabilities to comprehend” [22]. The brain is programmed to perceive certain visual features as more perceptually important than others. Grouping rules, developed by Wertheimer in 1959 [23], explain how people perceptually group objects using concepts such as connectedness, nearness, and other principles. Singularities, provided by Goldmeier in 1972 [6], describe which geometric shape properties are most noticeable, such as the very precise constraints HORIZONTAL or PERPENDICULAR,
as compared with general categories of constraints such as POSSLOPE and ACUTE.
STUDY GOALS
This paper describes a study to determine how people naturally describe shapes. The purpose of this study is to determine the vocabulary and syntax of a shape description language for use in recognition. Additionally, the study is to help that the vocabulary and syntax chosen enables that:
2. Shape descriptions would be complete enough to recognize and identify a shape that agreed with the description.
3. Shape descriptions would be readable and understandable to a wide variety of people, including computer programmers and nonprogrammers.
4. The language would be intuitive, such that it would key into the way people naturally describe shapes. DESCRIPTION OF STUDY
This section describes the study performed to determine how people naturally describe shapes.
Participants
Although users of our language (aka developers of a sketch interface) include experts in graphics-based fields in computer science, we did not want this to be a requirement for language use. We do, however, expect the developers to
be competent in the domain for which they are generating a sketch recognition system; additionally, we expect them to be power computer users, but not necessarily computer programmers. In particular, we expect that sketch recognition UI designers, who may be teachers or experts in a particular domain, but not necessarily computer science programmers, may use our language to create sketch recognition systems that correct homework or test questions, facilitate learning, simplify design development, or create intuitive interfaces. Because we wanted to create a language understandable to people from a wide variety of backgrounds, we selected a participant population with a diverse background, including computer programmers and those who are not programmers, to mimic the intended user population.
In order to gain a diverse background of participants, we placed flyers around town, in high traffic areas. Several participants were gained by an e-mail forwarded by the spouse of the director of the computer science lab, who is a professor in performing arts. Participants called or sent an e-mail to set up a time to perform the study. Most studies were performed in the computer science laboratory, but several studies were performed in a coffeehouse in the neighboring town (Somerville) to encourage users with diverse backgrounds to complete the study.
There were a total of 35 participants, ranging in age from 18 to 71. While computer science graduate students contributed a noticeable portion of study participants, they comprised less than a third of the total participants. Participant occupations included dancers, teachers, business people, professors, mathematicians, and undergraduate and graduate students in various departments.
Participants were provided with a free unrestricted movie ticket as a measure of thanks for completing the study. Participants were allowed to back out of the study at any time, and they were informed that they would still receive their movie ticket thank you. However, none opted out early.
Study Length
Each participant described or drew shapes for approximately one hour. There were 4 sections to the study, performed in tandem. Each part was stopped after the participant had performed the study section for 15 minutes. If the participant was in the middle of a question when the time ended, they were encouraged to finish the question on which they were currently working before the next section started. There was no human intervention in the timing of each section. The application automatically progressed through each section using a timer that checked after each question whether the allotted time had completed.
Questions
The study consisted of four sections where participants had to either draw shapes based on a description, or describe shapes textually and verbally based on an image. Participants were provided with textual instructions (as described below) for each stage to ensure that each
participant received the same instructions. An observer was located either nearby (when the study was performed in the coffee shop) or in the next room (when the study was performed in the lab) in case a participant had a question. Very few questions were asked and usually had to do with technical issues, such as what to do when the submit button was accidentally clicked before a description was completed.1 The experimental procedure comprised 4
stages, as follows:
Part 1: Novice Descriptions:
The purpose of Part 1 was to obtain unadulterated natural human shape descriptions. In Part 1, a participant was shown a shape description at the top of the screen with the following text and a text box below it: “We want you to
describe the shape you see above. Imagine you are describing this shape to a computer that understands only simple geometric shapes and relationships between them.”
The participant was asked first to verbally describe the shape, then to textually describe it. Verbal descriptions were typed out verbatim, with disfluencies such as “um” and “ah” removed. In this Novice task, participants were unaffected by others’ descriptions (as they did not see them), and thus more likely to use more natural language.
In a preliminary study we first varied the order of verbally or textually describing a shape, as we thought it might make a difference in descriptions; however, we found that whenever participants were asked to textually describe a shape first, they invariably simply read what they had just typed without thinking about the geometric shape of the object. To prevent that, we required users to first give a verbal description of the shape before giving a text description. In hindsight, we wonder whether simply removing their description before asking for a verbal description would prevent this.
Part 2: Interpreting Descriptions:
The purpose of Part 2 was to 1) see if other humans could reproduce the drawing based on a provided description (i.e., test if their description was understandable), and 2) emphasize to the user the purpose of their task (i.e., that their descriptions have to be understandable such that the drawing is reproducible by another human).
In Part 2, the participant was shown another participant’s description from Part 1 or Part 3 selected at random and asked to “Draw the shape above.” Participants were never asked to draw or describe the same shape twice (thus, the large number of images needed). In order to ensure that there would be enough descriptions to ensure participants would not draw a shape they had previously described, this section had to be seeded with data from preliminary participants who completed only Part 1. The participants used for seeding the data were not included in the 35 participants.
1
These descriptions (of accidental submission) were deleted.
This section clearly helped participants to better understand the task at hand. We wanted participants to create descriptions that could be understood by others. Only by showing their descriptions to others did they fully understand what that meant. When doing this part of the study, participants often were heard to remark to themselves: “Oh, I get it,” or “Oh, that’s a much better way
to explain it,” or “Hmm, that is very confusing.” This
section was also used to help validate which descriptions were easier to understand and read.
Part 3: Experienced Descriptions:
The purpose of Part 3 was to determine how users descriptions changed after experiencing Part 2.
In Part 3, the instructions and setup for this section were the same as in Part 1. Participants were asked to repeat this task to see what effect the experience gained from Part 2 had on their descriptions. The expectation was that participants would produce more understandable descriptions.
Part 4: Structured Descriptions:
The purpose of Part 4 was to determine how their descriptions changed, both in terms of words used and understandability when users were required to put a little bit of structure in their description.
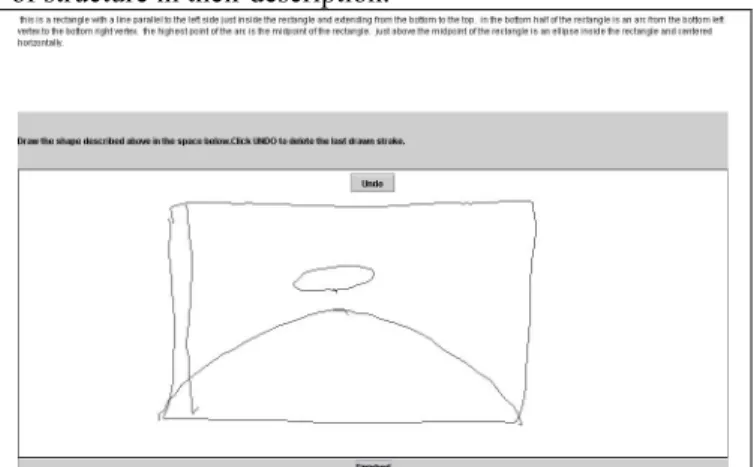
Figure 1. A screen shot of the study during Part 2: Interpreting Descriptions after a participant drew a description.
In Part 4, participants were shown a shape and asked to label the shape using two separate text boxes. The first text box instructed, “List all of the simple geometric shapes in
the shape shown. Create names for each of them of the form line1, line2, circle1, arc1.” The second text box instructed,
“Using the names you just created above, describe the
relationships between the components.”
Shapes Shown
We chose 90 military course of action symbols as our image set (Appendix 1). The goal was to select iconic shapes that were unfamiliar to most people,2 but still
2
We confirmed that military course of actions symbols were, in fact, unfamiliar to all of the participants in our study.
describable using primitive shapes such as lines, arcs, and ellipses to more easily allow participants to restrict their language to geometric terms only, rather than using a domain-specific functional description of the shape. Because of the nature of the domain, most of the described shapes had elongated rectangles surrounding them. The large number of images was chosen to ensure that throughout the study participants were never asked to describe or draw the same shape twice.
RESULTS
All verbal descriptions were typed out in textual form so they could be appropriately compared with the textual descriptions. In total, 520 descriptions and 260 drawings were collected and included in this study.
Sample Effective Descriptions
Many of the diagrams were correctly reproduced given their textual description. Figure 2 presents some sample descriptions that were accurately reproduced.
“This is a rectangle with a line parallel to the left side just inside the rectangle and extending from the bottom to the top. In the bottom half of the rectangle is an arc from the bottom left vertex to the bottom right vertex. The highest point of the arc is the midpoint of the rectangle. Just above the midpoint of the rectangle is an ellipse inside the rectangle and centered horizontally.”
“There is a box. A vertical line divides the box in half. A line connects lower left to upper right corners. There is a 'B' shape in the top left corner. There is a dark dot in the left half of the box above the diagonal line about 3/4 of the way up from the bottom of the box. There is a dark dot on the right side also about 3/4 of the way up from the bottom and lies just below the diagonal line. Curves from the dots extend across the vertical and diagonal line. The curves intersect along the vertical line just below the height of the dots.”
Figure 2. Sample descriptions with the original shape on the left and the reproduced drawing on the right.
Sample Ineffective Descriptions
Although many of the shapes were accurately reproduced from participants’ descriptions, some shapes drawn in Part 2 from the previous participants’ descriptions were reproduced incorrectly. Because many of these shapes were mostly correct with the exception of a single inaccuracy, we chose not to produce an accuracy
percentage. Rather, some language choices caused some inaccurate reproduction of shapes, and we will discuss a few of them here.
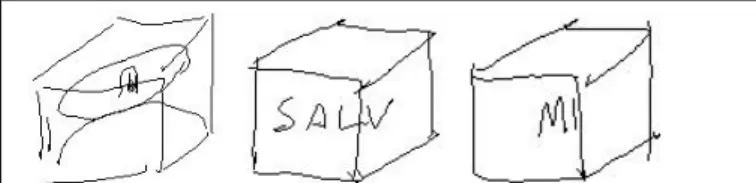
Rectangle, not “Box”:
The term “box” caused some confusion. In 6 different drawings, a 3D box, rather than the intended 2D rectangle, was produced. (Other occurrences of this word produced the intended 2D rectangle; see elsewhere in the paper for a sample.) This is interesting in that no 3D figures were part of the domain; we expect that the term “box” would cause more confusion if 3D and 2D figures were included in the domain. Figure 3 presents a few of the images produced.
Figure 3. Sketches created in Part 2 with descriptions specifying a “box.”
Insufficiently Constrained Descriptions:
Several descriptions gave a relative location to one shape but not to others. Thus, the shape would be insufficiently constrained. Figure 4 lists a few of the images produced from insufficiently constrained descriptions.
“a rectangle with an arc at the bottom and an ellipse above it, touching it, and inside the ellipse there's another arc, sharper than the first one, and inside this one there is the letter "S" and there's a line at the left-hand end of the rectangle.”
“horiz box. two small, adjacent squares bottom center of box. EXCEPT squares do not have bottoms”
Figure 4. Insufficiently constrained shape descriptions. Shape Vocabulary
The main purpose of this study was to determine an effective and appropriate vocabulary for the shape description language. The participants used 1,203 distinct words in their 520 descriptions comprising 209 spoken and 311 typed descriptions. The descriptions came to 19,345 total word instances, of which 766 words, totaling 18,906 instances, were used more than once.
Each word was labeled as to how it was used within the description. The possible labels were: shape type (e.g. “rectangle”), shape constraint (e.g., “inside”), shape
property (e.g., “width”), stop word (e.g., “the,” “a,” “those”), nonmeaningful variable label (e.g., “a1,” “s1”), everyday non-geometric objects (e.g., golden arches, shield, coffin, bridge), and other concepts (such as “like” or “about”) which were not chosen in the initial formulation of our language.
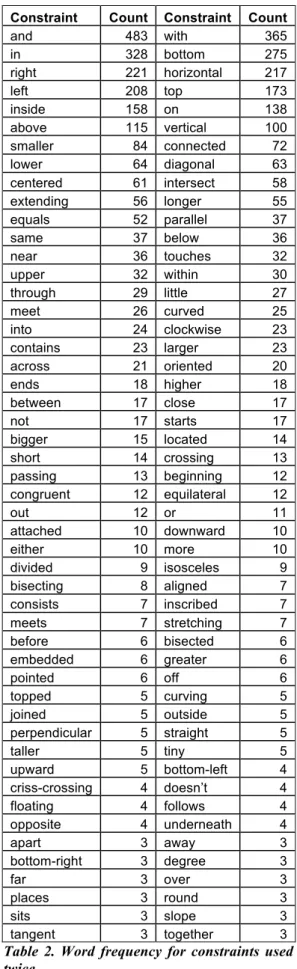
Of the 18,906 instances of the 766 words used more than once, 8,992 words consisted of shape types, constraints, or shape propertied. Table 1 lists the shapes used more than once. Note that the standard geometric shapes top this list. There is a general standardization vocabulary for most shapes, although there is some variability in the description of an arc (“semicircle”, “semi-ellipse”, “quarter-circle”, “half-circle”, “quarter-arc”). Table 2 lists the constraints used more than twice3. Table 3
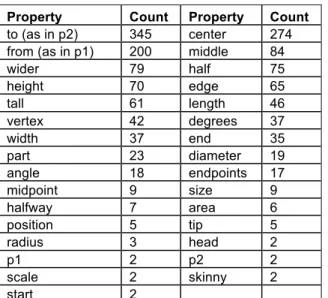
lists the properties used more than once.
Shape Count Shape Count
rectangle 844 line 576 arc 180 circle 143 dot 130 triangle 124 box 116 point 78 shape 76 ellipse 74 this 66 oval 66 semicircle 37 curve 30 quadrilateral 19 rounded-rectangle 16 square 13 box 13 segment 11 quarter-circle 8 figure 6 text 6 tick 5 semi-ellipse 5 object 4 half-circle 4 stick 3 mark 3 square-shaped 3 squiggle 2 wavy-line 2 cursive 2 quarter-arc 2 dash 1
Table 1. Word frequency for shape types used more than once4.
Language Choices
The authors created an initial vocabulary for the shape description language from the results of this study. When multiple words with the same meaning (or usage in the case of using the word “box” in place of “rectangle”), the most popular label was chosen.
Interestingly enough, and rather unsurprisingly, the shape constraint words used in the study aligned largely with the grouping and singularity rules of perception from Wertheimer and Goldmeier’s Gestalt principles.
3
Note that misspellings (“diagnol”) and other parts of speech (“diagonally”) were counted as the according constraint.
4
Note that misspellings (“rectagle”) and labels with the same name containing a number at the end (“rectangle1”) were counted as the according type.
Constraint Count Constraint Count
and 483 with 365 in 328 bottom 275 right 221 horizontal 217 left 208 top 173 inside 158 on 138 above 115 vertical 100 smaller 84 connected 72 lower 64 diagonal 63 centered 61 intersect 58 extending 56 longer 55 equals 52 parallel 37 same 37 below 36 near 36 touches 32 upper 32 within 30 through 29 little 27 meet 26 curved 25 into 24 clockwise 23 contains 23 larger 23 across 21 oriented 20 ends 18 higher 18 between 17 close 17 not 17 starts 17 bigger 15 located 14 short 14 crossing 13 passing 13 beginning 12 congruent 12 equilateral 12 out 12 or 11 attached 10 downward 10 either 10 more 10 divided 9 isosceles 9 bisecting 8 aligned 7 consists 7 inscribed 7 meets 7 stretching 7 before 6 bisected 6 embedded 6 greater 6 pointed 6 off 6 topped 5 curving 5 joined 5 outside 5 perpendicular 5 straight 5 taller 5 tiny 5 upward 5 bottom-left 4 criss-crossing 4 doesn’t 4 floating 4 follows 4 opposite 4 underneath 4 apart 3 away 3 bottom-right 3 degree 3 far 3 over 3 places 3 round 3 sits 3 slope 3 tangent 3 together 3
Table 2. Word frequency for constraints used more than twice.
We list the some of the chosen constraints and how they relate to Gestalt principles (whether grouping or singularity): COINCIDENT (grouping), CONNECTED (grouping), MEET (grouping), TOUCHES (grouping), NEAR
(grouping), FAR (anti-‐grouping), INTERSECTS (grouping),
CONTAINS (grouping), HORIZONTAL (singularity), VERTICAL
(singularity), DIAGONAL (anti-‐singularity), PARALLEL
(singularity), PERPENDICULAR (singularity), SLANTED (anti-‐
singularity), EQUALLENGTH/EQUALSIZE (singularity),
LONGER/LARGER (anti-‐singularity), SAMEX (singularity), LEFTOF (anti-‐singularity), SAMEY (singularity), ABOVE
(anti-‐singularity), ACUTEMEET (grouping combined with anti-‐singularity), OBTUSEMEET (grouping combined with
anti-‐singularity), BISECTS (grouping and singularity), and
NOT (anti-‐grouping or singularity).
Property Count Property Count
to (as in p2) 345 center 274
from (as in p1) 200 middle 84
wider 79 half 75 height 70 edge 65 tall 61 length 46 vertex 42 degrees 37 width 37 end 35 part 23 diameter 19 angle 18 endpoints 17 midpoint 9 size 9 halfway 7 area 6 position 5 tip 5 radius 3 head 2 p1 2 p2 2 scale 2 skinny 2 start 2
Table 3. Word frequency for properties used more than once5.
Other constraints were also included to exist in the language, but the other constraints not listed above functioned as a sort of syntactic sugar, being already specifiable by a combination of constraints in the language, such as SMALLER or CENTEREDABOVE to include other
popular constraints.
48% of all words used in the study were a variation of one of the above terms (or the word itself). If you include stop words and variable labels, that accounts for 97% of all words used in the study, leaving only 3% of words used not included in the initial version of the language.
Other Vocabulary
Of the 18,906 words, 8,375 words were instances of stop words or non-meaningful variable labels, 541 instances were non-geometric objects, and 998 instances (of 75 distinct words) were other words used in descriptions. Table 4 lists the most-popular other words used more than
5
Plural and single properties were counted as one.
15 times (totaling 14 out of 75 individual words and 718 out of the 998 instances). These other words were not included in the initial version of the vocabulary as there was not an immediately intuitive manner as to how they should be translated into a recognition rule.
Other Frequency Other Frequency
about 77 slightly 28 as 66 inch 24 like 53 looks 24 but 45 both 22 other 36 towards 20 rotated 35 upside 18 way 32 along 18
Table 4. Word frequency for other words used more than 15 times each.
The 998 instances of the 75 missing concepts were mostly concepts describing how one shape was similar to another, and then how it was different (examples included “this looks like X, except for...” or “this is about the same Y as X, but rotated...”).6 Similarities seemed to be a natural way for humans to describe shapes. This method of description agrees with the perception rule that people like to group similar things.
Other Notable Occurrences
Hierarchical Descriptions:
Shapes were often described hierarchically and compositionally. Participants frequently referred to previously described shapes even though they were instructed not to since descriptions were shown in a random order in Part 2.7 Given the prevalence of hierarchically described descriptions, the shape language provides the ability to describe shapes hierarchically.
Orientation Dependent Descriptions:
When examining the shape primitives that people used, we noticed that they made extensive use of orientation-dependent terms like “horizontal” and “vertical” in phrases like “horizontal rectangle” or “horizontal equilateral triangle.” Participants also used orientation when referring to subcomponents of a shape, for example, “lower-right corner.”
6
Note that “rotated” in this list was used not to say that a shape is rotatable, a concept that does exist in the language, but rather to describe an alteration: “this looks like X, but rotated on its side.” This example emphasizes that we feel that how the word was used is at least as important as, if not more than, the choice of word itself.
7
In cases where users did refer to previous shapes, we included the description of that shape during the drawing task to allow other users still to be able to reproduce the shape.
Common Vocabulary:
We found it interesting that participants were consistent and used the same word repeatedly to describe a concept, both within their own descriptions and with others’ descriptions, showing the existence of a shared shape vocabulary. The extensive use of orientation-dependent descriptions showed the value of orientation-dependent constraints, including: ABOVE, BELOW, RIGHT, LEFT, HORIZONTAL, VERTICAL.
Also, some shapes had an implied orientation, and participants would comment on the orientation only when it was different than expected, for example, “a sideways e.”
Prevalence of Everyday Words:
Participants were specifically instructed not to use non-geometrical words (such as everyday objects in their lives) and to limit themselves to a graphical vocabulary. Despite this instruction, 541 instances of non-geometrical words still occurred (e.g., golden arches, shield, coffin, bridge). They used non-geometrical words more frequently when the diagram was more cluttered, seemingly to simplify the description (similar to the idea of using hierarchical descriptions). Curiously, they sometimes would use non-geometrical words even if there were no clear way to draw the object from the word (e.g., the word “bridge” for the shape “][”).
Text versus Speech:
In determining how people naturally describe shapes, we wanted to see whether participants would use a different vocabulary when describing shape orally than when describing shapes textually. Thus, we had participants do both.
We found that participants’ oral language was not markedly different from their typewritten language. All but 4 participants tended to type what they spoke, even when the description was quite long and difficult to remember. Of the words that were used only in speech or only in typing, none were used more than 7 times each. Of those used more than 4 times, all were labels (e.g., “s”), typed misspellings (e.g., “diagnol”), typed shorthand (e.g., “1/3” versus “one third”), or stop words (e.g., “what,” “guess”) that were not present in a typed description. The 4 participants who did not type and speak the description similarly were computer science researchers. They tended to type descriptions similar to those they had learned in other graphical languages (e.g., “box w 2 h 1”).
We also wanted to test whether non-geometrical words were more prevalent in spoken descriptions where the participant was interacting with a human as compared with interacting with a computer. We found that this was not the case; subjects used the same number of context words in both the spoken and the typed sections. In fact, the number was smaller in spoken descriptions (2.93% of spoken and 3.02% of typed), but not significantly so.
Novice versus Experienced:
We wanted to see whether experience changed people’s vocabulary. We found that while mostly the same words
were used in both the Novice and in the Experienced section, the number of instances did change for those words. Of the words that were used only in one section, only one word was used more than 9 times: “some” was used 14 times in the Novice section, but never in the Experienced section.
Participants definitely seemed to improve their descriptions in the second section. In the Novice section, participants often would falter with how to describe something, pausing for a long time before beginning. The descriptions in the Novice section were often convoluted. Between the Novice and Experienced sections, participants would read other people’s descriptions and attempt to draw their shapes; after seeing others’ descriptions, they often would pick a simpler way to describe something, and their descriptions would be much easier to understand. A common example was the “horizontal rectangle,” which was described in the Novice section in such convoluted ways as “It’s a quadrilateral with two pairs of lengths, two different pairs of lengths. Each pair is congruent in length.” In the Experienced section, however, it would almost always be described as a “horizontal rectangle” or “a rectangle wider than it is tall.”
If we compare the number of occurrences of a word in the Novice section versus the Experienced section, we can observe the changes in word choice. If we take the absolute difference of the number of occurrences in each section, 8 words have an absolute difference of 40 instances or more. Of these 8 words, all were much more frequent in the Experienced section, displaying convergence into a single shared vocabulary. It suggests that at the beginning, various words were used to describe a concept until the appropriate word was found and then repeatedly used. To give an example, “horizontal” was used 68 more times in the Experienced section than in the Novice section: a threefold increase, from 31 occurrences in the Novice section to 99 occurrences in the Experienced section. This was the largest factor of increase among those 8 words.
Since participants were able to find the appropriate word choice more quickly, we expected that the Experienced descriptions would contain fewer words. However, the Experienced descriptions were longer, containing 7 more words per description on average (28.46 versus 35.40). Although participants described concepts more concisely, they often added words to describe other parts of the shape more precisely.
LANGUAGE CHOICES
As stated previously, our initial version of the LADDER language accounts for 97% of all words used in this study.
By including perceptually important constraints, we argue that the resulting language is more intuitive and easier for humans to use. We also argue that the resulting descriptions are likely to be more accurate and likely to produce better descriptions because the descriptions focus on only those details that are perceptually important. By focusing on perceptually important constraints, we simplify
the language. As a result, we have no need for constraints that specify angles at a finer granularity than horizontal, vertical, positive slope, or negative slope. We argue that this narrowing of the language makes it more comprehensible and easy to find the appropriate constraints to describe a shape.
The LADDER language also allows developers to specify shapes hierarchically (specifying a shape that is the same as another, but with something added), using abstract shapes (two different shapes may share common properties, such as a “body” in mechanical engineering), using local geometrical context (geometric relations based on other shapes on the screen, e.g., “this shape is bigger than that shape”), and using similarity (again, only by hierarchy); all of these methods of shape descriptions were shown to be commonly used by humans in the study.
Figure 5. Images of automatically generated sketch recognition user interfaces using the shape language. Language Use
This paper describes the initial choices for the LADDER shape description language, but we must ask ourselves how can we measure the effectiveness of this language selection. To measure the language vocabulary, sketch recognition systems for over 30 domains by more than 20 different users have been effectively created using the LADDER sketch language. Sample domains include mechanical engineering, finite state machines, electrical circuits, chemical diagrams, flow charts, UML class diagrams, UML sequence diagrams, stick figures, and many more (Figure 5) [8]. Using the principles in this paper, the
shape recognizers for each sketch recognition system been automatically generated after supplying only a single example of each shape. The system then applies the principles in this paper in reverse to automatically generate a description and then a recognizer for each shape [8]. Also, as noted before, previous sketch recognition systems have contained on the order of 10-20 shapes. Using the LADDER language, we have been able to create a system that recognizes 923 distinct shapes in real-time, and achieved a recognition accuracy of 83% (and a top-3 accuracy of 87%) on a corpus of over 11,000 sketches. This is almost two orders of magnitude larger than any existing system, and has been made possible through the results of this study and the resulting language that has been developed from this study.
FUTURE WORK
The study showed that humans use a variety of forms of context to identify and describe shapes, including non-geometrical cultural contextual clues and similarities to other shapes. For the class of shapes we have handled thus far in recognition, this has not been a problem, but it certainly could be, given how prevalent it was in the study. Both techniques could be a valuable addition to the language and an interesting research problem. In order to allow developers to describe shapes in terms of everyday cultural objects, we would have to (1) define each of the objects that may be used in a description and (2) come up with a similarity metric for comparing them. Given the number of objects in our everyday lives, this is a substantial task. We suggest that a commonsense database, such as OpenMind [20], for accessing everyday objects might help in implementing this technique.
CONCLUSIONS
This paper presents the methodology and results of a study conducted to determine how people describe shapes. Results show that Gestalt principles of perception, similarity, and context play an important role in how people describe shapes. The results of this study have been used to help implement and refine the LADDER shape description language used to recognize shapes in a sketch interface. ACKNOWLEDGEMENTS
This project is funded in part by NSF grants 0757557 and 0943499, as well as the DARPA Computer Science Study Panel. The authors would like to help past and current members of MIT’s Design Rationale Group and TAMU’s Sketch Recognition Lab.
REFERENCES
[1] Bimber, O., Encarnacao, M., and Stork, A. A multi-layered architecture for sketch-based interaction within virtual environments. Computer and Graphics: Special Issue on
Calligraphic Interfaces: Towards a New Generation of Interactive Systems 24(6), 2000, 851–867.
[2] Caetano, A., Goulart N, Fonseca M, and Jorge J. Sketching user interfaces with visual patterns. Proceedings of the
1st Ibero-American Symposium in Computer Graphics (SIACG02), 2002, 271–279.
[3] David, L. Perceptual Organization and Visual
Recognition. Kluwer Academic Publishers: Nowell, MA, 1985.
[4] Futrelle, R.P., and Nikolakis, N. Efficient analysis of complex diagrams using constraint-based parsing. ICDAR-95
(International Conference on Document Analysis and Recognition), 1995, 782–790.
[5] Gips, J. Computer implementation of shape grammars.
NSF/MIT Workshop on Shape Computation, 1999.
[6] Goldmeier, E. Similarity in visually perceived forms.Psychological Issues 8:1, 1972.
[7] Egenhofer, M.J. Query processing in spatial-query-by-sketch. Journal of Visual Languages and Computing 8(4), 1997, 403–424.
[8] Hammond, T., and Davis, R. Automatically Transforming Symbolic Shape Descriptions for Use in Sketch Recognition. AAAI, 2004.
[9] Jorge, J., and Glinert, E. Online parsing of visual languages using adjacency grammars. 11th International IEEE
Symposium on Visual Languages, 1995, 250-257.
[10] Keating, J., and Mason, R. Some practical aspects of covariance estimation. Pattern Recognition Letters, 3(5), 1985, 295–350.
[11] Lee, S.-W. Recognizing circuit symbols with attributed graph matching. (Baird, Bunke, Yamamoto, Eds.) Structured
Document Image Analysis, 1992, 340–358.
[12] Long, A.C. Quill: a Gesture Design Tool for Pen-based User Interfaces. PhD Thesis. EECS department, computer science
division, U. C. Berkeley, Berkeley, California, 2001.
[13] Mahoney, J., and Fromherz, M. Three main concerns in sketch recognition and an approach to addressing them. Sketch
Understanding, Papers from the 2002 AAAI Spring Symposium,
AAAI Press, 2002, 105–112.
[14] Myers, B.A., McDaniel RG, Miller RC, Ferrency, A.S., Faulring, A., Kyle, B.D., Mickish, A., Klimovitski, A., and Doane, P. The amulet environment: New models for effective user interface software development. IEEE Transactions on Software
Engineering, 23(6), 1997, 347–365.
[15] Rubine, D. 1991. Specifying gestures by example.
Computer Graphics, 25(4), 1991, 329–337.
[16] Sarkar, S., and Boyer K. Quantitative measures of change based on feature organization: Eigenvalues and
eigenvectors. Computer Vision and Image Understanding 71(1), 1998, 110–136.
[17] Saund, E., Mahoney, J., Fleet, D., Larner, D., and Lank, E. Perceptual organization as a foundation for intelligent sketch editing. Sketch Understanding, Papers from the 2002 AAAI Spring
Symposium, 2002, 118–125.
[18] Shilman, M., Pasula, H., Russell, S., and Newton, R. Statistical visual language models for ink parsing. In Sketch
Understanding, Papers from the 2002 AAAI Spring Symposium,
AAAI Press, 2002, 126–132.
[19] Stiny, G., and Gips, J. Shape grammars and the generative specification of painting and sculpture. Information
Processing, 71, 1972, 1460–1465.
[20] Stork, D.G. The open mind initiative. IEEE Expert
Systems and Their Applications: 14(3), 1999, 16–20.
[21] Veselova, O. Perceptually based learning of shape descriptions. Master’s thesis, MIT, Cambridge, 2003. [22] von Ehrenfels, C. Über gestaltqualitäten.
Vierteljaheresschrift für wissenschaftliche Philosophie, 1890.
[23] Wertheimer, M. Productive Thinking. New York: Harper, 1959.
Appendix 1. The complete listing of the 90 images used in the study. This represents a subset of the total number of military course of action diagrams.