C E N T R E D' ÉT U D E S E T D E R E C H E R C H E S S U R L E D E V E L O P P E M E N T I N T E R N A T I O N A L
SÉRIE ÉTUDES ET DOCUMENTS
How do agro-pastoral policies affect the dietary intake
of agro-pastoralists in Niger?
Christophe Muller
Nouréini Sayouti
Études et Documents n° 18
June 2019
To cite this document:
Muller C., Sayouti N. (2019) “How do pastoral policies affect the dietary intake of agro-pastoralists in Niger?”, Études et Documents, n° 18, CERDI.
CERDI POLE TERTIAIRE 26 AVENUE LÉON BLUM F-63000 CLERMONT FERRAND TEL.+33473177400 FAX +33473177428 http://cerdi.uca.fr/
2
The authors
Christophe Muller Professor of Economics
Aix-Marseille Université, CNRS, EHESS, École centrale Marseille, IRD, AMSE, France. Email address: christophe.muller@univ-amu.fr
Nouréini Sayouti
PhD Student in Economics
Université Clermont Auvergne, CNRS, IRD, CERDI, F-63000 Clermont-Ferrand, France and Projet d’appui au secteur de l’élevage, Niamey, Niger.
Email address: noureini.sayouti@gmail.com
Corresponding author: Christophe Muller
This work was supported by the LABEX IDGM+ (ANR-10-LABX-14-01) within the program “Investissements d’Avenir” operated by the French National Research Agency (ANR).
Études et Documents are available online at: https://cerdi.uca.fr/etudes-et-documents/
Director of Publication: Grégoire Rota-Graziosi Editor: Catherine Araujo-Bonjean
Publisher: Mariannick Cornec ISSN: 2114 - 7957
Disclaimer:
Études et Documents is a working papers series. Working Papers are not refereed, they constitute
research in progress. Responsibility for the contents and opinions expressed in the working papers rests solely with the authors. Comments and suggestions are welcome and should be addressed to the authors.
3
Abstract
We investigate the causal mechanisms underlying the effect of agricultural policies directed toward pastoralist households in Niger on their dietary intake. To do so, we conduct a causal mediation analysis while referring to theoretical agricultural household models. The presumed mediator of interest is the annual profit from pastoral activities. We decompose the total effect of selected policies on pastoralist dietary intake into an indirect effect, i.e., the effect that operates through profits, and a residual direct effect. Using an agro-pastoral survey conducted in Niger in 2016, the effects of extension services associated with better access to markets are found to be channeled through households’ annual profits from cattle and sheep raising, while this is not the case for private veterinary services and low-cost livestock feed programs. Extension services may foster specialization in cattle and sheep raising, which may incentivize households to move toward a nomadic lifestyle and change their food habits and thereby have detrimental consequences on their calorie intake. Besides, other life choices could be spurred or hampered by policies, such as migrations and radicalization.
Keywords
Agro-pastoral policies, Mediation analysis, Agricultural household models, Niger.
JEL Codes
Q18, Q12.
Acknowledgments
This paper was supported by the African Economic Research Consortium under grant no. RC175533 and by the French National Research Agency (ANR), under the TMENA2 project (ANR-17-CE39-0009-01) (http://christophemuller.net/tmena/). The authors are grateful to the National Institute of Statistics of Niger and the Ministry of Livestock of Niger for their collaboration and for providing us with the data.
4
I.
Introduction
The Sahel region is one of the poorest in the world. The Food and Agricultural Organization of the United Nations (FAO, 2016) estimates that an average of 20 million people suffer from malnutrition and food insecurity in the region each year, mainly during the lean season. It also estimates that in 2016, nearly 6 million children under five were acutely malnourished, which may explain approximately one-third of child mortality in the Sahel. Other researchers, such as van Wesenbeeck, Keyzes and Nubé (2009), find a lower prevalence of hunger and higher and less inequality spread mean calorie intake in Africa than does the FAO. However, undernutrition still appears to be severe in the Sahel.
For decades, Sahelian countries have tried, individually or jointly, to provide solutions to this problem through agricultural policies. One of the key sectors on which these policies have focused is pastoralism, which is well fitted to the agroecological conditions in this region and is the main source of income for many households.
This is the case for a regional project supporting pastoralism called "PRAPS", which is financed by the World Bank and involves six Sahelian countries (Burkina Faso, Chad, Niger, Mauritania, Senegal and Mali). One of the main objectives of this project is to improve the income, productivity, sustainability and resilience of pastoral livelihoods. It is assumed that this improvement should enable households to enhance their nutritional intake. We base our analysis on the Niger survey of this project.
One difficulty in analyzing this policy strategy is that households live in an imperfect market context, and consequently, their production and consumption decisions are not separable (de Janvry & Sadoulet, 2006). Several authors1 have
shown, in diverse developing contexts, that a household’s production strategies can influence its nutritional and health statuses beyond the effect of varying agricultural profit. However, household agricultural profit remains the indicator most widely used by analysts to monitor the success of agricultural policies.
1Carletto, Ruel, Winters, & Zezza, 2015; Dillon, McGee, & Oseni, 2015; Muller, 2009
5 Therefore, it still seems useful to examine how improving agricultural income can improve nutrition.
One issue is that the health and nutrition status of producers may directly affect their productivity and efficiency, as found by Croppenstedt & Muller (2000) in Ethiopia. This implies that endogeneity issues affecting production income may arise when estimating an equation determining nutrition intake in which agricultural outputs or profits are included as explanatory factors.
The path of policy effects on nutrition through agricultural income can be illustrated by using Agricultural Households Models (AHMs) that theoretically combine producer and consumer decisions (Squire, Strauss & Singh, 1986). There are two types of AHMs: separable and non-separable. For separable AHMs, it is assumed that markets are complete and perfectly competitive. In that case, households are price takers in all markets for all the commodities that they consume or produce. Their production decisions are independent of their consumption and labor supply decisions, but the reverse is not true. Households may be seen as first making production decisions that maximize their farm profit and then making decisions on their consumption and family labor supply, given their full income that includes their farm profits. Then, the focus of most agricultural policies on farm profits borrows some theoretical foundations from considering separable AHMs.
In contrast, in the case of non-separable AHMs, it is often assumed that at least one market is missing or imperfect. Households no longer behave as profit-maximizing producers, and their production, consumption and labor supply decisions are jointly (instead of recursively) determined. This implies that the prices of all consumer goods and all household characteristics, including consumer preferences, can affect production decisions. Thus, non-separable AHMs provide a theoretical foundation for extending the focus of agricultural policies, not only to farm productivity and output levels, instead of agricultural profit, but also on other dimensions of household situations.
When dealing with these two approaches, a legitimate question is to what extent an increase in the income of agricultural households may contribute to improving
6 their nutritional intake. Another question is, in the first place, whether agricultural policies have a positive impact on agricultural household income. Answering these two questions is well suited to the separable AHM perspective, in which the effects of agricultural policy on nutrition should pass exclusively through an increase in agricultural profit.
A few authors have already looked into these two questions, although most of them have focused on one question only: the effect of agricultural production on nutrition (e.g., Carletto et al., 2015). These studies highlight the complex nature of the relationship between agriculture and household food and nutritional security and emphasize other factors (e.g., resource allocation, intrahousehold dynamics, networks) that may affect this relationship. These analyses may be more consistent with the non-separable AHM perspective. However, the mechanisms by which agricultural policies impact household nutrition intake remain largely unclear.
Investigating whether agricultural policies have a positive impact on households’ agricultural profits and whether this positive impact is fully translated into households’ nutritional intake will help us to shed light on these mechanisms linking agriculture and rural households’ food and nutrition intake.
To do this, we will examine a variety of policies and investigate their effect through household agricultural profit or through other channels. We will conduct a causal mediation analysis of these polices by using methods akin to those discussed in Heckman and Pinto (2013) and in Vanderweele (2015). Causal mediation analysis has already been used to analyze the impact of campaigns promoting staple food adaption on dietary intake (de Braw et al., 2018) but not specifically in the context of agricultural household models. Specifically, in this investigation, household agricultural profit is examined as a potential mediator of interest in policies, in line with the theory of the AHM. We apply this new approach to the case of Niger and three types of policies: (i) extension services, (ii) veterinary services, and (iii) input subsidies. The rest of the paper is organized as follows. In Sections 2 and 3, we present the context of the study and the data. Section 4 discusses the empirical strategy, while Section 5 reports the estimation results. Finally, Section 6 concludes the paper.
7
II. The Context
II.1.
The livestock sector, poverty and malnutrition in Niger
Niger is a landlocked country with a land area of 1,267,000 square kilometers and a population of 17 million in 2014. The annual population growth rate is approximately 3.3 percent. The country’s economy is essentially based on the agricultural sector, with a large contribution from the livestock sector. In fact, 40 percent of Niger’s GDP is derived from the agricultural sector, and 11 percent is derived from the livestock sector (Ministère de l’Elevage, 2016).
The livestock sector is a mainstay of the country’s economy. Of Niger’s total population, 87 percent is involved in this sector as a primary or secondary activity, while 10 percent of rural households’ income, up to 43 percent for households in pastoral zones, comes from livestock (Ministère de l’Elevage, 2016).
In a survey conducted in 2011 by the National Institute of Statistics in Niger on living standards and agriculture, Zezza & Issa (2012) found that 77 percent of the 4,000 households interviewed raise livestock. They also show that in rural areas in 2005, four out of five households in this survey hold or keep on average 2.8 Tropical Livestock Units (TLUs)2 per household.
Haan (2016) indicates that between 2008 and 2013, based on their income or expenditure levels, up to 30 percent of the pastoral and agro-pastoral populations are “very poor”, while 30 percent are “poor”, 20 percent are considered to be “middle” and 20 percent to be “well-off”. However, measured monetary income typically omits the asset value of livestock, which may lead to underestimating the wealth of these households. It also misses the role of livestock as a source of insurance and prestige.
Currently, the combined effects of climate change, drought, flooding and desertification, and demographic pressure have brought the pastoral economy to disarray. In the purely pastoral sector, the mean livestock ownership is 1.9 TLU
2 Tropical Livestock Units are livestock numbers converted to a common unit. Conversion factors
are: cattle = 0.7, sheep = 0.1, goats = 0.1, pigs = 0.2, chickens = 0.01. See the International Food Research Institute and Harvest Choice : http://harvestchoice.org/data/an05_tlu for more details. The benchmark tropical livestock unit is commonly taken to be an animal of 250 kg liveweight (International Livestock Centre for Africa, 1988).
8 per capita, versus 0.6 TLU per capita in the agro-pastoral sector. According to Haan (2016), these levels are low when compared to “the minimum required to meet basic needs, avoid livestock inbreeding, and recover from drought, which is between 2.5 and 4 TLU per capita for pastoralist households and half of that for agro-pastoralist households”. This is a matter of concern because below this level, it is difficult for households to move out of poverty even in favorable periods. In contrast, those above this threshold should not only be able to regenerate herds after droughts but also use their animals to maintain the social networks on which they can rely during critical periods.
Niger is one of the most vulnerable countries in the world, with 20 percent of rural households being food insecure in any given year (Ballo & Bauer, 2013). In 2010, 26.8 percent of agro-pastoralist households were most affected by food insecurity, and during this year, the global acute malnutrition (GAM) among children under five years of age was very severe in agro-pastoral and pastoral areas. For the Tilaberi region, the GAM was up to 14.8 percent, which is near the WHO threshold of 15 percent (United State Agency for International Development, 2011). This extreme situation was largely a consequence of the 2009/2010 food crisis, which was characterized by harvest collapse, very short rainfall, and consecutive years of prolonged droughts.
II.2 Agricultural policies in Niger to alleviate poverty and food insecurity
In 2011, one year after the food crisis, the country put in place a long-term agricultural and food policy program, denoted “Initiative 3N: les Nigériens Nourissent les Nigériens” (Nigeriens Feed Nigeriens). The aim of this program is to end famine and malnutrition in the country and should be completed by 2035. In the livestock sector, the goals of this policy are (i) to increase fodder availability by creating livestock feed warehouses, livestock feed banks, mills, and municipal supply centers; (ii) to increase water availability by digging wells; (iii) to develop vaccination for animals; (iv) to enhance extension services targeted toward pastoral and agro-pastoral households; and (v) to give fodder, multi-nutrient block and fodder seeds to vulnerable pastoralist and agro-pastoralist households.
9 This research analyzes how these components of Initiative 3N affect the nutritional intake of these households through their agricultural profit, or otherwise. In particular, we focus on three policies: (i) extension services, (ii) private veterinary services and (iii) low-cost livestock feed.
Extension services
These services include two types of professional advice: the first is related to the use of livestock feed, while the second encourages households to use modern animal health services, appropriate breeding techniques and modern feeding. To obtain the first type of advice, households must visit a livestock feed bank, also called “the peasant’s house”. The “peasant’s houses” are held by government technical services, municipalities, farmers’ associations or cooperatives. The livestock feed bank also seeks to i) bring livestock feed closer to the most remote households and ii) provide a security stock that can be mobilized during the hot dry season when livestock feed is scarce on the market and especially expensive. The second type of advice is typically provided at the beginning of the pastoral campaign every year by farmers’ associations and by technical services of the Ministry of Livestock.
Private veterinary services
Private veterinary services complete similar public services and are delivered by either a simple private veterinarian or a local private veterinary service. The private veterinarian is generally based at the department level. He often holds a veterinary pharmaceutical stock with the mandate of carrying out free vaccination campaigns financed by the government.
The local private veterinary services are led by a private veterinarian who runs a network of approximately thirty auxiliaries. These auxiliaries may be community agents, such as villagers chosen by the community, and trained by the private veterinarian. An auxiliary is a private agent who intervenes at the village level and covers 10 to 15 villages. The local private veterinary services and their auxiliaries provide households with various animal health services, such as vaccination, treatment of animal diseases, and advice.
10
Low-cost livestock feed (input subsidies)
Each year, the government assesses the country’s fodder deficit and purchases fodder to meet needs in deficit areas. The purchased stock is disseminated in the peasant’s houses for sale at moderate prices. However, the purchased stock never covers more than 50 percent of needs (Ministère de l’Elevage, 2015). Let us now turn to the data used for the estimations.
III. Data and variables
III.1. DataThis paper uses data from a specialized survey collected by the Ministry of Livestock in Niger. This survey was conducted for two projects: “PRAPS: Projet Régional d’appui au Pastoralism au Sahel” and “PASEL: Programme d’Appui au Secteur de l’Elevage”. The first project covers six countries in the Sahel (Niger, Mauritania, Chad, Mali, Burkina Faso, and Senegal); the second covers Niger only (Ministère de l’Elevage, 2016).
The survey was conducted in three waves (2016, 2017, and 2018) with the same households in Niger. Unfortunately, we have access only to the first wave that was conducted in October 2016. The survey covered the seven regions of the country, and approximately 1,350 pastoral and agro-pastoral households were sampled. First, 90 villages were selected proportionally with respect to size. Then, within each selected village, households were drawn randomly. In each village, households were a priori divided into three categories (small, medium and large producers), according to the size of their herds, and in close collaboration with the villagers.
The surveyed households were asked about their socio-demographic characteristics, budget, food consumption, agro-pastoral production, livestock holdings, agro-pastoral sales and the prices they face individually.
We also have access to information on different shocks that these households suffered (shocks related to animal fodder, animal diseases, and access to water) and on strategies that they developed to respond to these shocks. Finally, there is
11 precise information on the access these households had to the three selected agricultural policies (input subsidies, veterinary services and extension services). We employ the Global Positioning System (GPS) coordinates for each surveyed household to match them with climatic data on local precipitation and temperature. For each household, we collect from the website for NASA’s Prediction of Worldwide Energy Resource Project annual data on minimum, maximum and average temperatures in degrees Celsius at 2 meters of altitude, as well as annual precipitation data measured in millimeters per day. This provides us with valuable instrumental variables that will allow us to handle endogeneity problems in our regressions.
In this study, we will focus on households that own sheep and cattle because the information collected on this group of households is the most complete. This leaves us with 600 households’ observations after cleaning the data and removing outliers.
III.2. Construction of variables
In this section, we present the outcome and treatment variables. We use two types of outcome variables (nutrition indicators and household profit from livestock activity) and three treatment variables, corresponding to the considered agricultural policies. The treatments are each described by a dummy variable that takes value 1 when the household reported that it had access to the policy and 0 otherwise.
Nutrition intake indicators
Two nutrition indicators are constructed: the household dietary diversity score and the household’s caloric intake per capita per day. The dietary diversity score records how many different food groups have been consumed by the household over a given reference period and is a good proxy for diet quality. Following the FAO, 12 food groups are used to compute the dietary diversity score (Swindale & Bilinsky, 2006). Table 1 shows how the food products recorded as consumed by the household are categorized into these groups.
12 Table 1: Classification of food products
Food group Food Product (from survey)
A. Cereals Millet, sorghum, bread, maize, edible pasta
B. Roots and tubers -
C. Vegetables Condiments, okra
D. Fruits -
E. Meat, poultry, offal Meat, poultry
F. Eggs -
G. Fish and seafood Fish,
H. Pulses/legumes/nuts Cowpea, sesame seeds, groundnuts
I. Milk and milk products Fresh milk, curdled milk, cheese
J. Oils/Fats Oil, butter
K. Sugar/honey Sugar
L. Miscellaneous Tea
Notes: Classification made by the authors using the food groups proposed by the FAO.
If the household reports that it consumes one of the food products belonging to a specific food group, an index value of 1 is attributed to this household for the corresponding food group, 0 otherwise. As we can see from Table 1, none of the foods consumed by the surveyed households belong to the food groups of roots and tubers, fruits or eggs. This is because the survey does not provide any information on the consumption of these food groups due to their low frequency for agro-pastoralists. Finally, a dietary diversity score is computed for each surveyed household as the total number of food groups consumed by the household.
Caloric intake per capita per day
The caloric intake per capita per day for each household is computed by converting the food quantity consumed by the household into calories during the year. For this, we use the food composition table provided by the FAO for West Africa in 2012 (Stadlmayr et al., 2012). We separately compute caloric intake coming from cereals (millet, sorghum, bread, maize and edible pasta) and from animal food products (meat, poultry, fish, fresh milk, curdled milk and cheese).
13
Profits from livestock activity
The last outcome variable computed is the household’s annual profits from livestock activity. One of the difficulties we encountered concerns measuring these households’ output. After several attempts, we decided to consider only three outputs: cattle, sheep and milk production (fresh milk and curd), which correspond to the best measured information. For cattle and sheep production, we use the animals sold and slaughtered by the household as a measure of output because variations in stocks are unobserved. For milk, we use total household production. We were not able to take into account variation in stock for milk production between two years due to the lack of such information in the survey.
All these production measures are valued at market prices3 faced by each
household. The total amount of these production values amounts to the gross income of the households from pastoral activity.
For the production costs, we are able to track four monetarily valued costs: costs related to the herd's health, livestock water consumption, feed consumption, and labor costs (for shepherds and market intermediaries for the sale of animals). These costs are reported by each surveyed household for the whole herd. The (restricted) profit is obtained by subtracting the total observed costs from the obtained gross income. All other unobserved costs and benefits must be neglected. In the next section, we briefly discuss a few descriptive statistics.
III.3. Summary statistics
Household characteristicsTable 2a reports a few descriptive statistics for the variables used in this work. The average age of the household head in our sample is 45 years, and nearly 95 percent are male. The majority of the heads (94 percent) have no education, with only 4 percent having received primary education. We also note that the average size of households is 7 members, most of whom are children.
3The cattle and sheep prices are given by animal sex and age. For animals consumed by the households, we then compute
14 Our sample is mainly composed of households whose head belongs to the Fulani ethnic group (55 percent), followed by the Tuareg (23 percent) and the Haussa (14 percent).
Table 2a: Summary statistics
Notes: To calculate the caloric intake from cereals and from animal food products, the considered cereals are millet,
sorghum, bread, maize, and edible pasta, while the animal food products considered are meat, poultry, fish, fresh milk, curdled milk, and cheese.
The seven regions of the country have been grouped into two zones: the
North and the South. The North is formed by the regions of Agadez, Diffa, Maradi and Zinder and the South by the regions of Tahoua, Dosso and Tillabery. Most of the households in our sample (60 percent) live in the South.
Variables N. Obs Mean Std. Dev Min Max
Sociodemographic variables
Sex of household head (1 if male) 600 0.95 0.23 0 1
Age of household head 596 44.76 14.66 17 92
Instruction level of household head
- None (1 if yes and 0 otherwise) 600 0.94 0.23 0 1
- Primary (1 if yes and 0 otherwise) 600 0.04 0.19 0 1
Household size 600 7.14 3.68 1 25
Number of children (0-3 years old) 600 0.82 0.97 0 6
Number of children (4-10 years old) 600 2.02 1.66 0 9
Number of youths (11-16 years old) 600 0.88 1.08 0 8
Number of young adults (17-20 years old) 600 0.80 0.93 0 5
Number of adults (>20 years old) 600 2.65 1.52 0 11
Area of living (1 if in the South) 600 0.60 0.49 0 1
Ethnic group
- Tuareg (1 if yes and 0 otherwise) 600 0.23 0.42 0 1
- Haussa (1 if yes and 0 otherwise) 600 0.14 0.35 0 1
- Fulani (1 if yes and 0 otherwise) 600 0.55 0.49 0 1
Livestock holding
Number of sheep 600 10.04 31.44 0 638
Number of cattle 600 6.55 9.36 0 61
Livestock holding category
Small producer 600 0.56 0.5 0 1
Large producer 600 0.15 0.36 0 1
Outcomes variables
Caloric intake per capita per day(Kcal) 600 3,987 3,874 16.70 21,166
Caloric intake per capita per day from cereals (Kcal) 600 3,242 3,222 15.66 20,984
Caloric intake per capita per day from animal food product (Kcal)
600
208,81 980 0 12,539
Household dietary diversity score 600 5.39 1.73 1 9
Annual profit from livestock production (Millions of
CFA) 600 3.89 18.3 -1.63 257
Policies
Access to extension services (1 if yes and 0 otherwise) 600 0.19 0.39 0 1
Access to private veterinary services (1 if yes and 0
otherwise) 600 0.20 0.40 0 1
Access to low-cost livestock feed (1 if yes and 0
15 As previously stated, households were classified into three categories according to the size of their herds: small herders (5 sheep and 4 cattle, on average), medium herders (10 sheep and 8 cattle) and large herders (29 sheep and 14 cattle). The majority (56 percent) of households in our sample belong to the category of small herders. Only 15 percent of the households surveyed are large herders. When considering all categories, the average number of animals per household is ten for sheep and seven for cattle.
As mentioned above, nutrition intake is measured by two indicators: caloric intake per capita per day and dietary diversity score. In our sample, the household dietary diversity score varies between 1 and 9, with an average of 5. This means that, on average, the surveyed households consume five different food groups during the year. During the year, food consumption provided an average of 3,987 Kcal per person per day for each household. However, 25 percent of surveyed households have caloric energy intakes less than 1,584 Kcal per person per day, while for 50 percent of the households, these intakes are less than 2,775 Kcal per person per day. Additionally, on average, almost 83 percent of caloric intakes come from cereals, and only 4.4 percent strictly come from animal food products. It seems likely that caloric intake from animal products has not been sufficiently recorded. In particular, omission errors may occur due to the recall period for recording the consumption levels of households, which is 3 months. Therefore, households may have had difficulties correctly recalling the quantity of food products they consumed. Moreover, animal products are often mixed with vegetable products when consumed and may have been confused with them when describing meals. From Table 2a, we note that the profit level varies substantially across households. On average, the annual profit is 3.89 million CFA francs. During the survey period, 25 percent of households had zero profit, and half of them had a profit above 214,073 CFA francs. The most extreme profit loss observed is equal to nearly 1.6 million CFA francs. This may be due partly to measurement errors and partly to the fact that annual profit is an imperfect measure of economic activity for livestock raising, the production horizon of which may extend to many years.
16 In the sample, 20 percent of households surveyed have access to private veterinary services, while only 19 percent and 15 percent report having access to extension services and low-cost livestock feed, respectively.
Our outcome variables, the two household nutrition intake indicators and the profit variable, are each transformed into logarithmic form for the econometric analysis. When transforming the annual livestock profit into logs, we add a constant amount to the profit level to accommodate negative values. The transformed profits are therefore log (profit + constant), where the constant is equal to the minimum observed value of profit, in absolute terms, plus one.
As we can see from Table 2b presented below, the outcomes of households that have access to a policy generally differ from those who do not. The households that have access to extension services have a 42 percent lower caloric intake than those that do not. However, their dietary diversity score is 14 percent higher than that of nontreated households. They also consume more animal food products and less cereals than those that do not have access to extension services. Households with access to low-cost livestock feed or private veterinary services have a higher dietary diversity score and consume more animal food products than cereal food products than households that do not have access to these policies. Regarding the annual profit from livestock production, we note that for the three policies considered, those that have access to each of these policies are better off than those that do not. These data are therefore appropriate for the analysis that we want to conduct, and we describe our empirical strategy in the next section.
17
Table 2b: Summary statistics
Policies
Extension services Low-cost livestock feed Private veterinary services No
Access Access Diff
No
Access Access Diff
No
Access Access Diff Outcomes
(mean values)
Log of total caloric intake per capita per day 7.81 (.05) 7.38 (.14) .42*** (.14) 7.71 (.06) 7.77 (.12) -.05 (.15) 7.77 (.06) 7.54 (.10) .23* (.14) Log of caloric intake per capita per day
from cereals food product
7.60 (.06) 7.08 (.15) .52*** (.14) 7.49 (.06) 7.52 (.12) -.03 (.16) 7.56 (.06) 7.26 (.10) .30** (.14) Log of caloric intake per capita per day
from animal food product
3.73 (.08) 3.88 (.19) -.15 (.19) 3.69 (.08) 4.15 (.18) -.45** (.21) 3.71 (.08) 3.95 (.17) -.24 (.19) Log of household dietary diversity
score 1.58 (.02) 1.72 (.02) -.14*** (.04) 1.57 (.02) 1.80 (.02) -.23*** (.05) 1.57 (.02) 1.76 (.03) -.19*** (.04) Log of annual profit from livestock
production 14.69 (.05) 14.96 (.09) -.26*** (.10) 14.71 (.04) 14.94 (.11) -.23** (.12) 14.73 (.05) 14.83 (.08) -.10 (.10) Notes: Values in parentheses are standard errors. *, ** and *** indicate significance at the 10%, 5% and 1% level, respectively. Column Diff show the mean difference, for the outcome variable, between the group of households that do not have access to the policy and the group that does have access to it.
IV. Empirical Strategy
As mentioned above, our aim is to empirically investigate the causal mechanisms behind the impact of agricultural policies on household nutrition intake. Specifically, we want to assess the role played by pastoral profits in this process. In contrast, mainstream policy evaluation methods focus primarily on estimating the average treatment effect rather than investigating the underlying causal channels that drive this effect.
In the statistical literature, analyzing the causal channel through which a policy effect occurs, with a specific interest in the role of a particular variable, is referred to as causal mediation analysis4. A particular variable of interest is the mediator
of causal effects, which in our case is the profit from livestock activity.
Causal mediation analysis has been widely used in social science, especially in medicine, psychology and political science, as well as in experimental studies or observational studies. There is growing interest in extending the use of this method in economics5. Our empirical strategy is a form of causal mediation
analysis, where we investigate the extent to which the impact of agricultural
4Baron & Kenny (1986); Imai, Keele, Tingley, & Yamamoto (2011); Vanderweele (2015). 5Heckman et al. (2013); Heckman & Pinto (2015); Kosec, Ghebru, Holtemeyer, Mueller, & Schmidt (2017); De Brauw et al. (2018)
18 policies on pastoralist household nutrition in Niger is mediated by their profit from livestock activity.
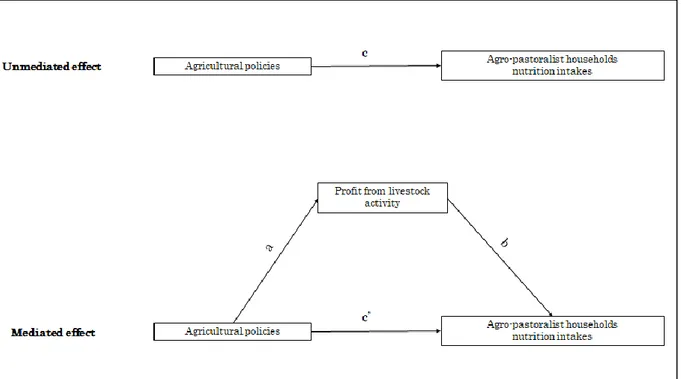
Figure 1: An illustration of our empirical strategy
This strategy can be specified in terms of the four links (a, b, c and c’) that are illustrated in Figure 1. The first link represents the unmediated effect (c in Figure 1) of the selected agricultural policies on the nutrition intake indicators for pastoralist households. The link a represents the effect of the selected policies on profits, which is the mediator, while link b represents the effect of profits on the household’s nutrition intake. These two links are used to assess the indirect effect of these policies on household nutrition intake, that is, their effect that is channeled through profits. The last link c’ represents the direct effect of these policies on household nutrition intake, that is, the effect that operates through channels other than the annual profit.
19 This strategy can be supported by referring to agricultural household models, separable or non-separable. Within this framework, causal mediation analysis may provide hints about the relevant type of agricultural household model for pastoralists in Niger.
Figure 2: Non-separable and separable household models
Notes: C=consumption, Q=production, L=labor, l=leisure, T=household total available time
Indeed, in separable models, the effect of the selected agricultural policies on a pastoralist household’s nutrition intake should fully and exclusively pass through its profit from livestock activity, while this should not be the case in non-separable models. As explained above, with separable AHMs, households make their production, consumption and labor supply decisions recursively, and income from farm profit is the channel by which production decisions affect consumption and labor supply decisions and, as a result, nutrition. Moreover, household consumption decisions do not affect production decisions. In contrast, in non-separable AHMs, the production and consumption decisions are made simultaneously, and households do not act as profit maximizers. In that case, the calculated profit level from the data may be nothing more than an arbitrarily weighted index of production levels and costs. Thus, in these conditions, it is unclear why it should play a full role as a mediator variable in a causal analysis. However, production remains entangled with consumption, and the availability of
20 empirical evidence on the share of possible causal effects of policies operating through production would still be valuable.
Figure 2 illustrates the household optimization problem in two simple cases of separability and non-separability. In the separable case and when we consider only one good and one input, say labor (the sum of family labor and hired labor is denoted by L), the household optimization problem consists of two steps. In the first step, the household chooses the optimal labor time (L*) and the optimal output
(Q*) that would maximize its profit given the prices it faces and its production
technology. This optimal point is determined by the tangent line, which is also the maximum isoprofit line, to the production function curve. The realized profit is added to other incomes to yield the full income of the household. In the second stage, this full income is incorporated into the household budget constraint (which determines the budget line in Figure 2) that is the unique constraint (once the time constraint has been substituted) on the maximization of the utility function, which is assumed to be increasing in consumption (C) and leisure (l). The optimal consumption level and leisure time are determined by the tangency of the budget line and the optimal household indifference curve.
In the non-separable case in which, for example, there is no market for labor, the optimal production and consumption levels are jointly determined. This is represented by the tangency of the production curve and the indifference curve. In that case, the profit effect vanishes.
To analyze this causal mediation, we use a combination of cross-sectional, retrospective, and observational data, which were collected in 2016, five years after the beginning of the implementation of Initiative 3N. We do not have any information on these households before 2011.
21
IV.1 Estimating the unmediated effect (c) of policies
In this step, we use a model of selection on observables based on the potential outcomes with and without treatment (i.e., with and without policy access).
In Niger, households may choose to have access to different agricultural policies. In that case, they select themselves into the treatment. In this context, the identification of the treatment effect relies on assuming conditional mean independence between the treatment and the outcomes. It is thus assumed implicitly that all the important characteristics that affect both household participation and the outcome are observable.
We evaluate the effects of the three policies separately because each policy was originally intended to resolve a specific problem. Therefore, depending on its needs, a household can decide to access them at different points in time, separately or not at all. For example, a household can decide to access private veterinary services during the dry-and-wet season, a season favorable to the development of livestock diseases. However, in the dry-and-hot season, it may instead decide to access the low-cost livestock feed program because of the scarcity of pastureland during this season. Thus, before deciding to access the low-cost livestock feed program, the effect of private veterinary services may have already been observed by the household since it had access to it. In this case, the household’s decision to access low-cost livestock feed is not simultaneous with its previous decision to access private veterinary services. Moreover, evaluating the simultaneous effect of the three policies may not be relevant in this setting because the survey does not provide any information on the precise time of the year when each household accessed a policy.
In the literature, various methods have been developed to construct a counterfactual based on nonexperimental observations. We use the “inverse probability weighted regression adjustment” (IPWRA) method discussed in Wooldridge (2010), which combines regression adjustment (RA) and inverse probability weighting (IPW). The IPWRA benefits from the double robustness property with respect to misspecifications of the RA and IPW components. In RA, a linear regression is specified from which a predicted outcome can be obtained,
22 while no restriction is imposed about the treatment. In IPW, a logistic regression is used for predicting the treatment status, while no formal model is used for the outcome. The IPWRA approach combines the two strategies by specifying a model for the outcome
Yi f X
Y i,
i, (1) and another for the treatmentPr
Ti 1
g X( T i, ) , (2) for households i = 1,2,3……. N, where N is the total number of households in our sample. In equations (1) and (2), XY is a set of covariates that influence theoutcome, Y, and XT is a set of covariates that explain the dummy variable for
treatment assignment, T. and
are parameter vectors to estimate, while i is an error term. The function f can be specified as a linear function when theoutcome is continuous, as in our case. As is typical, we specify the functiong to be
a probit function. One advantage of the IPWRA method is that, under the usual ignorability assumption, one obtains a consistent estimator of the effect of the treatment even if one of the two models is miss-specified (Wooldridge, 2007). We choose covariates that vary little over time to account for the fact that the data were collected five years after the beginning of the implementation of Initiative 3N and that these stable covariates can in a sense proxy for missing pretreatment covariates not affected by the treatment. We lack baseline information on households before the policy implementation.
The observed characteristics that are expected to affect the outcomes and household participation are the sex, highest reached level of instruction and age of the household head, the region of residence (North or South), the proportion of children below 3 years of age, the proportion of children between 4 and 10 years of age, and the proportions of youths and young adults. These characteristics can affect household food demand and diet composition. In fact, household composition may condition the type of food products that are consumed and shared within the household. For example, households with babies may consume more milk.
23 Additionally, some household characteristics, such as the sex of the household head, his age or his level of instruction, can affect its access to a given policy. Indeed, with a high level of instruction, households can easily access important information related to a policy, such as the start date and where it may take place. Additionally, some policies such as extension services may require a good level of instruction to implement the advice they provide.
We also include the household’s ethnic group and its livestock holding category in the treatment models. However, for the outcome models, we do not use the livestock holding category as a covariate because this stratification may be too endogenous.
With the IPWRA method, the treatment effect is obtained by first estimating the parameters of the treatment model to generate the predicted probability of being treated for each individual, g X( T i, )ˆ , where ˆ is the estimate of
. The obtained inverse probabilities are used as weights in the regression of the outcome model for each treatment (0 and 1).Then, to estimate the parameters for a linear model of the outcome, the IPW linear
least squares estimator is estimated separately for each treatment:
0 2 0 ( , ) min ˆ 1 ( , ) N i Y i i T i Y f X g X
if T , (3) i 0 and
1 2 1 ( , ) min ˆ ( , ) N i Yi i T i Y f X g X
if T . (4) i 1 Finally, the average treatment effect (ATE) is obtained by computing the difference between the means of the predicted outcomes of the two treatment groups:1 [ ( , ˆ1) ( , ˆ0)] N Y i Y i i ATE f X f X N
, (5) where ˆ1 and ˆ0 are the inverse probability-weighted estimated parameters of the outcome model for T and i 1 T , respectively. i 024 This procedure is also used to estimate the impact of the selected agricultural policies on the presumed mediator, i.e., the annual profit from livestock activity, by simply substituting it as the outcome variable.
IV.2 The effect of the annual profit from livestock activity
In this subsection, which corresponds to link b in Figure 1, we discuss the impact of the mediator on pastoralist households’ nutrition intake. To do so, we use a regression setting to estimate this effect with control variables (X in the model Y i
below) that are the same as in the previous subsection, except that we exclude the livestock holding category from the covariates to avoid a possible endogeneity problem.
However, as mentioned above, there might be a feedback effect between household production strategies and nutritional and health status or other types of confounders. To control for this, we run a 2SLS regression to estimate the effect of annual profit on nutrition intake. The two instruments are, first, a dummy for livestock disease and, second, local average annual temperature squared. Initially, we also considered temperatures in levels, but as they were always insignificant in the first stage equation, we dropped them and only retained the squared value. Formally, this amounts to
jointly estimating the following two equations for each policy j:
0 1 2 3 0 1 2 3 log( ) log( ) i ij i Y i i i ij Y i i profit T Z X Y profit T X (6)
The s and s are the parameters to be estimated, and , i i are the error terms of the second and first models, respectively. Tij represents the jth policy for the ith
household, while Zi denotes the two instruments for this household. While not
indicated in the notations, the parameters and errors terms vary with the considered policy.
System 6 allows us to estimate the impact of the mediator on household nutrition intake while controlling for a household’s access to a policy. The joint presence of the profit and policy variables in the outcome equation allows for partial contributions of the direct and indirect effects to a change in outcome. In addition, the other controls are similar to those used for the ATE estimates for the policies.
25 The two instruments are found to be significantly correlated (the linear correlation coefficients are 0.16 for livestock disease and 0.15 for the local temperature squared) with the logarithm of household profits from pastoral activity. However, they must not be correlated with caloric intake or the dietary diversity score. Under this exclusion restriction, the instruments influence the outcome only through their correlations with the logarithm of pastoral profits.
The exclusion restriction for livestock disease is justified by the fact that it is likely to be an unexpected external shock for households. Livestock disease should reduce herd fertility and milk production and thus negatively affect a household’s pastoral profits. When facing this type of shock, most surveyed households reported that they decided to sell the sick animals (30 percent of households surveyed) or to do nothing at all (32 percent). None of them reported that they had ex ante undertaken protection or insurance strategies, which supports the hypothesis that the shock is unanticipated.
Our second instrument is the local maximum temperature squared, which should also affect household nutrition intake only through its correlation with profits. Indeed, climatic shocks are beyond the control of households and typically unanticipated, which guarantee that the exclusion restriction is satisfied. The risk of hydrological and agricultural droughts increases as temperature rises. Thus, high temperature reduces the availability of pastureland and water for animals, which in turn negatively affects milk production and animal weight. These negative impacts reduce the market value of animals, and to prevent this loss, households may decide to sell their animals or to migrate to areas where it is less hot.
IV.3 Estimating the indirect and direct effects
As mentioned above, the indirect effect is the effect that operates through the annual profit, while the direct effect (represented by link c’ in Figure 1) is the effect that operates through channels other than the annual pastoral profit. The sum of these two effects forms the total effect (represented by link c in Figure 1).
26 The indirect effect is calculated as the product of the effect of policies on the mediator and the effect of the mediator on household nutrition intake (a b in Figure 1). The first effect a is estimated, on average, from the ATE formula in eq.5, while the second effect b is obtained from the System 6 estimates for parameter1
. The direct effect (c’) is therefore measured as the effect of the policies on the outcome when controlling for the effect of the mediator. It is measured by the parameter 2 in the second equation in System 6. The identification of this parameter relies on controls for the important household characteristics XY to be
able to assume conditional independence between the treatment and outcomes. The confidence intervals of the estimated indirect effect are computed with the Monte Carlo method proposed by MacKinnon, Lockwood, and Williams (2004)6. We
now turn to the estimation and test results.
V.
Results
V.1. The total effects of the policies on nutritional intake
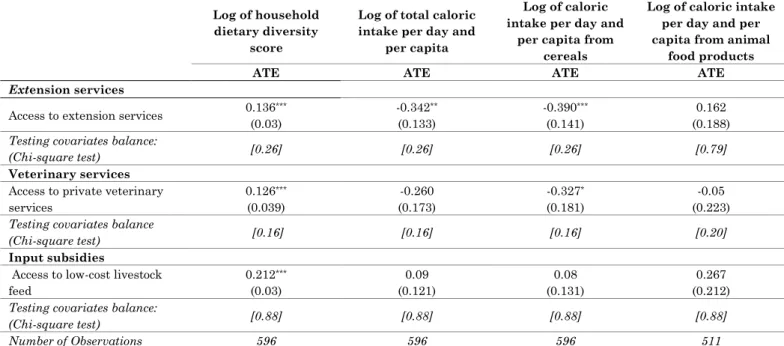
The estimates of the unmediated, or total, effect of each of the three policies on nutrition intake are reported in Table 3. The hypothesis that the distribution of covariates is the same for both treatment statuses is not rejected for each of the three policies. The covariates are therefore balanced, suggesting that the treatment or the outcome model is well specified. The conditional independence assumption is not rejected at the 5 percent level (Table 3).
For the household dietary diversity score, we note that the effects of each of the three policies are positive and significant. Those with access to extension services saw their dietary diversity score increase by 13.6 percent relative to those that did not. Moreover, having access to private veterinary services increases a household’s dietary diversity score by an almost identical extent of 12.6 percent. Finally, the
6 The authors propose a simulated test procedure for the indirect effect. Begin with two estimates
for a and b and their standard errors. Using this information, simulated random normal variables for a and b are generated to generate a distribution of a*b values. With these values, confidence intervals and p-values can be estimated by their simulated analogs.
27 total effect of deliveries of low-cost livestock feed raises the household dietary diversity score by 21 percent.
Table 3: Total effect of the selected policies on household nutritional intake
Log of household dietary diversity
score
Log of total caloric intake per day and
per capita
Log of caloric intake per day and
per capita from cereals
Log of caloric intake per day and per capita from animal
food products
ATE ATE ATE ATE
Extension services
Access to extension services 0.136***
(0.03) -0.342** (0.133) -0.390*** (0.141) 0.162 (0.188)
Testing covariates balance:
(Chi-square test) [0.26] [0.26] [0.26] [0.79]
Veterinary services
Access to private veterinary services 0.126*** (0.039) -0.260 (0.173) -0.327* (0.181) -0.05 (0.223)
Testing covariates balance
(Chi-square test) [0.16] [0.16] [0.16] [0.20]
Input subsidies
Access to low-cost livestock feed 0.212*** (0.03) 0.09 (0.121) 0.08 (0.131) 0.267 (0.212)
Testing covariates balance:
(Chi-square test) [0.88] [0.88] [0.88] [0.88]
Number of Observations 596 596 596 511
Notes: ATE: Average Treatment Effect. Values in brackets are p-values, and values in parentheses are robust standard errors. *, ** and *** indicate significance at the 10%, 5% and 1% probability levels, respectively.
With regard to caloric intake per capita per day, only extension services have a significant impact. This impact decreases caloric intake per capita per day by 34 percent for households that have access to extension services. The other two policies do not have any significant effects on total caloric intake.
Distinguishing the source of the calories consumed by the household does not substantially change the effects of each policy when considering caloric intake from cereals. This suggests that the surprising negative impacts of extension services on total caloric intake could be explained by a decline in the consumption of cereal foods.
However, the opposite policy effects are observed when examining caloric intake from animal food products, except for private veterinary services. For extension services and low-cost livestock feed programs, the results show positive policy effects, although they are not significant even at the 10 percent level. Nevertheless, a negative and very small insignificant impact is observed for private veterinary services. The positive effects, even if not significant, of extension services and low-cost livestock programs are consistent with their positive effects on the dietary diversity score. Increasing the dietary diversity score for households with diets
28 mainly composed of cereals generally amounts to increasing their consumption of animal food products. The negative impact of extension services on total caloric intake raises the question of the origin of this negative effect. Causal mediation analysis will shed further light on this.
Three hypotheses could explain this intriguing result. The first is a perverse effect of the selected policy, which may foster household specialization in pastoral activities at the expense of agricultural production. The second hypothesis is that it changed the food habits of pastoralist households who may substitute more consumption of animal food products for cereal food products. The third is measurement errors in caloric intake data. However, and as argued for example by Yi and Di (2017), when a continuous outcome is miss-measured in an additive model, naïve7 causal inference methods may still yield consistent estimates
because measurement errors are confined to the error term. This is the case if the measurement errors in caloric intake can be seen as close to classical measurement errors. Examining these hypotheses, especially the first, is one of the aims of the next sections.
29
V.2. The effects of the policies on profit and production levels
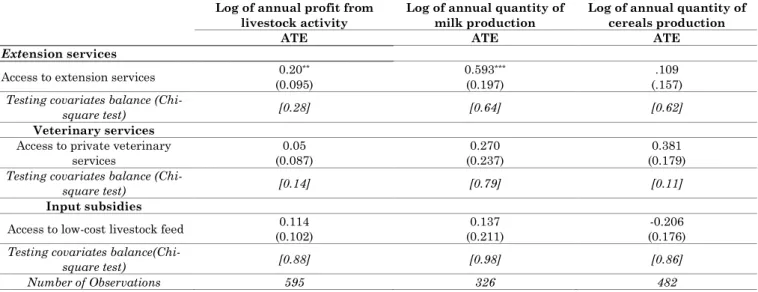
Table 4 reports the estimated effects of the selected policies on household pastoral profit and cereal and milk production levels, all in logarithms.
Table 4: Effects of the selected policies on household profit and production levels
Log of annual profit from livestock activity
Log of annual quantity of milk production
Log of annual quantity of cereals production
ATE ATE ATE
Extension services
Access to extension services 0.20**
(0.095)
0.593***
(0.197)
.109 (.157)
Testing covariates balance
(Chi-square test) [0.28] [0.64] [0.62]
Veterinary services
Access to private veterinary services 0.05 (0.087) 0.270 (0.237) 0.381 (0.179)
Testing covariates balance
(Chi-square test) [0.14] [0.79] [0.11]
Input subsidies
Access to low-cost livestock feed (0.102) 0.114 (0.211) 0.137 (0.176) -0.206
Testing covariates
balance(Chi-square test) [0.88] [0.98] [0.86]
Number of Observations 595 326 482
Notes: We consider only the three main cereal products: millet, sorghum and cowpea. ATE: Average Treatment Effect. Values in brackets are p-values, and values in parentheses are robust standard errors. *, ** and *** indicate significance at the 10%, 5% and 1% levels, respectively.
Only extension services have a significant and positive effect on the annual profits of households from livestock activity. Access to this policy increases a household’s annual pastoral profit by 20 percent. The effects of the two other policies on profits are positive but not significant. Additionally, they do not have any significant effects on milk production.
In that sense, only extension services seem to have achieved some of the objectives assigned to them by political decision-makers, especially because they are the only ones with a positive and significant impact on milk production. Moreover, private veterinary services and low-cost livestock feed programs can also be seen as having failed, with positive but insignificant effects on milk production. It will therefore be crucial to assess whether the positive effect of the extension services on household profits is transmitted to nutrition intake.
None of the three policies has a significant impact on the production levels of the three main cereals (millet, sorghum and cowpea)8, while for milk production, only
extension services have a positive and significant impact.
30 Extension services, the only policy that has a nonsignificant effect on cereal production, significantly and positively affect milk production. They also have a negative effect on caloric intake from cereal products and a positive effect on caloric intake from animal food products. Production and consumption substitution between cereal products and animal food products may have taken place after this policy, which would contribute to explaining these effects.
V.3. The effects of profits on nutrition intake
As mentioned above, these effects are estimated by running linear 2SLS regressions, where the nutrition intake measures are the dependent variables and annual profit is an independent variable, with additional control variables XY
being the same as those used when modeling the total treatment effect on the outcome variables. The main estimates of the mediation model are presented in Tables 5a through 5c for the three policies.
With respect to the mediation model for extension services (Table 5a), the hypothesis of the exogeneity of the logarithm of profit was rejected at the five percent level and below for all the considered nutrition outcomes. This led us to estimate the model using 2SLS with the two instrumental variables. To assess the weakness of the instruments, we use the test proposed by Montiel and Pflueger (2013), which is robust to heteroscedasticity. The results of the tests of overidentification and weak instruments indicate that the two instruments are valid and not weak at the five percent significance level. This is also the case for the two other mediation models (Tables 5b and 5c), which supports the use of instrumental variables regressions.
31 Table 5a: Results from the mediation model for extension services
Panel A: Second-Stage Outcomes Log of household
dietary diversity score
Log of total caloric intake per day and per
capita
Log of caloric intake per day and per capita from cereals
Log of caloric intake per day and per capita from animal
products Mediator
Log of annual profit from livestock activity 0.393*** (.113) -0.488** (.257) -0.787*** (.292) 1.299*** (.548) Policy Access to extension services (.058) 0.04 -0.145 (.172) -0.121 (.196) -0.085 (.253) Panel B: First-Stage Mediator
Log of annual profit Log of annual profit Log of annual profit Log of annual profit Policy Access to extension services 0.233 ** (.107) Instruments Livestock disease (1 if experienced) 0.280 *** (.103) Annual maximal temperature squared 0.004*** (.001) Control variables XY XY XY XY
Test of exogeneity of log
profit (Robust F): [0.00] [0.01] [0.00] [0.05]
Test of over identifying restriction (Chi square test)
[0.184] [0.377] [0.260] [0.135]
F-First stage of Excluded
instruments 13.05 13.05 13.05 6.78
Robust Weak instrument statistic:
Effective F statistic, MP test
[Critical value at level = 10 level]
10.84
[7.83] 10.85 [7.94] [7.94] 10.85 [7.62] 5.83
Number of observations 595 595 595 516
Notes: Values in brackets are critical p-values, and values in parentheses are robust standard errors. *, ** and *** indicate
significant differences at the 10%, 5% and 1% levels, respectively. The robust weak instrument statistic is the one proposed by Olea Montiel & Pflueger (2013) and computed using a Stata package made available by Pflueger and Su (2015). MP: Montiel and Pflueger.
The results of the first-stage estimation, reported in Panel B, show that households reporting having experienced disease problems in their herd have a higher observed annual profit. As stated above, one reason for this is that these households usually decide to sell their animals to eliminate this problem. It may also be that wealthier households have larger herds and therefore experience a higher probability of that at least one of their animals becoming sick.
As explained above, to assess the direct effect of each policy, we must incorporate the treatment variable in the second stage of the 2SLS regression. This entails that we incorporate the treatment variable in the first stage, according to the correct formula for the 2SLS estimator. Using the controls XY in the 2SLS estimation
32 allows us to make more plausible not only the conditional independence of the treatment and the outcome but also the conditional independence of the instruments and the outcome.
The first-stage estimates indicate that the coefficient of extension services on profits is significant in the instrumental equation for profits. This effect is similar to the one obtained in the previous section when estimating the effect of extension services on profits with IPWRA (+23 percent with the 2SLS model and +20 percent with IPWRA), which is reassuring. In the two other mediation models, the estimated effect of the policy on profits obtained from IPWRA and the one obtained from 2SLS are also similar.
The effect of a one-percent increase in annual pastoral profit on a household’s dietary diversity score is significant and almost the same for the three policy-specific mediation models, ranging from 0.37 to 0.39 percent.
On the other hand, the effect of a one-percent increase in profit on total caloric intake per capita and per day is significant and ranges from -0.52 to -0.46 percent across policies. However, the significant effect of profit differs in sign depending on the calorie source. Increasing a household’s pastoral profits by 10 percent amounts to increasing its caloric intake from animal products by 13 percent and to lowering its caloric intake from cereals by 8 percent, on average. These results are in line with policies changing the dietary habits of pastoralist households towards a more diversified diet, including more caloric intake from animal products. This change may be driven by an increase in pastoral profit.
An explanation for this result is that a higher livestock profit may correspond to greater specialization in pastoral activity. In Niger, specializing in livestock raising can be accompanied by a thorough change in a household’s lifestyle. With the problems of a lack of pasture and water due to frequent periods of drought, these households may adopt a nomadic lifestyle in search of pasture for animals. This can induce households to consume easily mobilizable calories in the form of animal products, as opposed to cereal products that may be difficult to obtain.
33 Nomadic households may also lose access to markets for specific food products, thereby restricting their food diversity.
Among the three policies, only the direct effect on the dietary diversity score of low-cost livestock feed is significant at the five percent level. The direct effects of each of the three policies on caloric intake from either cereals or animal food products are not significant at the five percent level. These results provide an indication of the importance of the indirect effect.
Table 5b: Results from the mediation model for private veterinary services
Panel A: Second-Stage Outcomes Log of household
dietary diversity score
Log of total caloric intake per day and per
capita
Log of caloric intake per day and
per capita from cereals
Log of caloric intake per day and per capita
from animal food products Mediator
Log of annual profit from
livestock activity 0.371 *** (.110) -0.459 ** (.255) -0.739 *** (.287) 1.32 *** (.553) Policy
Access to private veterinary services 0.06 (.052) -0.126 (.212) -0.157 (.168) 0.114 (.227)
Panel B: First Stage Mediator Log of annual
profit Log of annual profit Log of annual profit Log of annual profit Policy
Access to private veterinary services 0.08 (.101) Instruments Livestock disease (1 if experienced) 0.264 ** (.097) Annual maximal temperature squared 0.004 *** (.001) Control variables XY XY XY XY
Test of exogeneity of log
profit (Robust F) [0.00] [0.02] [0.00] [0.05]
Test of over identifying restriction: Chi square
test [0.22] [0.47] [0.32] [0.14]
F-statistic for First stage
of Excluded instruments 13.95 13.95 13.95 6.96
Robust Weak instrument statistic:
Effective F-statistic, MP test
[Critical value at level 10 percent]
10.52
[9.50] 10.52 [9.41] 10.52 [9.41] [8.64] 5.53
Number of observations 595 595 595 516
Notes: Values in brackets are critical p-values, and values in parentheses are robust standard errors. *, ** and *** imply
significance at the 10%, 5% and 1% levels, respectively. The robust weak instrument computed is the one proposed by Olea Montiel & Pflueger (2013) and computed using a Stata package made available by Pflueger and Su (2015). MP: Montiel and Pflueger.