HAL Id: hal-02608485
https://hal.inrae.fr/hal-02608485
Submitted on 16 May 2020
HAL is a multi-disciplinary open access
archive for the deposit and dissemination of
sci-entific research documents, whether they are
pub-lished or not. The documents may come from
teaching and research institutions in France or
abroad, or from public or private research centers.
L’archive ouverte pluridisciplinaire HAL, est
destinée au dépôt et à la diffusion de documents
scientifiques de niveau recherche, publiés ou non,
émanant des établissements d’enseignement et de
recherche français ou étrangers, des laboratoires
publics ou privés.
Measurements using Controlled Experimental
Conditions
D. Kim, A. Despax, M. Muste, Jérôme Le Coz
To cite this version:
D. Kim, A. Despax, M. Muste, Jérôme Le Coz. Estimation of Critical Uncertainty Sources in Discharge
Measurements using Controlled Experimental Conditions. RiverFlow 2018, Sep 2018, Lyon, France.
pp.8. �hal-02608485�
Estimation of Critical Uncertainty Sources in
Discharge Measurements using Controlled
Experimental Conditions
Dongsu Kim1, Aurélien Despax2,4, Marian Muste3,*, and Jérôme Le Coz4 1Dankook University, 152 Jukjeon-ro, Yongin, Geonggi-do, 16890, South Korea 2Division Technique Générale EDF, 38040 Grenoble Cedex, France
3IIHR-Hydroscience & Engineering, The University of Iowa, Iowa City, 55242, IA, USA 4IRSTEA Lyon-Villeurbanne, 69625 Villeurbanne Cedex, France
Abstract. Providing experimental results along with associated uncertainties is essential not only for ensuring confidence in the quality of the final results but also for guiding improved instrument design and the protocols for measurement acquisition. Moreover, if the uncertainty analysis is conducted in a controlled manner and over a wide range for the measured variables its results can serve as a decision-making aid in conducting new experiments. This paper provides three examples of end-to-end assessments of the impact of uncertainty sources involved in the discharge estimation in open channels using point velocities measured with Acoustic Doppler Velocimeter. The analyzed uncertainty sources are: a) the sampling duration for velocity measurement, b) the number of points in the verticals, and, c) the number of verticals across the measurement cross-section. The raw data for the uncertainty estimations were acquired at the KICT River Experiment Center (South Korea), an experimental facility designed for facilitiating quasi natural-scale experiments. The three sources of uncertainties are assembled in practical visualization means that can be used for planning the acquisition of new experiments with similar instruments.
1. Introduction
A rigorous uncertainty analysis (UA) requires first estimation of the elemental sources of uncertainty associated with each of the variables in the Data Reduction Equation (the relationship defining the measurement as a process), and subsequently to propagate those uncertainties into the final measurement result [1]. While the methods for estimation of the elemental sources of uncertainty are similar among various communities (statistical analysis, previous experience, expert opinion, or manufacturer specifications), the methods used to determine how those sources of uncertainty are determined are different [2]. For several decades, scientists, engineers and practitioners argued about the appropriate procedure to assess uncertainty [3] but currently the discourse about the need for unified procedures is making considerable progress.
This paper provides examples of end-to-end assessments of the impact of critical uncertainty sources involved in the discharge measurements acquired in open channels using point velocity measurements acquired through experiments specifically designed for uncertainty analysis. Specifically, measurements with Acoustic Doppler Velocimeter (ADV) are analysed using customized protocols to isolate the impact of three essential sources involved in the measurement of point velocity and their relative contribution to the final result, i.e., the channel discharge obtained with the velocity area method. The analysed sources of uncertainties are: a) the sampling duration for velocity measurement, b) the number of points in the verticals, and, c) the number of verticals across the measurement cross-section. The possibility to conduct controlled experiments in quasi-prototype conditions at the KICT River Experiment Center (South Korea) enabled to define continuous functions for the three sources of uncertainties that allow convenient evaluation of their collective impact on the quality (i.e., accuracy) of the measured discharge.
2. Flow conditions and reference for UA analysis
The customized experiments reported in this paper were conducted at the Korea Institute of Civil Engineering and Building Technology’s River Experiment Center (KICT-REC), located in Andong, Korea. The KICT-REC flumes offer unique opportunities for conducting open-channel experiments as they are set on natural terrain, operate with water withdrawn from a nearby river, therefore providing close to natural-scale flow conditions. The experiments were conducted in one of the KICT-REC outdoor flumes that can accurately replicate moderate and low natural flows occurring in small natural streams while providing multiple monitoring devices for controlling the flow, stage, and overall operation of the facility. Detailed information about KICT-REC facility can be found at: www.kict.re.kr/eng/060203.
The flume is equipped with movable platforms for setting instrumentation that enable detailed measurements with minimal interference with the channel flow and convenient control of the data acquisition. The capabilities to control the flow in the facility and the easy and unobstructed access to the measurement locations provide ideal conditions for conducting good quality measurements, a key ingredient for experiments targeting the systematic assessment of uncertainty sources. These conditions are more relevant for uncertainty analyses geared to practice than those provided by laboratory conditions [4] or numerical investigations [5].
The assessment of the uncertainty sources is based on a set of measurements conducted in the channel illustrated in Fig. 1a. The open-channel flow specifications are provided in the table embedded in the same figure. Point velocities were acquired with a Sontek microADV (www.sontek.com) pre-calibrated before the experiments. Point-velocity measurements were acquired with a spacing of 0.05 to 0.10 m in verticals that were separated by 0.25m, as shown in Fig. 1b. Prior to the production measurements, a set of long-duration measurements on a central vertical were acquired for 300s to test the stability of the average velocities with the sampling duration. The analysis of these preliminary measurements led to the conclusions that 90 seconds for the sampling duration ensure the stability of the time-averaged velocities at all the locations in this vertical [6]. Consequently, this sampling duration was considered adequate for all the other verticals under the assumption that the turbulence level is maximum at the deepest location in the stream cross section. The total time for the execution of the 209 point velocities (excluding the preparations) was 8.5 hours.
The high-density spatial distribution for the acquisition of the raw point-velocities acquired in the experiments are sufficient to be used as reference for the assessment of the uncertainty sources evaluated in this study. However, for obtaining a continuous and higher quality reference for the velocities throughout the cross section the raw velocities
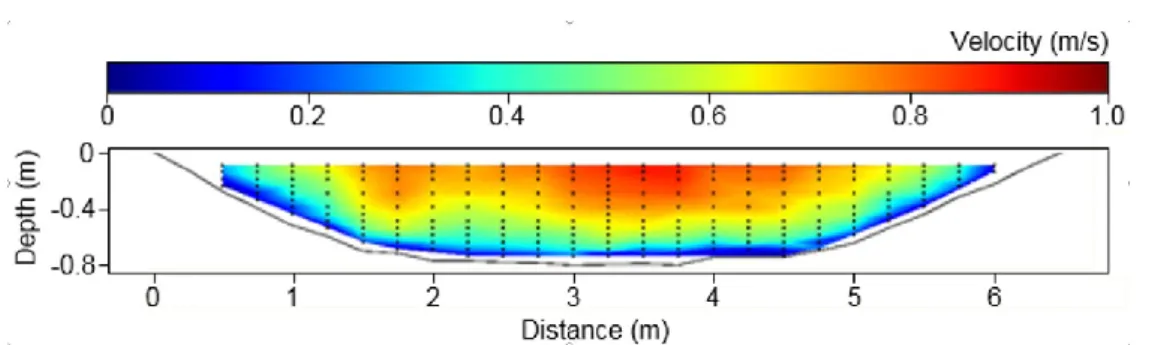
collected in the verticals were interpolated with log-law relationship over verticals [6]. The cross-sectional distribution of the time-averaged mean streamwise velocity using the 90-sec sampling duration for the ADV measurements is plotted in Fig. 2. The slight asymmetry in the distribution of the mean velocity is attributed to the natural flow variability that is inherent even in laboratory-like settings as those provided by the KICT-REC’s flumes. Note that a narrow area next to the bed has been intentionally discarded for the present analysis as in this area the ADV measurements were contaminated by bed-induced uncertainties produced by acoustic reflections occurring in this area [4]. Given that the uncertainty associated with the bed presence is not studied herein, the analysis was only conducted over the remaining area covering about 95% of the cross section.
a)
b)
Fig. 1. Experimental setup: a) KICT Andong experimental channel with insets for the test section and the downstream weir; b) layout of the ADV locations
Fig. 2. The reference mean streamwise velocity distribution across the channel section obtained from the ADV point-velocity measurements with 90s duration
3. Assessment of elemental uncertainty sources
The ideal protocol for the experimental assessment of elemental sources of uncertainty entails evaluating the impact of one source of uncertainty at a time keeping all the other sources “frozen” or minimized at maximum extent possible. The assessment is subsequently repeated to cover the potential range of variation for the uncertainty source under investigation. Evaluation of the impact of the uncertainty sources on the final measurement result requires a reference, i.e., the hypothetical true measurement for the final result. For the present context, where the final result is the stream discharge, there is practically no reference available as there is no widely-accepted method or instrument to be used as standard for the measurement of discharge in open-channel flow. The surrogate reference for evaluation of the elemental sources of uncertainty is the discahrge obtained with the velocity-area method using in-situ measured depths and distances between the verticals along with the point velocities obtained as described in Section 2.
3.1. Uncertainty due to sampling duration
Given that 90-s sampling duration and time-averaging for velocity measurements was found to be adequate for the reference velocities across the whole cross section (see Figure 3a), the standard uncertainty for each measurement location was computed by comparing reference velocities with the actual mean velocities computed from incremental time series of 10 to 30, 40, 60, and 90s. The differences between the such-obtained velocities at the 209 point locations were then averaged for the reference area to estimate one representative uncertainty associated with the sampling duration. The procedure was subsequently used for all sampling durations. In the next analysis step, the sampling duration standard uncertainties associated with various velocity acquisition times (acting as uncorrelated independent sources) were used in a uncertainty propagation software, QMSys, to obtain the impact of this elemental source on the discharge total uncertainty. QMSys is a commercially-available software developed by Qualisyst Inc. (www.qsyst.com) that implements the guidelines specified by [7] for the propagation of the elemental uncertainties to the final experimental results.
Fig. 3b displays the variation of the uncertainty in discharge for sampling durations of the point velocity measurements from 10 to 90s. The plotted results displays an uncertainty range from 1.1 to 0.6% for the sampling durations between 10 and 90s, respectively. As expected, the plot shows that the increase of the sample duration for the ADV measurements gradually improves the quality of the measurements commensurate with the duration length. It is worth pointing out that the conventional 40s for sampling velocity at a point as prescribed by conventional guidelines [8] still produces an uncertainty of 0.8% that can be further reduced by increasing the sampling duration for each velocity measurement.
a)
b)
Fig. 3. Sampling duration analysis : a) establisment of a cut-off time for the optimum sampling duration ; b) impact of the standard uncertainty associated with the sampling duration on the measured discharge.:
3.2. Uncertainty due to the number of verticals over the cross section
This uncertainty was established following the subsampling protocol developed by [9]. The proposed subsampling method gradually reduces the number of verticals using a pseudo-random procedure that attempts to simulate the behavior of stream gaugers when they acquire measurements in-situ. The number of sub-samples for each analysis considered by the method is at least 3 vertical velocity profiles. Since operational guidelines recommend that the selection of the location of verticals should be directly related to the transverse variation in bed geometry and flow distribution, a customized probability is associated with the random sampling. This probability is sensitive to the proximity of another vertical (to eliminate redundancy that operators avoid in the field based on visual observations) and the closeness to the stream bank. Near the cross section edges more information is needed to capture the flow field because the change in bed slope toward the banks and the changes in vertical velocity distribution are affected by strong velocity gradients. In the first subsampling step, the first and last verticals are consistently chosen as close as possible toward the stream edges in order to minimize the influence of velocity extrapolations required when discharges are estimated for these areas. The two first verticals are the same for all the subsampling iterations. The variation of the discharge uncertainty with different numbers of vertical is plotted in Fig. 4.
The present experiments entailed 23 verticals spaced at 0.25m over the 6m-wide channel therefore ensuring sufficient spatial density to fulfill the requirements of recommended operational standards [10]. The subsampling analysis was conducted using all the measurements acquired in the vertical during the customized KICT-REC experiments. By
isolating the effect of the other sources of uncertainty, the differences in the total uncertainty between the reference discharge (estimated as described above) and the subsampled iterations are ranging from 11.8% for 3 verticals to less than 1 % for 12 or more verticals. Comparing this source of uncertainty with the sampling duration one can be observed a dramatically different effect that this uncertainty carries in the overall uncertainty budget.
Fig. 4. The impact of the standard uncertainty associated with the number of verticals on the measured discharge
3.3. Uncertainty due to the number of points in the verticals
The analysis of the impact of this source of uncertainty is using the same subsampling algorithm presented in Section 3.2 in conjunction with a gradual decrease of the number of points in the vertical. Given the practical target of this analysis, only results with 1, 2, and 3 points in the vertical are presented herein as recommended by [10]. The reference discharge used for comparison is based on considerable higher density of points (up to 11 points in the central region of the channel with a spacing of 0.05 to 0.1m). According to [10], the application of the 1, 2 or 3-point velocity methods is valid for situations where the velocities are measured at standardized depth. For the current experiments, in some verticals the actual velocity measurement locations do not match this requirement. In such cases, velocities at 20%, 60% and 80% of the depth (from free surface) have been computed based on a linear interpolation of adjacent measurements. The depth-averaged velocity for each vertical is obtained using the trapezoidal rule and velocities are extrapolated based on a constant velocity profile at the surface and a power law (1/6 coefficient) near the bed.
The variation of the uncertainty in the discharge with the number of points in the vertical is shown in Fig. 5. The plots in this figure display the combined effect of the number of point-velocities in the verticals with that contributed by the number of verticals over the cross section acquired in the present experiment (i.e., from 3 to 20). It can be noticed that the impact of the uncertainty due to the number of velocity points acquired in the verticals does not exceed 5% for more than 6 velocity verticals. The impact of this uncertainty is decreasing dramatically when the number of verticals increases, becoming less sensitive for more than 10 verticals acquired over the cross section. It can be concluded, that this uncertainty source is also much less important than the one associated with the number of verticals over the cross section.
Fig. 5. The impact of the standard uncertainty associated with the number of points in the vertical (only 1, 2 and 3 points illustrated) on the measured discharge. The plots also capture the impact of the number of verticals in the cross section visualized in Fig 4.
4. Conclusions
The analyses conducted in the present paper substantiate ranges of uncertainties of important measurement error sources on the discharge estimated with point velocities acquired with ADVs in conjunction with the velocity-area method. The summary of the findings are :
•
The range of discharge uncertainty due to sampling duration is from 0.65 to 1.1% for sampling times of 90s to 10s, respectively (see Fig 3)•
The range of uncertainties due to the number of verticals acquired over the cross section is less than 1% for 12 (or more) verticals and up to 6.6% for only three verticals (see Fig 4)•
The discharge uncertainty does not exceed 2% for situations where only up to 3 velocity points are sampled in three verticals. This uncertainty decreases rapidly with the increase of the number of points in the verticals and the number of verticals (see Fig 5)The ranges of variation for the three analyzed sources of uncertainty are strictly valid only for measurements with the microADV acquired in turbulent open-channel flows similar to those tested in the KICT-REC experiments (i.e., streams of similar aspects ratios and lacking prominent bed features). It should be noted that the uncertainty ranges are narrower and their magnitude considerably lower than the respective values currently provided in hydrologic standards. The relevance of these evaluations cannot be discarded though as they indicate minimum ranges for these uncertainties when the measurement environment, the instrumentation used for acquiring the data, and the measurement protocols are all favorable. In other words, the data provided by this study represent a baseline for minimum uncertainties associated with these measurement error sources. Of most importance for the present context is that the relative contribution of each uncertainty source to the discharge measurement uncertainty is expected to be preserved in terms of contribution ratios for many of the actual field measurements. From this perspective, it is obvious that most of the attention for new measurements should be given to the issue of the number of verticals sampled over the cross
section compared to the duration of the sampling time or the number of points acquired in verticals.
Providing sound estimation of uncertainties such as is illustrated in this analysis is essential not only for ensuring confidence in the quality of the final results but also for guiding the means to further improve the instruments and protocols involved in specific measurements. The possibility to conduct controlled experiments in quasi-prototype conditions at the KICT River Experiment Center (South Korea) enabled to assemble continuous functions for the impact of the three elemental sources of uncertainty on the quality of the measured discharge. While obtained in tightly controlled conditions, the assembled information has a generic nature as the inferences regarding the individual impact of the investigated uncertainties are not considerably changed in actual discharge monitoring situations. The availability of such tools leads to more robust and publicly accepted decisions and reduce the cost of acquiring the measurements.
ACKNOWLEDGEMENTS
The first two authors are grateful for the support provided by grant 11-TI-C06, Advanced Water Management Research Program, Ministry of Land, Infrastructure & Transport, Korea. References
1. WMO, World Meteorological Organization Report WMO-No. 1097, Editor: M. Muste, Geneva, Switzerland (2017)
2. M. Muste, K. Lee, J.-L., Bertrand-Krajewski,Hydrological Sciences Journal, 57, 4, 1– 25 (2012)
3. A.B. Abernethy, B. Ringhiser, IAA/SAE/ASME/ASEE Propulsion Conference (1985) 4. D.E. Dombroski, J.P. Crimaldi, Limnol. Oceanogr.: Methods 5, 23-33. (2007) 5. C. M. García, M. I. Cantero, Y. Niño, M. H. García, In G. Sehlke, D. F. Hayes, & D.
K. Stevens (Eds.), Proceedings of the 2004 World Water and Environmental Resources
Congress: Critical Transitions in Water and Environmental Resources Management,
2404-2413, (2004)
6. M. Muste, D. Kim, H-W. Tsai, Hydraulic Measurements & Experimental Methods
Conference, July 9-12, 2017, Durham, NH. (2017)
7. JCGM, Joint Committee for Guides in Metrology, Bureau International des Poids et Measures, Sevres, France. (2008)
8. Water Survey of Canada, Environmental Canada, Revision 4, qSOP-NA022-04-2015 (2015)
9. A. Despax, C. Perret, R. Garçon, A. Hauet, A. Belleville, J. Le Coz, A.C. Favre, Journal of Hydrology, 533, 128-140 (2016).
10. ISO 748, International Organization for Standardization, Geneva, Switzerland, 47 p. (2009)