HAL Id: hal-01930921
https://hal.archives-ouvertes.fr/hal-01930921
Submitted on 8 Mar 2019
HAL is a multi-disciplinary open access
archive for the deposit and dissemination of sci-entific research documents, whether they are pub-lished or not. The documents may come from teaching and research institutions in France or abroad, or from public or private research centers.
L’archive ouverte pluridisciplinaire HAL, est destinée au dépôt et à la diffusion de documents scientifiques de niveau recherche, publiés ou non, émanant des établissements d’enseignement et de recherche français ou étrangers, des laboratoires publics ou privés.
Functional structure and composition of Collembola and
soil macrofauna communities depend on abiotic
parameters in derelict soils
Quentin Vincent, Corinne Leyval, Thierry Beguiristain, Apolline Auclerc
To cite this version:
Quentin Vincent, Corinne Leyval, Thierry Beguiristain, Apolline Auclerc. Functional structure and composition of Collembola and soil macrofauna communities depend on abiotic parameters in derelict soils. Applied Soil Ecology, Elsevier, 2018, 130, pp.259-270. �10.1016/j.apsoil.2018.07.002�. �hal-01930921�
Functional structure and composition of Collembola and soil
1
macrofauna communities depend on abiotic parameters in
2
derelict soils
3
4
Quentin VINCENT
1,2, Corinne LEYVAL
1, Thierry BEGUIRISTAIN
1and Apolline
5
AUCLERC
2.
6
1
. Université de Lorraine, CNRS, LIEC, F-54000 Nancy, France 7
2
. Université de Lorraine, INRA, LSE, F-54000 Nancy, France. 8
9
ABSTRACT
10
In the last decades, anthropogenic disturbances have altered the ability of soils to provide diverse 11
functions. Certain anthropogenic soils, with a low fertility level and often contaminated, ended up 12
underused and derelict. Although derelict for humans, these soils may be refuges for biodiversity, but 13
their biological functioning remains poorly understood. To this end, a trait-based approach of soil 14
invertebrate communities might be an effective predictor of ecosystem state. The present work aims to 15
highlight the in situ links between the abiotic characteristics of derelict soils and the taxonomic and 16
functional structure and composition (through a trait-based approach) of macrofauna and Collembola 17
communities inhabiting these soils. We studied 6 different derelict soils: two soils from coking plants, 18
one soil from a settling pond, two constructed soils, and an inert waste storage soil. We measured 19
fifteen abiotic soil parameters that inform on fertility and contamination. We took into account sixteen 20
traits and ecological preferences to characterize the functional structure and composition of 21
Collembola and macrofauna communities. Soil fertility (organic matter content, C:N ratio, P, Ca and 22
Mg concentrations, cation-exchange capacity, and clay content) and moderate contamination (Pb, Cd, 23
Zn, and PAH concentrations) altered the taxonomic and functional composition of Collembola and 24
macrofauna communities by selecting traits such as body length, pigmentation, vertical distribution, 25
diet type, and habitat preference. Compost-amended constructed soil properties selected taxonomic 26
and functional community composition of slightly disturbed soil. In contrast, metal-contaminated 27
constructed soil harbored a higher proportion of Collembola displaying the traits and ecological 28
preferences of instable ecosystems. The study of functional profiles of Collembola and macrofauna 29
communities in the derelict soils evidenced that they support different communities with more or less 30
wide functional potential. It underlines the interest of multiple biotic component studies to reach a 31
better ecosystem description. 32
33
HIGHLIGHTS
34
Collembola and macrofauna communities from derelict soils were characterized. 35
Links between fauna community composition and soil characteristics were studied. 36
Fertility and contamination altered invertebrate community structure and composition. 37
Compost-amended constructed soil selected typical slightly disturbed soil species. 38
Collembola species traits in contaminated and constructed soil were typical of instable ecosystems. 39
40
KEYWORDS
41
Derelict soils, Functional diversity, Traits and ecological preferences, Soil invertebrates, Technosol 42
43
1. INTRODUCTION
Soils are complex ecosystems, described as multifunctional systems because many components 45
interact inside them (Kibblewhite et al., 2008; Briones, 2014). Nevertheless, over the last decades 46
growing evidence has emerged about the negative impact of anthropogenic disturbances on the ability 47
of soils to provide functions (Levin et al., 2017) and occasionally to host biodiversity (Orgiazzi et al., 48
2016). In this context, the closing down of steel, shipbuilding or metal manufacturing industries 49
because of economic issues and the closing down of mining sites in different European countries have 50
resulted in land abandonment and altered ecosystem functioning (Wong and Bradshaw, 2002). 51
Sometimes called greenfields, wastelands, uncultivated/vacant/abandoned lands, the soils of these 52
derelict lands can be disturbed, i.e. characterized by a low fertility level (Dickinson, 2003) and/or 53
sometimes by contamination (Morel et al., 2005). These specific abiotic parameters can alter soil 54
functions likely to be important for agriculture and lead to surfaces being unmanaged and underused 55
(Cundy et al., 2016). In Vincent et al. (2018), we showed that derelict soils could have low organic 56
matter and nitrogen contents, a low cation exchange capacity, alkaline conditions with cations 57
occasionally lacking or in excess, and moderate organic and inorganic contamination linked to their 58
history. Biotic parameters (i.e. plant, fauna and microorganism density and richness) co-varied more 59
with soil fertility proxies than with soil contamination parameters in moderately contaminated derelict 60
soils. Once soils are underused and abandoned by humans, they may turn into refuges for biodiversity 61
provided that abiotic parameters are not extreme for life (Baranova et al., 2014). Derelict soils have 62
been reported to harbor a rich invertebrate biodiversity: insects (Bonthoux et al., 2014), beetles (Eyre 63
et al., 2003), carabids (Small et al., 2006), earthworms and Collembola (Butt and Briones, 2017). 64
However, the biological functioning of derelict soils remains poorly understood as compared to forest 65
or agricultural lands. 66
In this vein, trait-based approaches focusing on the characteristics of individuals provide an interesting 67
tool to assess soil functioning (Verberk et al., 2013). Pey et al. (2014) defined traits in soil invertebrate 68
studies as “morphological, physiological, phenological or behavioral features measurable at the 69
individual level, from the cell to the whole-organism level, without reference to the environment or 70
any other level of organization”. Traits could be considered as functional because they impact 71
organism fitness directly and indirectly (Violle et al., 2007). Finally, functional traits can help to 72
understand the effect of environmental stressors on soil communities (Auclerc et al., 2009; 73
Vandewalle et al., 2010; Hedde et al., 2012; Salmon and Ponge, 2012). In recent years, traits have 74
been recognized as effective predictors of exposure to disturbances (metal contamination in Hedde et 75
al., 2012; restoration practices in Rosenfield and Müller, 2017), or of management strategies such as 76
intensive agriculture, polyculture and monoculture (Wood et al., 2015; Sechi et al., 2017) to better 77
understand the soil functional community structure and composition. 78
The functional community composition of the soil fauna is linked to soil abiotic parameters. For 79
example, in urban soils, the proportion of Collembola with a sexual reproduction type was positively 80
correlated with total Cu and Ni concentrations, and the proportion of pigmented Collembola was 81
positively correlated with total Cr, Pb and Zn concentrations (Santorufo et al., 2015). The proportion 82
of Collembola living belowground (with the following trait attributes: small size, reduced or absent 83
sensorial organs and furca, non-sexual reproduction type) in coal mine spoil tip soils was found 84
associated to a coarser soil texture and higher nitrogen and organic matter concentrations (Vanhee et 85
al., 2017). In parallel, the proportion of macroinvertebrates with a soft body decreased when metal 86
contamination increased (Hedde et al. (2012), and the body size of ants was found driven by soil 87
granulometry (Costa-Milanez et al. (2017). Moreover, other authors showed that soil age played a key 88
role in the functional community composition by selecting certain traits such as moisture or light 89
requirement in carabid communities (Aubin et al., 2013) or the feeding group for macrofauna 90
communities (Frouz et al., 2013). To our knowledge, existing studies dealing with trait-based 91
approaches in anthropogenic sites focussed on only one group of soil invertebrates (Collembola or 92
carabids or macrofauna) and were carried out on highly contaminated and/or low fertile soils. 93
Furthermore, there are too few studies considering the links between soil chemistry parameters and 94
trait-based invertebrate community composition (e.g. Salmon and Ponge, 2012; Santorufo et al., 2014, 95
Santorufo et al., 2015; Martins da Silva et al., 2016). 96
The present work aims to characterize which environmental factors shape macrofauna and Collembola 97
invertebrate communities and their functional structure and composition in derelict soils characterized 98
by moderate contamination and/or low fertility. We hypothesized that the soil characteristics related to 99
past industrial activities and/or to the materials used for construction drove the composition of 100
invertebrate communities by selecting certain traits and ecological preferences. We studied 6 different 101
derelict soils: two soils from coking plants, one soil from a settling pond, two constructed soils, and an 102
inert waste storage soil (Vincent et al., 2018). We took into account sixteen traits and ecological 103
preferences to characterize the functional structure and composition of the soil invertebrate 104
communities. 105
106
2. MATERIALS AND METHODS
107
2.1. Derelict soils and fauna sampling methods
108
We studied six soils from open industrial derelict sites located in north-eastern France in a historically 109
industrial region, with many former coking plant sites and steel factories. The climate in this region is 110
continental with annual mean temperature of 10.8°C. For the sampling year (2015), monthly mean 111
temperatures ranged between 1.8 and 22.1°C and cumulated annual rainfall was around 500 mm. Soil 112
and fauna were sampled between the 8th and 29th of April 2015 (Vincent et al., 2018), during the 113
period of highest invertebrate activity. 114
Soil named “CS” (for constructed soil) was a 1.13 ha experimental constructed soil set up on the site 115
of a former coking plant (Séré et al., 2008). Soil named “WL” (for waste landfill) was from a 0.7 ha 116
non-hazardous waste landfill. Soils named “CP1” and “CP2” (for coking plant site 1 and 2, 117
respectively) were from former coking plant sites. These two soils differed in metal trace element 118
concentrations. Soil named “SP” (for settling pond) was from a settling pond site filled with steel 119
sludge. Lastly, soil named “CCS” (for constructed and contaminated soil), was an experimental 0.09-120
ha constructed soil. See Table 1 for more details. 121
We measured eleven abiotic variables that describe soil fertility: organic matter (OM) content, water 122
holding capacity (WHC), clay content, exchangeable Ca, K, Mg and Na cation concentrations, Olsen 123
phosphorus content, pH, cation-exchange capacity (CEC), C:N ratio. We also measured four chemical 124
variables to quantify the contaminant levels in the soils, i.e. PAH and available Cd, Zn and Pb 125
concentrations. We also took into account the time span since the last anthropogenic action on each 126
site. The abiotic characteristics are summarized in Table 1 (for more details see Vincent et al. 2018)). 127
We took five soil samples from each derelict site (except for CCS where four samples were taken), 128
along a 20-m transect with 5 m distance between each sample, in accordance with the Tropical Soil 129
Biology and Fertility (TSBF) method (Anderson and Ingram 1993). We characterized communities in 130
open areas (i.e. not forested areas) and adjusted our transect strategy to avoid potential edge effects for 131
one given site. Collembola communities were sampled using soil cores and MacFadyen method, and 132
macrofauna communities were sampled by soil blocks and hand-sorting method. Collembola were 133
sampled on the 6 plots, on 10 cm depth, using two 5-cm deep corers (according to the ISO 23611-2 134
standard), fitted one above the other. The microarthropods were extracted using a high-temperature 135
gradient extractor (MacFadyen, 1961) and identified to the species level. The soil macrofauna 136
communities were studied on 5 sites by excavating 0.25×0.25×0.30 m soil blocks, according to the 137
ISO 23611-5 standard. Macrofauna community from CCS was not studied because the destructive 138
method would have caused high disturbances on the experimental plots. Macrofauna organisms were 139
hand-sorted in laboratory, and kept in a 70% (v/v) ethanol solution. They were all identified down to 140
the family level, and further down to the species level for rove beetles, ground beetles and 141
earthworms. Ants were removed from all analyses because these social insects are highly aggregated 142
in space (Nahmani and Rossi 2003). 143
2.2. Functional study (trait-based approach) of Collembola and macrofauna
144
communities
145
We selected 7 traits for the trait-based approach of the Collembola study: body length (BLN), body 146
shape (BSH), number of ocelli (OCE), presence of a post antennal organ (PAO), pigmentation (PIG), 147
motion strategy (MS), reproduction type (REP), and 3 ecological preferences: vertical distribution 148
(DIST), micro-habitat preference (MHABI), and habitat preference (HABI). As for the macrofauna, 149
we selected 3 traits: body length (BLN), presence of an integument (INT), and mouth part type 150
(MthT), and 3 ecological preferences: diet type (DIET), micro-habitat preference (MHABI), and 151
habitat preference (HABI). These traits were chosen because they are commonly used to characterize 152
the dispersal abilities of organisms in a given ecosystem, or to describe habitats and environmental 153
stressors (Makkonen et al., 2011). 154
We gathered values (e.g. attributes) of the traits and ecological preferences of species from various 155
sources (aggregated data, books, literature, etc.) but mainly from the BETSI (Biological and 156
Ecological Traits of Soil Invertebrates - http://betsi.cesab.org) database. We used 8,200 Collembola 157
data and 1,400 macrofauna data. The different traits/ecological preferences and attributes we assessed 158
are listed in Table 2. 159
To analyze attribute data for a given taxon, we performed a fuzzy coding analysis. This method was 160
developed by Chevene et al. (1994) and is widely used for trait approaches. Calculations were 161
performed according to the method of Hedde et al. (2012). The information obtained from each source 162
was coded by an affinity score for a given taxon and for a given trait attribute ranging from 0 to 4 163
(from no (0) to very high affinity (4) of the taxon to a trait attribute, respectively). Subsequently, the 164
affinity scores obtained from all the sources were added up and transformed into a percentage to build 165
the trait profile of each species/taxon. Finally, for each trait attribute, the mean affinity for the entire 166
Collembola or macrofauna community, called Community Weighted Mean (CWM), was calculated 167
according to Garnier et al. (2004). The CWM calculation was performed using equation 1, 168
(Eq. 1) 𝐶𝑊𝑀 = ∑𝑛 𝑃𝑖× 𝑇𝑖
𝑖=1 ,
169
where Pi is the relative abundance of species/taxon i, n is the number of Collembola or macrofauna 170
taxa, and Ti is the relative trait/ecological preference attribute affinity of species/taxon i.
171
CWMs were calculated separately for Collembola and macrofauna communities, for each trait 172
R Development Core Team, 2015). 174
2.3. Taxonomic and functional diversity indices of Collembola and
175
macrofauna communities
176
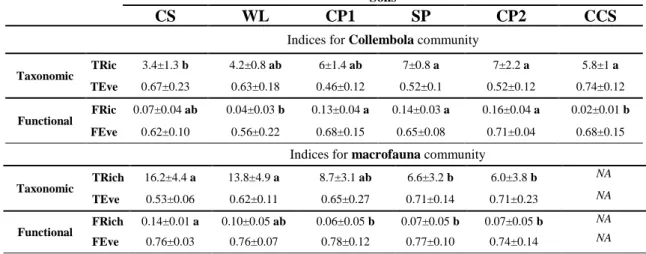
We measured different ecological indices that describe taxonomic or functional community structure 177
because they are commonly used to assess ecosystem stability and functioning (Tilman, 2001; Tilman 178
et al., 2014; Bukvareva, 2017). For a taxonomic description of the communities sampled in each 179
derelict soil, we estimated taxonomic richness (TRic) and taxonomic evenness (TEve) using the vegan 180
package (Oksanen et al., 2017) in R software. TRic was the number of taxa composing the Collembola 181
or macrofauna communities sampled in each derelict soil, and TEve was the partitioning of individuals 182
among the different taxa across each community. 183
For a functional description of Collembola and macrofauna community structure, we calculated 184
functional richness (FRic) and functional evenness (FEve) according to (Villéger et al., 2008), using 185
trait values (Laliberté et al., 2014). FRic was the volume created by attribute values in a 186
multidimensional trait space. FEve was the evenness with which attributes were distributed in the 187
multidimensional functional space. These functional indices were calculated using R software and the 188
FD package (Laliberté et al., 2014). 189
2.4. Statistical and multivariate analyses
190
To test the differences in functional community composition among soils, we independently 191
performed univariate tests on CWMs for each attribute of a given trait. We also performed univariate 192
tests on TRic, TEve, FRic and FEve to compare taxonomic and functional diversity levels among 193
soils. As no dataset followed the conditions of parametric tests (we checked normality with Shapiro 194
Wilk's test and homogeneity of variances with Bartlett’s test), we performed Kruskal-Wallis (K-W) 195
tests followed by the Dunn’s test of multiple comparisons with Bonferroni adjustment to control the 196
experimentwise error rates (Dinno, 2017). We used R Software for data processing, and performed all 197
univariate tests with a 95% significance level. 198
To highlight the relationships between the trait/ecological preferences and abiotic parameters of the 199
derelict soils, we performed RLQ analyses (Dolédec et al., 1996). RLQ analysis is a generalization of 200
co-inertia analysis (Dray et al., 2003) that couples multiple data sets and identifies co-relationships 201
between them. RLQ analysis performs a double inertia analysis of two arrays (tables R and Q) with a 202
link expressed by a contingency table (table L). RLQ analysis is a method to highlight how the 203
environment filters certain species traits (Dray et al., 2014). We used it to provide simultaneous 204
ordination, and to analyze the joint structure of three datasets: the abiotic parameter dataset of each 205
sample (table R), the relative abundance of taxa in each sample (table L), and the attribute trait values 206
for each taxon (table Q). We tested the significance of the relationship between taxon traits and abiotic 207
parameters using a Monte Carlo test (999 permutations). We performed RLQ analysis for Collembola 208
and macrofauna communities separately, using the ade4 package (Dray and Dufour, 2007) in R 209
software. This approach is one of the most integrated methods to analyze trait-environment 210
relationships (Dray and Dufour, 2007; Kleyer et al., 2012). We tested linear regressions with the 211
lmtest package in R, and correlations between abiotic and biotic parameters with the Pearson 212
correlation coefficient (Hothorn et al., 2015). 213
3. RESULTS
214
3.1. Collembola communities from all 6 derelict soils
215
The density of Collembola ranged between 17,000 and 91,000 individuals per m² on average, and their 216
taxonomic richness between 3.4 and 7 per sample (Table 3). As regards the taxonomic approach, 217
Collembola species richness was the highest in SP, CP2 and CCS, and significantly different from CS 218
(K-W test; P=0.005). The evenness of Collembola species did not significantly differ among soils, 219
with mean values ranging from 0.46 to 0.74. As for the trait-based approach, Collembola functional 220
richness (between 0.02 and 0.16) was the highest in CP1, SP and CP2, and significantly different from 221
WL and CCS (K-W test; P<0.001). No difference in the functional evenness of Collembola 222
communities was found among soils, with mean values ranging between 0.62 and 0.71. 223
Figure 1 shows the CWM of each attribute measured for each of the ten traits/ecological preferences 224
of the Collembola communities sampled in each of the six derelict soils. For habitat preference, the 225
Collembola collected through the study are forest and grassland taxa (81% of the community on 226
average for the 6 soils) and preferred soil as a micro-habitat (64% of the community on average for the 227
6 soils). 228
CS harbored a higher proportion of Collembola that have a furca and inhabiting decaying woods (ca. 229
24%) than in CP1, SP and CP2. CCS was characterized by a higher proportion of Collembola with the 230
biggest size (2-3 mm; ca. 49%) compared to WL, SP and CP2. The percentage of Collembola with a 231
PAO was higher in CCS (ca. 88%) than in WL. Collembola in soil CCS have a higher number of 232
ocelli (5, 6, 7 or 8 pairs; ca. 100%), they are more pigmented (ca. 88%) compared to soils CP1 and SP, 233
and have a sexual reproduction type (ca. 88%), with an epiedaphic ecological preference (ca. 93%, a 234
significant higher value compared to CS, CP1 and SP). CCS harbored the lowest proportion of 235
Collembola inhabiting forests and grasslands (62% of the community) but the highest proportion of 236
Collembola inhabiting agricultural (22% of the CCS community) and wetland habitats (14% of the 237
community). 238
According to Figure 2A, the first two RLQ analysis axes accounted for 88% of total Collembola 239
community variance (69 and 19%, respectively). The Monte-Carlo permutation test evidenced a global 240
link between physico-chemical soil variables and the traits/ecological preferences of Collembola (P 241
value: 0.052). The projection of the centroid calculated for each soil separated them into 4 groups: 242
CCS; WL-CP1-CP2; CS; SP. Species composition is given in Figure 2B. Isotomurus fucicolus, 243
Isotomurus antennalis, Desoria violacea, Proisotoma minuta and Entomobrya lanuginosa were in the 244
highest density in CCS as compared to the other soils. I.fucicolus, I.antennalis and P.minuta were only 245
sampled in this soil. Likewise, CP2 hosted Smithurinus schoetti, Sphaeridia pumilis and Sminthurinus 246
elegans in a higher abundance than the other soils. S.schoetti was only sampled in CP2. Metaphorura 247
affinis, Cyphoderus albinus and Paratullbergia callipygos had the highest density in SP. The other 248
soils (CS, WL, CP1, and CCS) did not host exclusive Collembola species (i.e. sampled in only one of 249
the six soils). 250
Figure 2C shows that the highest proportion of Collembola inhabiting mineral micro-habitats was 251
associated with the highest C:N ratio, pH and Ca concentration and a small quantity of clay, which 252
were the abiotic characteristics of SP. The higher proportions of forest- and grassland-inhabiting 253
Collembola were associated with high OM contents and low trace elements (Cd, Zn, Pb) 254
concentrations in soils. These trait-abiotic parameter relationships were characteristic of CS, and to a 255
lesser extent of WL, CP1 and CP2. CCS had the highest Cd, Zn and Pb concentrations and the lowest 256
OM content. It hosted the highest proportion of Collembola with a high number of pairs of ocelli (i.e. 257
5, 6, 7 or 8), and the highest proportion of Collembola inhabiting wetland habitats. The highest 258
proportion of Collembola inhabiting in root and soil micro-habitats was associated with the highest 259
soil CEC values in CS and to a lesser extent in WL, CP1 and CP2. Finally, the highest proportion of 260
Collembola with a low number of ocelli (i.e. 1, 2, 3 or 4) was associated with the highest soil CEC and 261
PAH concentrations, such as measured in CS. The other traits/ecological preferences were not clearly 262
linked to measured physico-chemical parameters. Moreover, the time span since the last anthropogenic 263
action on each site (i.e. “age”) did not seem to influence trait selection across the sites. 264
3.2. Macrofauna communities in 5 derelict soils
265
The average macrofauna density ranged between 118 and 668 individuals per m², and the average 266
taxonomic richness of the macrofauna community ranged between 3.0 and 11.6 per sample (Table 3). 267
Taxon richness (between 6.0 and 16.2) was significantly higher in CS and WL than in SP and CP2 (K-268
W test; P=0.001). No significant difference in the evenness of macrofauna taxa was measured among 269
soils, with mean values ranging from 0.53 to 0.71. Functional richness (between 0.06 and 0.14) was 270
significantly higher in CS than in SP, CP1 and CP2 (K-W test; P=0.041). As for Collembola 271
community results, no difference in functional evenness was measured among soils, with mean values 272
ranging from 0.74 to 0.78. 273
Figure 3 shows the CWM of the six traits/ecological preferences of the macrofauna communities 274
sampled in the five soils. For habitat preference, the macro invertebrates of the 5 soils are forest and 275
grassland habitat taxa (around 50% of the community in the 5 soils, without significant difference 276
among sites). 277
CS was characterized by a significantly higher proportion of invertebrates without a specific 278
mouthpart (mainly earthworms; ca. 40%) compared to other soils; CS harboured also a higher 279
proportion of geophageous trophic group (ca. 24%) compared to WL, SP and CP2 and a higher 280
proportion of invertebrates inhabiting a mineral micro-habitat (ca. 58%). SP was characterized by a 281
higher proportion of small invertebrates (2.5-5 and 5-10 mm; ca. 40%) than in the other soils, and a 282
higher proportion of invertebrates with a chewing mouthpart type (ca. 92%). SP was also 283
characterized by higher proportion of zoophagous trophic groups (ca. 58%) and of wetland habitat 284
taxa (ca. 37%). 285
The first two RLQ analysis axes accounted for 87% of total macrofauna community variance (71 and 286
16%, respectively) (Figure 4A). The Monte-Carlo permutation test indicated a highly significant 287
(P=0.01) link between physico-chemical variables and traits/ecological preferences of soil macro-288
invertebrates. The projection of the centroid calculated for each soil delineated 3 groups: CS; WL-289
CP2; CP1-SP. Taxon composition is presented in Figure 4B. Athous click-beetle, Dermaptera, 290
Allolobophora chlorotica, Allolobophora oculata and Aporrectodea longa earthworms had a higher 291
density in CS than in the other soils. The Miridae group were in a higher density in WL and CP2 than 292
in the other soils. Limacidae, the spider family Linyphiidae, the centipede family Geophilidae and the 293
millipede order Julida (with especially the species Ommatoiulus sabulosus) had a higher density in 294
CP2 than in the other soils. Finally, Steninae and Staphylinidae were in a higher density in SP than in 295
the other soils. 296
Figure 4C shows that the highest proportions of macrofauna without a mouthpart, geophagous 297
invertebrates and animals with a preference for agricultural habitats were associated with higher soil 298
CEC and WHC, which were characteristic of CS. A weak but significant positive correlation was 299
observed between earthworm density and soil CEC values (R²=0.40; T-test; P<0.001) and between 300
earthworm density and OM content (R²=0.26; T-test; P=0.01). The highest proportion of invertebrates 301
inhabiting mineral micro-habitats was associated with the highest soil PAH, phosphorous, and 302
available Cd concentrations and the highest OM content. The highest proportion of invertebrates with 303
a wetland habitat preference was associated with the highest soil Mg, Ca and Pb concentrations, the 304
highest C:N ratio and the lowest soil K concentration, characteristic of CP1 and SP. The highest 305
proportion of individuals with a sclerotized integument was associated with the highest available soil 306
Zn concentrations and lowest clay contents. The time span since the last anthropogenic action on each 307
site (i.e. “age”) did not seem to have any impact on functional community composition. 308
309
4. DISCUSSION
310
311
The use of functional traits of edaphic fauna highlighted differences in Collembola and 312
macrofauna communities structures among the studied derelict soils. CS (a constructed compost 313
amended soil) and WL (a non-hazardous waste landfill soil) had the highest taxonomic and functional 314
macrofauna richness, but the lowest taxonomic and functional Collembola richness of the studied 315
sites. These soils probably contained a high quantity of food resources and many potential different 316
niches possibly linked to a high plant density, with no metal contamination. Focusing on earthworms, 317
CS hosted the highest density of the studied sites. The presence of earthworms is currently considered 318
as a good indicator of the absence of disturbance such as metal contamination and land-use 319
intensification (Nahmani and Lavelle, 2002; Pérès et al., 2011; Cluzeau et al., 2012). We can suggest 320
that competition for resources between meso- and macro-organisms can occur at one given time. For 321
example, Eisenhauer (2010) showed negative impacts of endogeic earthworms due to competition for 322
food resources with microarthropods such as Collembola. Earthworms can also affect the Collembola 323
community by modifying, maintaining, creating or destroying habitats (Eisenhauer, 2010; Wright et 324
al., 2012). At the opposite, CCS (an experimental constructed and contaminated soil) with the lowest 325
fertility level and the highest metal concentration of the study, harbored the highest taxonomic 326
diversity but a low functional diversity of Collembola. This might suggest functional redundancy of 327
species within the community, defined as several species contributing in equivalent ways to an 328
ecosystem function such that one species may substitute for another (Bruno et al., 2016). Species that 329
are functionally redundant act as ‘spare wheels’ during a disturbance to maintain ecosystem functions 330
(Cole et al., 2006). Functional redundancy of species in a given community might be interesting in 331
disturbed habitats, and then a community composed of species with similar functional traits might be 332
more resilient to a new disturbance (Gerisch, 2014; Hodecek et al., 2016). 333
Following the RLQ analyses, the differences in fertility levels and contaminant concentrations 334
among the 6 anthropogenic derelict soils appeared to be associated with different composition of 335
Collembola and macrofauna communities at the taxonomic and functional levels, with difference of 336
response for both communities. 337
Firstly, the OM content was associated with the presence of Collembola Lepidocyrtus lanuginosus and 338
Isotomiella minor, found at high densities in soils with high OM contents (Santorufo et al., 2014) and 339
in coal mine spoil tip soils (Vanhee et al., 2017). These species are considered as forest-inhabiting 340
species (Heiniger et al., 2015). They have been showed to prefer soils with dense vegetation (high 341
plant biomass) and rich in OM (Gillet and Ponge, 2004; Fjellberg, 2007; Dunger and Schlitt, 2011). 342
The OM content, which was the highest in CS owing to compost addition, appeared to positively 343
influence the density of forest- and grassland-inhabiting Collembola in our study, but had no effect on 344
the macrofauna. Collembola communities could be more driven by fine OM (only OM smaller that 345
2 mm was assessed in this study) than macrofauna because of the size of the food they eat. Secondly, 346
the highest soil C:N ratio was linked to the highest proportion of wetland-inhabiting macrofauna 347
sampled in SP and CP1 (settling pond and coking plant soils, respectively). Wetlands harbor plant 348
communities with a high C:N ratio that are decomposed slowly (Plum, 2005) and can in turn result in 349
a high soil C:N ratio. Thirdly, the soil CEC value was linked to the proportion of invertebrates without 350
a mouthpart, mainly represented by earthworms, in WL. The selection of earthworm populations 351
(geophageous invertebrates without a mouthpart) by high soil CEC has already been observed in soils 352
of oil palm plantations and agricultural areas (Sabrina et al., 2009; Hedde et al., 2012). The authors 353
underlined that the effects of CEC on earthworm populations was similar to the effects of organic 354
carbon. In our study, a weak correlation was observed between earthworm density and OM content or 355
CEC values. The soil CEC value also seemed to be an important factor on Collembola species 356
characterized by trait attributes linked to a high dependence on soil as a habitat (i.e. “soil-inhabiting”, 357
“inhabiting root micro-habitats” and “low number of ocelli”). Finally, Ca and Mg concentrations in the 358
soils also appeared to alter the proportion of chewing mouth-part type macrofauna that we assumed to 359
use herbaceous litter as food. An explanation of this abiotic-biotic link could be that the Ca 360
concentrations in plants and consequently in litter originate from the soil. Thus, in the studied soils, 361
litter calcium might have come from the materials used for constructing soils, and may have 362
influenced the functional composition of soil invertebrates by selecting certain species with a specific 363
mouth-part type. 364
Metal concentrations seemed also to influence the density of certain species and to alter the functional 365
community composition of the soil biodiversity, especially for Collembola. In this vein, Proisotoma 366
minuta was only found in the soil with the highest metal concentration (CCS). P.minuta has already 367
been shown as an indicator of manure or slurry pollution and predominates in decaying sewage sludge 368
(Dunger and Schlitt, 2011). It seems to be a generalist species adapted to different ecosystems likely to 369
be altered. Euedaphic Collembola are considered as the most sensitive living forms to metal 370
contamination according to several studies (Fountain and Hopkin, 2004; Parisi et al., 2005; Joimel, 371
2015). Epedaphic Collembola, are more resistant to pollutants than euedaphic Collembola because 372
they have a higher movement ability and a lower direct contact with soil particles (Fountain and 373
Hopkin, 2004). This result is consistent with our findings: the derelict soil with the highest metal 374
concentrations (CCS) did not host euedaphic Collembola. In the present study, the metal concentration 375
also appeared to positively drive the proportion of Collembola with a maximum number of ocelli, as 376
observed previously for soil Pb concentrations (Joimel, 2015). The number of ocelli is an indicator of 377
the dispersal ability of Collembola since species with a complete visual apparatus can disperse rapidly 378
(Ponge et al., 2006; Salmon et al., 2014). Several authors underlined that Collembola with a high 379
dispersal ability were present in disturbed environments (Auclerc et al., 2009; Salmon et al., 2014; 380
Joimel, 2015). Thus, the metal concentrations of our soils, though low as compared to other studies on 381
anthropogenic soils, appeared to have selected Collembola with a high dispersal ability linked to 382
specific morphological traits. In the same vein, the highest proportion of Collembola with sexual 383
reproduction was observed in CCS, which contained the highest metal concentrations. A higher 384
proportion of sexual reproduction species as compared to parthenogenetic Collembola species has 385
been reported in copper-polluted environments (Niklasson et al., 2000). The reproduction type of 386
Collembola is associated with survival or colonizing strategies (Salmon et al., 2014). Sexual 387
reproduction favors polymorphism and is an advantage for colonizing disturbed ecosystems like 388
polluted soils on a long term (Austruy et al., 2016). According to the trait-based approach, individuals 389
with a long body, several ocelli, a PAO organ, a sexual reproduction type, an epiedaphic living form 390
and a pigmented body mainly represented the Collembola community in soil F. All of these trait 391
attributes are characteristic of organisms inhabiting in urban environments (Santorufo et al., 2014), 392
and are linked to a good dispersal ability that allows adaptation to disturbed habitats. The age effect 393
was not a major factor explaining the functional composition of communities according to the RLQ. 394
Yet, we may expect links between the fact that CCS was the youngest plot and that it hosted a 395
Collembola community rich in high dispersal capacity species, which are best adapted for site 396
colonization. 397
Regarding macrofauna community, available soil Pb concentrations seemed to influence earthworm 398
density: the highest earthworm density was found in soils with low metal contamination (CS and WL) 399
as compared to other soils. This impact of Pb concentrations on earthworm communities has been 400
shown by Lévêque et al. (2015), who observed a low earthworm density in soils near a Pb-recycling 401
factory containing a high total Pb concentration (2,010 mg.kg-1 of Pb on average, that is a higher 402
concentration than in our soils). Pižl and Josens (1995) also observed a low earthworm density in soils 403
with a moderate Pb concentration (89 ind.m-2 in a soil containing 108 mg.kg-1 of total Pb) as compared 404
to a soil with a low Pb concentration (490 ind.m-2 in a soil containing 25 mg.kg-1 of total Pb). In our 405
study, we found 42 and 48 earthworms.m-2 on average in the soils with the highest total Pb 406
concentrations (346 and 339 mg.kg-1 for CP1 and SP, respectively) and 112 and 45 earthworms.m-2 on 407
average in the soils with the lowest total Pb concentrations (41 and 37 mg.kg-1 for WL and CP2, 408
respectively). Other authors have also shown that earthworms were sensitive to metal pollution 409
(Nahmani and Lavelle, 2002; Nahmani et al., 2005). As Collembola, earthworms abundance and 410
diversity are dependent of soil properties, that highlight their bioindicator potential (Ponge et al., 2003; 411
Pérès et al., 2011; George et al., 2017). Furthermore, a higher available soil Zn concentration was 412
associated with a higher density of sclerotized macrofauna individuals. We can hypothesize that 413
organisms with sclerotized integuments are more protected against pollutants because sclerotized 414
integuments provide defence against chemical attacks (Linz et al., 2016). By contrast, soft-body 415
individuals may be directly exposed to pollution by direct skin contact. A negative correlation has 416
already been observed between the proportion of soft-body individuals and metal soil concentrations 417
(Hedde et al., 2012). 418
Finally, at a larger spatial scale, the surrounding landscape would have to be taken into 419
account in order to better understand the variability of community composition across sites. 420
Collembola and macrofauna communities can be both affected by surrounding environment and 421
vegetation in derelict soils (Cortet et al., 2013; Baranova et al., 2014; Vanhee et al., 2017). Although 422
no geostatistical analyses were performed in the present study, some hypotheses might be suggested 423
on species traits selection. For instance, we found that communities were dominated by forest and 424
grassland habitat taxa, which can be explained by the surrounding landscapes around the sites. CP1, 425
SP and CP2 were surrounded by forests, while CS, WL and CCS were surrounded by grasslands. This 426
could explain the significant higher proportion of euedaphic, blind and non-pigmented Collembola in 427
CP1 and SP, that are characteristics traits of forest-inhabiting species (Salmon et al., 2014). Moreover, 428
the proportion of macrofauna inhabiting wet habitats was higher in SP than in CS, WL and CP2, 429
which could be explained by the proximity to a river (ca. 70 m away). The proportion of Collembola 430
inhabiting wetland habitats was higher in CCS. The inefficient irrigation system in this experimental 431
constructed soil probably allowed for colonization by wet-habitat species. Moreover, these species 432
may have come from a nearby pond located at 300 m distance and been brought by trucks and human 433
activities during the soil construction process or wind or animals (Costa et al., 2013). 434
435 436
5. CONCLUSION
437
The diversity indices of Collembola and macrofauna communities showed different results 438
attributable to differences in living modes between the two soil invertebrate communities (e.g. feeding 439
groups and niche scales). It shows that the derelict soils support different communities with more or 440
less wide functional potential depending on their physico-chemical characteristics. Our study revealed 441
that derelict soil characteristics have more consequences on taxonomical and functional profiles of 442
Collembola communities than macrofauna. In this sense, we can assume that Collembola are more 443
relevant bioindicators of derelict soil characteristics than macrofauna. For instance, the studied more 444
fertile and less contaminated compost-amended constructed soil exhibited taxonomic and functional 445
community structures and composition of slightly disturbed soil. In contrast, the metal-contaminated 446
constructed soil harbored a higher proportion of Collembola with the traits and ecological preferences 447
of both unstable and scarcely vegetated ecosystems. Our study underlines the interest of trait-based 448
approach and multi traits studies to assess the diversity of derelict soils and to reach a better 449
understanding of soil ecosystem. However, in-depth analysis of direct relations between Collembola 450
and macrofauna in these soils was limited due to different traits and attributes between both fauna 451
groups in existing databases. 452
Since we studied invertebrate communities at one given season, it might be interesting to characterize 453
the community response patterns at different seasons. We previously measured the potential 454
mineralization activity of these derelict soils (Vincent et al., 2018), but in situ measurement of soil 455
functions, such as organic matter decomposition - by litter bag method - or soil respiration, might add 456
complementary information to link functional traits of the fauna with the derelict soil functioning. 457
458 459
ACKNOWLEDGEMENTS
460
This work was carried out within the GISFI (Groupement d'intérêt scientifique sur les friches 461
industrielles, www.gisfi.fr), within the framework of the LORVER project (www.lorver.org). It was 462
supported by the French Lorraine Region and the European Regional Development Fund (ERDF). The 463
authors wish to thank Mickaël Hedde and Jodie Thénard for identifying ground beetles and a few other 464
coleoptera, and BETSI project colleagues for providing access to their database. We also thank 465
Sandrine Salmon and Johanne Nahmani for coding the traits of numerous Collembola species, and 466
Sophie Joimel for providing the Collembola trait database. We also thank the technical staff of the 467
GISFI, LIEC and LSE for the sampling campaign, particularly Alain Rakoto. 468
469
REFERENCES
470
Anderson, J.M., Ingram, J.S.I., 1993. Tropical Soil Biology and Fertility-A handbook of methods. Soil 471
Sci. 157, 265. 472
Aubin, I., Venier, L., Pearce, J., Moretti, M., 2013. Can a functional multi-taxa approach improve our 473
assessment of forest management impact on biodiversity ? Biodivers. Conserv. 22, 2957–2975. 474
Auclerc, A., Ponge, J.-F., Barot, S., Dubs, F., 2009. Experimental assessment of habitat preference and 475
dispersal ability of soil springtails. Soil Biol. Biochem. 41, 1596–1604. 476
Austruy, A., Laplanche, C., Mombo, S., Dumat, C., Deola, F., Gers, C., 2016. Ecological changes in 477
historically polluted soils: Metal(loid) bioaccumulation in microarthropods and their impact on 478
community structure. Geoderma 271, 181–190. 479
Baranova, B., Manko, P., Jaszay, T., 2014. Waste dumps as local biodiversity hotspots for soil 480
macrofauna and ground beetles (Coleoptera: Carabidae) in the agricultural landscape. Ecol. Eng. 481
81, 1–13. 482
Bonthoux, S., Brun, M., Di Pietro, F., Greulich, S., Bouché-Pillon, S., 2014. How can wastelands 483
promote biodiversity in cities? A review. Landsc. Urban Plan. 132, 79–88. 484
Bruno, D., Gutiérrez-Cénovas, C., Velasco, J., Sànchez-Fernàndez, D., 2016. Functional redundancy 486
as a tool for bioassessment: A test using riparian vegetation. Sci. Total Environ. 566–567, 1268– 487
1276. 488
Bukvareva, E., 2017. The optimal biodiversity – A new dimension of landscape assessment. Ecol. 489
Indic. nd. 490
Butt, K.R., Briones, M.J.I., 2017. Earthworms and mesofauna from an isolated, alkaline chemical 491
waste site in Northwest England. Eur. J. Soil Biol. 78, 43–49. 492
Chevene, F., Doleadec, S., Chessel, D., 1994. A fuzzy coding approach for the analysis of long-term 493
ecological data. Freshw. Biol. 31, 295–309. 494
Cluzeau, D., Guernion, M., Chaussod, R., Martin-Laurent, F., Villenave, C., Cortet, J., Ruiz-Camacho, 495
N., Pernin, C., Mateille, T., Philippot, L., Bellido, A., Rougé, L., Arrouays, D., Bispo, A., Pérès, 496
G., 2012. Integration of biodiversity in soil quality monitoring: Baselines for microbial and soil 497
fauna parameters for different land-use types. Eur. J. Soil Biol. 49, 63–72. 498
Cole, L., Bradford, M.A., Shaw, P.J.A., Bardgett, R.D., 2006. The abundance, richness and functional 499
role of soil meso- and macrofauna in temperate grassland-A case study. Appl. Soil Ecol. 33, 500
186–198. 501
Cortet, J., Béguiristain, T., Charissou, A.-M., Chenot, E.-D., Corbel, S., Cluzeau, D., Hafeez, F., 502
Hedde, M., Leyval, C., Martin-Laurent, F., Masfaraud, J.-F., Nahmani, J., Piron, D., Schwartz, 503
C., Séré, G., Villenave, C., Watteau, F., 2013. Early colonisation of a constructed Technosol by 504
soil organisms after industrial site reclamation, in: Soils of Urban, Industrial, Traffic, Mining and 505
Military Areas. SUITMA 7. Toruń, 16-20 September 2013. International Union of Soil Sciences 506
(IUSS), pp. 119–120. 507
Costa-Milanez, C.B. da, Majer, J.D., Castro, P. de T.A., Ribeiro, S.P., 2017. Influence of soil 508
granulometry on average body size in soil ant assemblages: implications for bioindication. 509
Perspect. Ecol. Conserv. 15, 102–108. 510
Costa, D., Timmermans, M.J.T.N., Sousa, J.P., Ribeiro, R., Roelofs, D., Van Straalen, N.M., 2013. 511
Genetic structure of soil invertebrate populations: Collembolans, earthworms and isopods. Appl. 512
Soil Ecol. 68, 61–66. 513
Cundy, A.B., Bardos, R.P., Puschenreiter, M., Mench, M., Bert, V., Friesl-Hanl, W., Müller, I., Li, 514
X.N., Weyens, N., Witters, N., Vangronsveld, J., 2016. Brownfields to green fields: Realising 515
wider benefits from practical contaminant phytomanagement strategies. J. Environ. Manage. 186, 516
67–77. 517
Development Core Team, R., 2015. A language and environment for statistical computing. Austria, 518
Vienna : the R foundation for statistical computing. 519
Dickinson, N., 2003. Soil degradation and nutrients, in: The Restoration and Management of Derelict 520
Land: Modern Approaches. World Scientific, pp. 50–65. 521
Dolédec, S., Chessel, D., ter Braak, C.J.F., Champely, S., 1996. Matching species traits to 522
environmental variables: a new three-table ordination method. Environ. Ecol. Stat. 3, 143–166. 523
Dray, S., Chessel, D., Thioulouse, J., 2003. Co‐ inertia analysis and the linking of ecological data 524
tables. Ecology 84, 3078–3089. 525
Dray, S., Choler, P., Dolédec, S., Peres-Neto, P.R., Thuiller, W., Pavoine, S., Ter Braak, C.J.F., 2014. 526
Combining the fourth-corner and the RLQ methods for assessing trait responses to 527
environmental variation. Ecology 95, 14–21. 528
Dray, S., Dufour, A.B., 2007. The ade4 Package: Implementing the duality diagram for ecologists. J. 529
Stat. Softw. 22, 1–20. 530
Dunger, W., Schlitt, B., 2011. Synopses on Palaearctic Collembola – Tullbergiidae. Senckenberg, 531
Museum of Natural History. 532
Eisenhauer, N., 2010. The action of an animal ecosystem engineer: Identification of the main 533
mechanisms of earthworm impacts on soil microarthropods. Pedobiologia (Jena). 53, 343–352. 534
Eyre, M.D., Luff, M.L., Woodward, J.C., 2003. Beetles (Coleoptera) on brownfield sites in England: 535
An important conservation resource? J. Insect Conserv. 7, 223–231. 536
Fjellberg, A., 2007. Checklist of Nordic Collembola With notes on habitat preferences and 537
presence/absence in individual countries. www.collembola.org. 538
Fountain, M.T., Hopkin, S.P., 2004. A comparative study of the effects of metal contamination on 539
Collembola in the field and in the laboratory. Ecotoxicology 13, 573–587. 540
Kolaříková, K., Franklin, J., Nawrot, J., Groninger, J.W., Stahl, P.D., 2013. Soil biota in post-542
mining sites along a climatic gradient in the USA: Simple communities in shortgrass prairie 543
recover faster than complex communities in tallgrass prairie and forest. Soil Biol. Biochem. 67, 544
212–225. 545
Garnier, E., Cortez, J., Billès, G., Navas, M., Roumet, C., 2004. Plant functional markers capture 546
ecosystem properties during secondary succession. Ecology 85, 2630–2637. 547
Gerisch, M., 2014. Non-random patterns of functional redundancy revealed in ground beetle 548
communities facing an extreme flood event. Funct. Ecol. 28, 1504–1512. 549
Gillet, S., Ponge, J.F., 2004. Are acid-tolerant Collembola able to colonise metal-polluted soil? Appl. 550
Soil Ecol. 26, 219–231. 551
Hedde, Van Oort, F., Lamy, I., 2012. Functional traits of soil invertebrates as indicators for exposure 552
to soil disturbance. Environ. Pollut. 164, 59–65. 553
Heiniger, C., Barot, S., Ponge, J.F., Salmon, S., Meriguet, J., Carmignac, D., Suillerot, M., Dubs, F., 554
2015. Collembolan preferences for soil and microclimate in forest and pasture communities. Soil 555
Biol. Biochem. 86, 181–192. 556
Hodecek, J., Kuras, T., Sipos, J., Dolny, A., 2016. Role of reclamation in the formation of functional 557
structure of beetle communities: A different approach to restoration. Ecol. Eng. 94, 537–544. 558
Hothorn, T., Zeileis, A., Farebrother, R.W., Cummins, C., Millo, G., Mitchell, D., 2015. lmtest: 559
Testing linear regression models. R Packag. version 0.9-34. 560
ISO 23611-2, 2006. Soil quality -- Sampling of soil invertebrates -- Part 2: Sampling and extraction of 561
micro-arthropods (Collembola and Acarina). 562
ISO 23611-5, 2011. Soil quality -- Sampling of soil invertebrates -- Part 5: Sampling and extraction of 563
soil macro-invertebrates. 564
Joimel, S., 2015. Biodiversité et caractéristiques physico-chimiques des sols de jardins associatifs 565
urbains français. Doctoral dissertation, University of Lorraine. 566
Kibblewhite, M., Ritz, K., Swift, M., 2008. Soil health in agricultural systems. Philos. Trans. R. Soc. 567
Lond. B. Biol. Sci. 363, 685–701. 568
Kleyer, M., Dray, S., Bello, F., Lepš, J., Pakeman, R.J., Strauss, B., Thuiller, W., Lavorel, S., 2012. 569
Assessing species and community functional responses to environmental gradients: Which 570
multivariate methods? J. Veg. Sci. 23, 805–821. 571
Laliberté, E., Legendre, P., Shipley, B., Laliberté, M., 2014. FD: measuring functional diversity from 572
multiple traits, and other tools for functional ecology. R Packag. version 1.0-12. 91, 299–305. 573
Lévêque, T., Capowiez, Y., Schreck, E., Mombo, S., Mazzia, C., Foucault, Y., Dumat, C., 2015. 574
Effects of historic metal(loid) pollution on earthworm communities. Sci. Total Environ. 511, 575
738–746. 576
Levin, M., Kim, K., Morel, J., Burghardt, W., Charzyński, P., Shaw, R., 2017. Soils within Cities. 577
Global approaches to their sustainable management. Soil Use and Management, 33(4), 673-673. 578
Linz, D.M., Hu, A.W., Sitvarin, M.I., Tomoyasu, Y., 2016. Functional value of elytra under various 579
stresses in the red flour beetle, Tribolium castaneum. Sci. Rep. 6, 34813. 580
Macfadyen, A., 1961. Improved funnel-type extractors for soil arthropods. J. Anim. Ecol. 30, 171– 581
184. 582
Makkonen, M., Berg, M.P., van Hal, J.R., Callaghan, T. V., Press, M.C., Aerts, R., 2011. Traits 583
explain the responses of a sub-arctic Collembola community to climate manipulation. Soil Biol. 584
Biochem. 43, 377–384. 585
Martins da Silva, P., Carvalho, F., Dirilgen, T., Stone, D., Creamer, R., Bolger, T., Sousa, J.P., 2016. 586
Traits of collembolan life-form indicate land use types and soil properties across an European 587
transect. Appl. Soil Ecol. 97, 69–77. 588
Morel, J.L., Schwartz, C., Florentin, L., de Kimpe, C., 2005. Urban soils - Ed: Hillel, Daniel, in: 589
Encyclopedia of Soils in the Environment. Elsevier, Oxford, pp. 202–208. 590
Nahmani, J., Capowiez, Y., Lavelle, P., 2005. Effects of metal pollution on soil macroinvertebrate 591
burrow systems. Biol. Fertil. Soils 42, 31–39. 592
Nahmani, J., Lavelle, P., 2002. Effects of heavy metal pollution on soil macrofauna in a grassland of 593
Northern France. Eur. J. Soil Biol. 38, 297–300. 594
Nahmani, J., Rossi, J.P., 2003. Soil macroinvertebrates as indicators of pollution by heavy metals. C. 595
R. Biol. 326, 295–303. 596
Mesaphorura macrochaeta (Tullbergiinae, Collembola). Pedobiologia (Jena). 44, 476–488. 598
Oksanen, J., Blanchet, F.G., Kindt, R., Legendre, P., Minchin, P.R., Hara, R.B.O., Simpson, G.L., 599
Solymos, P., Stevens, M.H.H., 2017. Package ‘ vegan ’ - Community Ecology Package. 600
Orgiazzi, A., Bardgett, R.D., Barrios, E., Behan-Pelletier, V., Briones, M.J.I., Chotte, J.-L., De Deyn, 601
G.B., Eggleton, P., Fierer, N., Fraser, T., Hedlund, K., Jeffery, S., Johnson, N.C., Jones, A., 602
Kandeler, E., Kaneko, N., Lavelle, P., Lemanceau, P., M, D.H., 2016. Global soil biodiversity 603
atlas, Global soil biodiversity atlas. European Commission. 604
Parisi, V., Menta, C., Gardi, C., Jacomini, C., Mozzanica, E., 2005. Microarthropod communities as a 605
tool to assess soil quality and biodiversity: A new approach in Italy. Agric. Ecosyst. Environ. 606
105, 323–333. 607
Pérès, G., Vandenbulcke, F., Guernion, M., Hedde, M., Beguiristain, T., Douay, F., Houot, S., Piron, 608
D., Richard, A., Bispo, A., Grand, C., Galsomies, L., Cluzeau, D., 2011. Earthworm indicators as 609
tools for soil monitoring, characterization and risk assessment: An example from the national 610
Bioindicator programme. Pedobiologia - Int. J. Soil Biol. 54, S77–S87. 611
Pey, B., Nahmani, J., Auclerc, A., Capowiez, Y., Cluzeau, D., Cortet, J., Decaens, T., Deharveng, L., 612
Dubs, F., Joimel, S., others, 2014. Current use of and future needs for soil invertebrate functional 613
traits in community ecology. Basic Appl. Ecol. 15, 194–206. 614
Pižl, V., Josens, G., 1995. Earthworm communities along a gradient of urbanization. Environ. Pollut. 615
90, 7–14. 616
Plum, N., 2005. Terrestrial invertebrates in flooded grassland: A literature review. Wetlands 25, 721– 617
737. 618
Ponge, J., Dubs, F., Gillet, S., Sousa, J., Lavelle, P., 2006. Decreased biodiversity in soil springtail 619
communities: the importance of dispersal and land-use history in heterogeneous landscapes. Soil 620
Biol. Biochem. 38, 1158–1161. 621
Ponge, J.F., Gillet, S., Dubs, F., Fedoroff, E., Haese, L., Sousa, J.P., Lavelle, P., 2003. Collembolan 622
communities as bioindicators of land use intensification. Soil Biol. Biochem. 35, 813–826. 623
Rosenfield, M.F., Müller, S.C., 2017. Predicting restored communities based on reference ecosystems 624
using a trait-based approach. For. Ecol. Manage. 391, 176–183. 625
Sabrina, D.T., Hanafi, M.M., Azwady Nor, A.A., Mahmud, T.M.M., 2009. Earthworm populations 626
and cast properties in the soils of oil palm plantations. Malaysian J. Soil Sci. 13, 29–42. 627
Salmon, S., Ponge, J.F., 2012. Species traits and habitats in springtail communities : A regional scale 628
study. Pedobiologia (Jena). 55, 295–301. 629
Salmon, S., Ponge, J.F., Gachet, S., Deharveng, L., Lefebvre, N., Delabrosse, F., 2014. Linking 630
species, traits and habitat characteristics of Collembola at European scale. Soil Biol. Biochem. 631
75, 73–85. 632
Santorufo, L., Cortet, J., Arena, C., Goudon, R., Rakoto, A., Morel, J.L., Maisto, G., 2014. An 633
assessment of the influence of the urban environment on collembolan communities in soils using 634
taxonomy- and trait-based approaches. Appl. Soil Ecol. 78, 48–56. 635
Santorufo, L., Cortet, J., Nahmani, J., Pernin, C., Salmon, S., Pernot, A., Morel, J.L., Maisto, G., 2015. 636
Responses of functional and taxonomic collembolan community structure to site management in 637
Mediterranean urban and surrounding areas. Eur. J. Soil Biol. 70, 46–57. 638
Sechi, V., De Goede, R.G.M., Rutgers, M., Brussaard, L., Mulder, C., 2017. A community trait-based 639
approach to ecosystem functioning in soil. Agric. Ecosyst. Environ. 239, 265–273. 640
Séré, G., Schwartz, C., Ouvrard, S., Sauvage, C., Renat, J.C., Morel, J.L., 2008. Soil construction: A 641
step for ecological reclamation of derelict lands. J. Soils Sediments 8, 130–136. 642
Small, E., Sadler, J.P., Telfer, M., 2006. Do landscape factors affect brownfield carabid assemblages? 643
Sci. Total Environ. 360, 205–222. 644
Tilman, D., 2001. Functional diversity, in: Encyclopedia of Biodiversity. Academic Press, pp. 109– 645
121. 646
Tilman, D., Isbell, F., Cowles, J.M., 2014. Biodiversity and ecosystem functioning. Nature’s Serv. 647
Soc. Depend. Nat. Ecosyst. 93, 112. 648
Vandewalle, M., De Bello, F., Berg, M.P., Bolger, T., Dolédec, S., Dubs, F., Feld, C.K., Harrington, 649
R., Harrison, P.A., Lavorel, S., 2010. Functional traits as indicators of biodiversity response to 650
land use changes across ecosystems and organisms. Biodivers. Conserv. 19, 2921–2947. 651
Vanhee, B., Salmon, S., Devigne, C., Leprêtre, A., Deharveng, L., Ponge, J.-F., 2017. The ‘terril’ 652
northern France. Appl. Soil Ecol. 121, 90–101. 654
Verberk, W.C.E.P., van Noordwijk, C.G.E., Hildrew, A.G., 2013. Delivering on a promise: integrating 655
species traits to transform descriptive community ecology into a predictive science. Freshw. Sci. 656
32, 531–547. 657
Villéger, S., Mason, N.W.H., Mouillot, D., 2008. New multidimensional functional diversity indices 658
for a multifaceted framework in functional ecology. Ecology 89, 2290–2301. 659
Vincent, Q., Auclerc, A., Beguiristain, T., Leyval, C., 2018. Assessment of derelict soil quality : 660
Abiotic , biotic and functional approaches. Sci. Total Environ. 613–614, 990–1002. 661
Violle, C., Navas, M.L., Vile, D., Kazakou, E., Fortunel, C., Hummel, I., Garnier, E., 2007. Let the 662
concept of trait be functional! Oikos 116, 882–892. 663
Wong, M., Bradshaw, A., 2002. The restoration and management of derelict land: modern approaches. 664
World Scientific. 665
Wood, S.A., Karp, D.S., DeClerck, F., Kremen, C., Naeem, S., Palm, C.A., 2015. Functional traits in 666
agriculture: Agrobiodiversity and ecosystem services. Trends Ecol. Evol. 30, 531–539. 667
Wright, J.P., Gurney, W.S.C., Jones, C.G., 2012. Patch dynamics modified by ecosystem engineers. 668
Oikos 105, 336–348. 669
Table 1: Abiotic parameters of the six derelict soils. Means ± SD (n=5, except for soil F where n=4). 1
Soil classification according WRB (2014); localization in the Lambert 93 projection in m; age is the 2
time lapse from the last anthropogenic action (years); clay and WHC in %; CEC in cmol+.kg-1 dry soil; 3
soil pH in water; Olsen Phosphorous in mg.kg-1 dry soil; OM in ‰; Exchangeable Ca, K, Mg, Na in 4
mg.kg-1 dry soil, Available and total Cd, Pb, Zn in mg.kg-1 dry soil; and PAH (Polycyclic Aromatic 5
Hydrocarbons) concentrations in mg.kg-1 dry soil. For more details, see Vincent et al. (2018). 6
Soil abbreviation CS WL CP1 SP CP2 CCS
Soil name correspondence
with Vincent et al., 2018 A B C D E F
Site type and name
Experimental constructed soil (Biotechnosol) Non-hazardous waste landfill (Retonfey) Coking plant site (Homécourt) Settling pond site (Moyeuvre-Petite) Coking plant site (Micheville) Experimental constructed and contaminated soil (Jeandelaincourt)
Soil classification Spolic Garbic Technosol Skeletic Technosol Spolic Technosol Spolic Technosol Spolic Technosol Spolic Technosol Composition paper mill waste, thermal desorption-treated PAH- contaminated soil, and green-waste compost ground construction and demolition wastes former coking plant site settling pond site filled with
steel sludge former coking plant site biopile-treated PAH-contaminated soil mixed with
metal-contaminated sludge Year of construction 2007 2011 2013 Year of abandonment 1980 1981 1975 Age 8 4 35 34 40 2 Localization E:918202 N:6905686 E:942352 N:6897630 E:918487 N:6905891 E:920222 N:6911528 E:942262 N:6897475 E:938477 N:6864617 Texture Silt loam Silty clay loam Loamy sand Sandy loamy Loam Silt loam
Clay 11 40 6 4 27 15 WHC 95±7 59±8 63±5 58±4 70±1 64±1 CEC 22.0±2.9 17.2±3.3 17.2±1.8 11.3±0.7 15.5±1.4 10.1±0.4 pH 7.9±0.2 7.9±0.1 7.9±0.1 8.4±0.2 7.2±0.2 8.3±0.4 Olsen Phosphorous 62±5 25±17 39±16 44±10 36±2 44±10 C:N 30±6 28±6 26±5 65±20 20±3 37±16 OM 39.7±5.9 3.2±1.4 16.7±6.3 13.3±2.8 4.8±3.0 2.8±0.8 Caexchangeable 292±44 713±144 903±405 2031±240 786±84 1123±130 Kexchangeable 706±105 491±24 155±36 377±30 131±50 218±36 Mgexchangeable 84±14 152±38 103±6 312±47 47±15 72±34 Naexchangeable 37±19 34±28 11±3 42±11 14±14 55±29 Cdavailable 0.22±0.05 0.03±0.01 0.16±0.05 0.15±0.01 0.10±0.03 9.07±1.5 Pbavailable 13±3 14±10 46±14 18±5 14±6 110±60 Znavailable 29±9 8±6 45±20 25±6 7±2 308±189 Cdtotal 1.1±0.5 0.1±0.2 0.1±0.7 1.4±0.1 0.1±0.1 23.6±6.9 Pbtotal 150±53 41±26 346±106 339±50 37±10 460±73 Zntotal 345±37 131±2 1162±396 1196±122 116±23 1813±302 Σ16 PAH (US-EPA) 170±49 12±12 179±136 97±54 142±90 10±4 7