PSFC/JA-07-3
Effect of Compression Ratio and Manifold Pressure on Ethanol Utilization
in Gasoline/Ethanol Engines
L. Bromberg D.R. Cohn
November 15, 2006 Revised: March 15, 2007
MIT Plasma Science and Fusion Center
Massachusetts Institute of Technology Cambridge MA
Abstract
The model developed previously for evaluating the impact of direct ethanol injection on the avoidance of knock in spark ignition engines is used to evaluate the trends of changes in compression ratio and variation in the inlet pressure. The ethanol fraction
requirements through the engine map is calculated using detailed chemical kinetics model, and a vehicle simulation is used to determine the required ethanol for multiple driving cycles.
I. Introduction
The operation of spark ignition engines is severely constrained by the occurrence of knock, the uncontrolled ignition of a fraction of the air fuel mixture during in the cylinder [1]. The effect limits the maximum compression ratio and inlet manifold pressure in the cylinder. The knock limit prevents design of an engine that uses the features that have allowed increased performance of modern passenger vehicles, such as engine downsizing and increased compression ratio. [2]
Knocking in an engine occurs usually under conditions of high torque and low engine speed. Engines experience the worst knocking condition when towing in hot, dry
weather, while climbing and/or pulling a load. However, these conditions, or combination of high torque/low rpm conditions are infrequent in conventional driving cycles.
The knock conditions of the engine are a strong function of the temperature of the air/fuel mixture and the octane of the fuel, and of the operating torque of the engine. Direct injection of gasoline has been exploited in production vehicles, usually requiring the use of premium gasoline. There is limited charge cooling due to the direction injection of gasoline.
A much larger effect can be obtained when an alcohol fuel is directly injected. Racing vehicles use this feature, as illustrated in the Ecotec engine (see, for example, [3]). Direct injection of either methanol or ethanol has been proposed for operation of a bi-fuel
engine that runs on gasoline during operation with low propensity to knock, and then uses direct injection of alcohol at condition where knock would occur. It is possible to
practically eliminate the knock constrain [4, 5]
Calculations of the ethanol requirement is important in order to evaluate the requirements of the second fuel tank that contains the alcohol, and to develop refueling approaches. Ethanol requirements were calculated using the model developed. [5] However, very limited results were provided. The effects of compression ratio as well as maximum manifold pressures on the ethanol requirement were not calculated.
In this paper, the impact of different compression ratios, manifold pressures, and driving cycles on the ethanol consumption are calculated. Section 2 extends the ethanol
requirement calculations through the engine map for two compression ratios, 10 and 12, and manifold pressure of 2 bar. The effect of direct injection vs port fuel injection of the gasoline is explored. In section 3, the results are interpolated in order to calculate the ethanol consumption through the entire engine map. In addition, the results are
extrapolated to include conditions of higher manifold pressure. In section 4, the model is used to calculate the ethanol consumption through multiple vehicle driving cycles. Finally, section 5 summarizes the results.
The model developed before [5] has been used to determine the minimum ethanol addition that prevents knock. Basically a simple model is used to determine the conditions of the inlet manifold at the time of inlet valve shutoff, that includes the temperature increase due to turbocharging, intercooler, residuals, and charge cooling due to evaporation of the fuel. It has been assumed that the injection and evaporation is instantaneous, and occurs right at the moment of inlet valve closing. These conditions results in the largest decrease of the charge temperature temperature, at constant-volume conditions (instead of constant pressure conditions). [5] The effects of finite fuel injection and evaporation time will be considered in the future, using a more complete description of the engine, including composition of the cylinder charge that includes the residuals. The ethanol requirement over three boundaries in the engine map are determined. The first one determines the maximum manifold pressure at which knock is avoided without the use of any ethanol, as a function of the engine speed. In the model, increased engine speed increases the engine tolerance against knock by decreasing the time scales.
The second boundary calculates the ethanol requirement at condition of minimum engine speed but increased inlet manifold pressure. The model does not assume the use of either rich operation or spark retard as means of obtaining knock free operation, and thus in principle the model assumes MBT timing throughout the engine map. Thus such an engine produces substantially more torque at low engine speed that conventional spark ignited engines of the same size.
The third boundary is the ethanol requirement at conditions of 2 bar inlet manifold pressure as a function of engine speed.
The calculations are performed for two means of injection of the gasoline. Although the ethanol is always directly injected, the gasoline can be either port fuel injected or directly injected. In the case of directly injected gasoline, the same assumptions as for ethanol injection are assumed, namely, evaporation right after inlet valve closing. The
evaporative cooling of the gasoline is included in the calculation of the charge conditions (pressure and temperature) at the beginning of the compression cycle.
The results are shown in Figures 1 through 3.
Figure 1 shows the maximum manifold pressure at which the model predicts knock-free operation without the use of ethanol direct injection. The lowest manifold pressure occurs at low engine speed, where increased time allows for the end-gas to develop condition prone to auto-ignition. It should be noted that the model predicts that the engine can not operate without directly injected ethanol at low engine speeds at atmospheric pressures. As mentioned above, this is due to the fact that spark retard or rich operation is not assumed in the model.
As the engine speed increases, the maximum inlet manifold pressure increases for all cases. The allowed torque thus increases monotonically, all other engine conditions the same. Difficulties of the engine breathing at the higher engine speeds and other
conditions that result in a maximum torque somewhere in the middle are not included in the simple model, but will be included in a more sophisticated model in the future. Note that the lines of compression ratio of 12 with directly injected gasoline closely follows the line of compression ratio of 10 with port fuel injected gasoline. Thus the model predicts that direct injection of gasoline allows for a 2-point increase in the compression ratio.
Figure 1. Maximum inlet manifold pressure as a function of engine speed for two compression ratios, and for port fueled and directly injected gasoline; ethanol is directly injected in all cases.
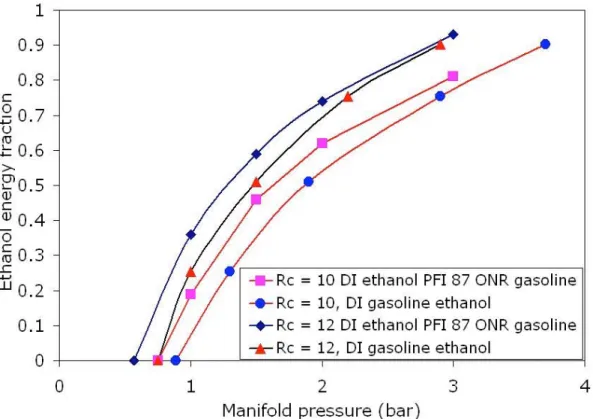
Figure 2 shows the results for the case of near idle (1000 rpm) speed, as a function of the inlet manifold pressure. The figure shows the ratio of the energy provided by the directly injected ethanol over the total energy provided by both the gasoline and the ethanol. As in the case of Figure 1, the model predicts that in the absence of ethanol injection, the maximum inlet manifold pressure is subatmospheric for all cases, but it is higher for the directly injected gasoline and lowest for the case of port fueled gasoline with
compression ratio of 12. In the case of compression ratio of 12, the maximum inlet manifold pressure for conditions with near 100% DI ethanol at near idle is calculated to be about 3 bar. Note that the curves of directly injected and port fueled gasoline merge at conditions of high ethanol fraction, as in these conditions there is little gasoline used, anyway. For the case of compression ratio of 10, the calculated inlet manifold pressure can be as high as around 4 bar.
Figure 2 indicates that increased compression ratio results in a decrease of the manifold pressure of about 0.5 bar for a given ethanol fuel fraction.
Figure 2. DI ethanol energy fraction as a function of inlet manifold pressure, at
conditions near idle (1000 rpm), for compression ratios of 10 and 12, and port-fueled and directly injected gasoline.
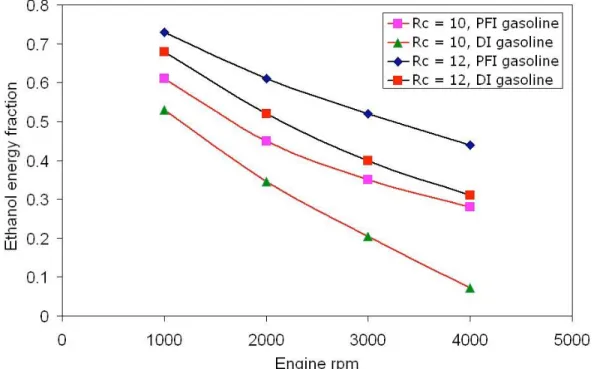
The last boundary in the engine map is shown in Figure 3. Figure 3 provides the minimum DI ethanol fraction that results in knock free operation with an inlet manifold of 2 bar. The increased tolerance of engine to knock with increasing speed is shown in this figure as the required ethanol fraction decreases monotonically for all cases with increased engine speed. The ethanol requirements of the case of compression ratio of 12 with DI gasoline and compression ratio of 10 with PFI gasoline are similar. The highest instantaneous ethanol fraction is about 3/4 for the case of high compression ratio, PFI gasoline. For the case of DI gasoline and compression ratio of 10, the maximum instantaneous ethanol fraction is around 50%. It should be pointed out that because ethanol has about 2/3 of the energy density of gasoline, the required volumetric flow of ethanol is larger than indicated in Figures 2 and 3.
It is interesting to note that the ethanol fraction for a 2-bar inlet manifold pressure decreases to about 0 at high engine speeds with directly injected gasoline with a compression ratio of 10.
Although the ethanol fraction has been calculated only along three boundaries in the engine map, the results calculated in this section will be used in the next section to interpolate the DI ethanol fraction over the engine map.
Figure 3. DI ethanol energy fraction as a function of engine speed for an inlet manifold pressure of 2 bar, for compression ratios of 10 and 12, and for PFI and DI gasoline. III. Ethanol requirement over extended engine map
The calculations in the previous section provide the ethanol requirement over a limited boundary of the engine map. In this section, interpolation is used to determine the ethanol requirement everywhere in the map.
The model allows for the calculation of the ethanol fraction as a function of manifold pressure at low engine speed. In order to interpolate the data, the same functional form is use to interpolate the data at the higher speeds, normalizing the functional dependence so that the values at the extremes (no ethanol requirement at the lower end, 2-bar pressure at the higher end) match those of the calculations in Section 2.
The same process can be used in order to extrapolate the results to increased manifold pressures (above 2 bar). Once the functional dependence at a give engine speed has been determined, the ethanol fraction can be easily extrapolated to higher manifold pressures. It should be noted that the functional dependence of the manifold pressure at low engine speeds uses results for pressures higher than 2 bar, as shown in Figure 2.
The energy fraction throughout the engine map has been calculated for compression ratio of 10 and 12 and for both directly injected and port fueled gasoline. The results are shown in Figure 4 for all 4 cases.
Figure 4. Surface plots of DI ethanol fraction requirement to prevent knock as a function of engine speed and manifold pressure for the 4 cases discussed in this paper.
Similar maps have been constructed for increased levels of turbocharging. IV. Ethanol requirement over multiple drive cycles
The ethanol requirement is clearly a strong function of the drive cycle. If the operator operates at high torque very infrequently, then the ethanol fraction, averaged over the cycle, is very small. If, on the other hand, the operator is towing and requires high torque at relatively low engine speeds, then the ethanol fraction could be substantial. As is the case with fuel economy indications, the ethanol fraction is a strong function of the driving cycle. [6]
The ADVISOR code is used for the vehicle model. [7]
Three driving cycles have been investigated: the Highway Fuel Economy Driving
Schedule (HWFET), the UDDS (urban dynamometer driving cycle), and the us06. These tests are used for evaluating fuel economy of light duty vehicles, and are part of the recently proposed EPA method for evaluating fuel economy [6]. The us06 is an aggressive driving cycle, with high acceleration and high speed operation, sometimes called the “supplemental FTP” driving schedule. The UDDS is commonly called the “city
DI ethanol, Rc=10 DI ethanol, Rc=12
test” and represents city driving conditions. The HWFET represents highway driving conditions with speeds under 60 mph.
The vehicle is a Toyota Highlander, a light SUV. It is assumed that the engine is a modern design, and the model uses a scaled version of a 95 kW Saturn engine. The vehicle is all-wheel drive with automatic transmission. It is assumed that the vehicle is not using energy demanding auxiliaries, such as air-conditioner and operates at 75 Calculation of operation at cold weather conditions have not been performed. The results of the most aggressive cycle (us06) are shown in Figure 5 for the 4 cases considered. The ethanol fraction shown in the Figure corresponds to ethanol requirement by volume. It is the ratio of the volume of DI ethanol required to prevent knock to the volume of the gasoline required for the cycle. Thus, for compression ratio of 12 and PFI gasoline (the most demanding engine combination), at a manifold pressure of 2 bar (corresponding to a boosting of 1 bar), the volume required of ethanol for the cycle is about 20% of the gasoline volume over the cycle.
Figure 5. Volume fraction of DI ethanol required to prevent knock for the vehicle assumed when operating over the us06 driving cycle, for the 4 engine combinations investigated in this paper.
The ethanol requirements are similar for the cases of compression ratio of 12 with DI gasoline and that of compression ratio of 10 with PFI gasoline. The use of DI gasoline allows the increase of the boosting pressure by about 1/2 bar for a given ethanol fraction consumption. us06 0 0.05 0.1 0.15 0.2 0.25 1 1.5 2 2.5 3
Manifold pressure (bar)
Ethanol requirement (vol fraction)
Rc = 10, PFI gasoline
Rc = 10, DI ethanol and gasoline Rc = 12, PFI gasoline
Figure 6. Volume fraction of DI ethanol requirement to prevent knock for several driving cycles as a function of the inlet manifold pressure, for an engine with a compression ratio of 10.
Figure 6 shows the results for an engine with a compression ratio of 10, for several driving cycles. The ethanol requirement for the HWFET and UDDS cycles are very small, as the driving cycles rarely demand that the engine operate at high torque. The ethanol requirement under these cycles is less than 2%, even for manifold pressures as high as 2.5 bar (1.5 bar boost pressure). The case of PFI gasoline with the us06 driving cycle requires about 10% ethanol volume fraction. That is, if the gasoline tank is 20 gallons, the vehicle will consume 2 gallons of ethanol per tank full of gasoline.
Figure 7 shows the same results as Figure 6 but for an engine with a compression ratio of 12. For the us06 cycle, the volume fraction of DI ethanol required is about 20% for a manifold pressure of 2 bar (a boosting of about 1 bar).
It should be noted that for a fixed power/torque, operating with a manifold pressure of 2 bar allows an engine downsizing that is slightly less than a factor of 2.
Rc = 10
0 0.02 0.04 0.06 0.08 0.1 0.12 0.14 0.16 0.18 0.2 1 1.5 2 2.5 3 Manifold pressureEthanol requirement (vol fraction)
us06, PFI gasoline UDDS, PFI gasoline HWFET, PFI gasoline us06, DI gasoline
Figure 7. Same as Figure 6. but for an engine with a compression ratio of 12.
V. Summary
A knock engine model has been coupled to a vehicle simulation model to determine the ethanol fraction requirements for compression ratios of 10 and 12. The cases of DI and PFI gasoline have also been considered. The volume fraction of ethanol has been calculated for multiple driving cycles.
It has been shown that for most driving cycles the ethanol fraction can be kept below 5%. The exception is the aggressive us06 driving cycle. However, it is expected that for most driving conditions, the ethanol fraction can be kept below 5%,
Under these circumstances it is likely that the ethanol refueling is required only after a number of gasoline refuelings. Also it is shown that it unlikely that the ethanol tank would need to be refueled more frequently than the gasoline tank even under aggressive driving conditions. The possible exception is due to towing, requiring high torque and high low rpm for extended period of time.
Rc = 12 0 0.05 0.1 0.15 0.2 0.25 1 1.2 1.4 1.6 1.8 2 2.2 2.4 2.6
Manifold pressure (bar)
Ethanol requirement (vol fraction)
us06 PFI gasoline UDDS PFI gasoline HWFET PFI gasoline us06 DI gasoline
References
[1] J.B. Heywood, Internal Combustion Engine Fundamentals, McGraw-Hill, 1988 [2] B. Lecointe and G, Monnier, Downsizing a Gasoline Engine Using Turbocharging with Direct Injection, SAE Publication 2003-01-0542
[3] R.D. O’Blenes, S.G. Bothwell, Ecotec 2.0 Liter Race Engine, SAE paper 2002-01-3354
[4] D.R. Cohn, L. Bromberg, J.B. Heywood, Direct Injection Ethanol Boosted Gasoline Engines: Biofuel Leveraging For Cost Effective Reduction of Oil Dependence and CO2
Emissions, MIT Laboratory for Energy and the Environment report LFEE 2005-001 (April 2005)
[5] L. Bromberg, D.R. Cohn, J.B. Heywood, Calculations Of Knock Suppression In Highly Turbocharged Gasoline/Ethanol Engines Using Direct Ethanol Injection, MIT Laboratory for Energy and the Environment report LFEE 2006-001 (April 2005) [6] EPA Office of Transportation and Air Quality, Fuel Economy Labeling of Motor Vehicles: Revisions to Improve Calculations of Fuel Economy Estimates, Final Technical Support Document, EPA420-D-06-017 (December 2006)