HAL Id: hal-00316908
https://hal.archives-ouvertes.fr/hal-00316908
Submitted on 1 Jan 2001
HAL is a multi-disciplinary open access
archive for the deposit and dissemination of
sci-entific research documents, whether they are
pub-lished or not. The documents may come from
teaching and research institutions in France or
abroad, or from public or private research centers.
L’archive ouverte pluridisciplinaire HAL, est
destinée au dépôt et à la diffusion de documents
scientifiques de niveau recherche, publiés ou non,
émanant des établissements d’enseignement et de
recherche français ou étrangers, des laboratoires
publics ou privés.
in the study of the circulation of the Adriatic Sea
L. Ursella, M. Gacic
To cite this version:
L. Ursella, M. Gacic. Use of the Acoustic Doppler Current Profiler (ADCP) in the study of the
circulation of the Adriatic Sea. Annales Geophysicae, European Geosciences Union, 2001, 19 (9),
pp.1183-1193. �hal-00316908�
Annales
Geophysicae
Use of the Acoustic Doppler Current Profiler (ADCP) in the study of
the circulation of the Adriatic Sea
L. Ursella1and M. Ga˘ci´c1
1Istituto Nazionale di Oceanografia e di Geofisica Sperimentale, Borgo Grotta Gigante 42/c, 34010 Sgonico (Trieste), Italy
Received: 19 September 2000 – Revised: 7 June 2001 – Accepted: 9 July 2001
Abstract. The results of basin-wide vessel-mounted ADCP
measurements carried out from May 1995 through February 1996 in the Adriatic Sea are analysed in order to characterise the tidal flow, the steady current field and some specific sub-basin scale features. The M2 tide shows the amphidromic point close to the location predicted from theory. The K1 presents an almost constant phase structure that increases in the northern part from east to west during summer. The cir-culation in the Italian coastal shelf area is highly variable, due to the local wind forcing and pulses of the Po River dis-charge. The propagation of the signal associated with the latter, can be described in terms of hybrid internal Kelvin waves, revealed also from the upwelling events. It is also shown that the bottom density-driven current draining the bottom layer of the northern Adriatic is, to a large extent, a time-dependent feature with a temporal scale on the order of days.
Key words. Oceanography: general (descriptive and
re-gional oceanography; marginal and semienclosed seas) Oceanography: physical (currents)
1 Introduction
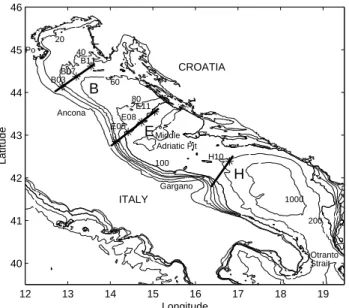
The Adriatic Sea is a semi-closed basin connected to the Mediterranean Sea by the Strait of Otranto. It can be divided into three sub-basins which are characterised by cyclonic cir-culation cells determined by the bathymetry and the hori-zontal pressure gradients. The northern part is very shallow (about 50 m) and is highly influenced by the large amount of fresh water coming from the Po River, which spreads south-ward along the Italian coast. The central part presents a pit of about 270 m in depth. The Palagru˘za Sill (170 m) divides this part from the southern area where the maximum depth is 1200 m (Fig. 1). The southern portion of the basin receives and traps the majority of the saltier water from the Ionian Sea.
Correspondence to: L. Ursella (lursella@ogs.trieste.it)
Up to now, geostrophic calculations have shown the characteristic cyclonic circulation and its principal features (Orli´c et al., 1992; Artegiani et al., 1997), but direct cur-rent measurements to study the basin-wide flow have never been made. During the PRISMA1 project (Programma di Ricerca e di Sperimentazione per il mare Adriatico), a vessel-mounted ADCP (Acoustic Doppler Current Profiler) was used for about a year to measure horizontal currents in the basin, which have then been utilised in the calculation of fluxes of water, particulate and suspended matter through dif-ferent transversal sections (Ga˘ci´c et al., 1998). The ADCP has a very high horizontal resolution which permits the ob-servation of flow features on the order of a kilometre that are not resolved with other current measurement techniques.
In the Adriatic Sea, basin-wide current measurements have never been carried out before. Although the ADCP has been widely utilised and numerous examples can be found in the literature (Candela et al., 1992), this is the first time that cur-rent measurements with a vessel-mounted ADCP have been carried out for a period of about one year in a study of gen-eral basin-wide circulation. The scope of this paper is to de-scribe and interpret the results obtained from the analysis of the ADCP data set, in order to better understand the Adriatic circulation and to explain some of the features encountered along the Italian shelf. More specifically, these features are: the surface coastal boundary current strongly influenced by the riverine fresh water input, sometimes called the Western Adriatic Current (WAC), and the bottom density-driven cur-rent draining the dense water formed in the Northern Adriatic (Artegiani et al., 1989).
In Sect. 2 of this work, a brief description of the experi-mental design is given; in Sect. 3, a description of the method used in the data analysis for the separation of the steady, tidal and residual components can be found; in Sect. 4, the results obtained are shown while Sect. 5 contains the conclusions.
12 13 14 15 16 17 18 19 40 41 42 43 44 45 46 Longitude Latitude CROATIA ITALY 20 40 60 80 100 200 1000 B E H H10 B03 B07 B11 E05 E08 E11 Otranto Strait Ancona Gargano Middle Adriatic Pit Po
Fig. 1. The Adriatic Sea and its bathymetry. The three main sections
analysed in the text are depicted together with moored current-meter positions.
2 Experimental design
ADCP data were collected all over the basin during the pe-riod from 15 May 1995 to 28 February 1996. The instrument was a ship-borne 150 KHz ADCP. The general shallowness of practically the whole basin permitted the measurement of currents throughout the water column. Due to instrument limitations, no data exist in a 9 m thick surface layer and in the bottom layer of about 10% of the total water column depth. The vertical resolution was 2.5 m in shallow waters (up to 75 m) and 5 m in the rest. Pre-planned transects were covered many times, with an overall number of repetitions of about 200. Data coverage can be found in Ga˘ci´c et al. (1998). The transects are perpendicular to the longitudinal axis of the basin and are representative of the three sub-basins (Fig. 1): the first transect (denoted by the letter B) is located in the northern sub-basin, to the south of the Po River delta; the second one is positioned in the centre of the Middle Adriatic Pit (Pomo-Jabuka Pit), and is denoted as transect E; finally, the third one is located over the Palagru˘za Sill, and is named transect H. As already mentioned, the dynamics of each of the three sub-basins is very different. In fact, the northern-most transect represents a shallow area, influenced by a great amount of fresh water, while the southernmost one has the characteristics of an open-sea system in which the saltier and warmer water coming from the Ionian Sea plays an important role. The length of each of the transects is about 120 km, and thus, ADCP measurements were carried out in less than 10 hours. Due to this, the measured current field along a section is, to some extent, contaminated by the current variability on time scales of less than a day, i.e. tidal and inertial oscilla-tions. ADCP data were then averaged on a length of 500 m and the bottom layer currents were obtained by extrapolating
−2 −1.5 −1 −0.5 0 0.5 1 1.5 2 0 0.005 0.01 0.015 0.02 0.025 0.03 0.035 0.04 0.045 Amplitude (m/s) Frequency (cyc/day)
Fig. 2. Summer (bold) and winter (light) rotary spectra for
current-meter at station B11, deployed at a 22 m depth.
velocities with a logarithmic function down to the zero value on the sea floor.
The complete data set was divided into two portions for the subsequent analysis. The first one is called “summer”, and contains data from May to the end of September, when the water column is vertically stratified; the second one is called “winter” and covers the period from October to February, which is the part of the year with a homogeneous vertical density structure or a weakly stratified water column in the major part of the studied area (Zore-Armanda et al., 1991).
In the same period, CTD measurements were carried out with a Seabird CTD probe along the above transects, together with the ADCP recordings, which permitted one to obtain a simultaneous picture of both thermohaline properties and current characteristics.
Moored current meters were also located at some points (Fig. 1) along the mentioned transects, during the same pe-riod, but due to instrument losses and failures, the time series do not cover the whole period. However, the results obtained from the analysis of these data were used to complement the information from the ADCP measurements.
3 Data analysis
Spectral analysis of current-meter time series from different locations in the Adriatic Sea show that the signal is princi-pally constituted in order of importance by a low-frequency signal (periods higher than one day), semidiurnal and diurnal tides, and an inertial signal (period of about 17 hours) (Orli´c et al., 1992). Fig. 2 shows summer and winter rotary spectra for the upper current-meter at station B11; it is clear that the inertial signal is present, in particular, during summer, but very small in winter (Krajcar et Orli´c, 1995); in any case, it is generally weaker than tides.
The aim of this analysis is to separate the tidal signal from the low-frequency one in order to study the space-time vari-ability of both of them. In the case of the ship-borne ADCP data, it is impossible to apply the method classically used with moored current-meter data, due to both space and time
sum win sum win sum win sum win sum win sum win 0 2 4 6 8 Amplitude (cm/s)
B07 B11 E05 E08 E11 H10
sum win sum win sum win sum win sum win sum win
−150 −100 −50 0 50 100 150 Angle (degrees)
B07 B11 E05 E08 E11 H10
(a) (b) B07: 22 m 45 m B11: 20 m 40 m E05: 53 m E08: 54 m 100 m E11: 63 m 110 m H10: 27 m 76 m 220 m
Fig. 3. (a) Semi-major (bold) and semi-minor (light) axis of the M2 tidal component, calculated from current-meter series. Squares indicate
the surface current-meters, stars are the intermediate ones, and triangles are the bottom ones. (b) The same as for (a), but for phase (bold) and orientation (light). Angles are given in a trigonometric coordinate system. Current-meter measurement depths are given in the upper right corner of the figure.
Sep95 Oct95 Nov95 Dec95 Jan96 Feb96 Mar96
0.5 1 1.5 2 2.5 3 Amplitude (cm/s)
Sep95 Oct95 Nov95 Dec95 Jan96 Feb96 Mar96
−150 −100 −50 0 50 100 150 Angle (degrees) (a) (b)
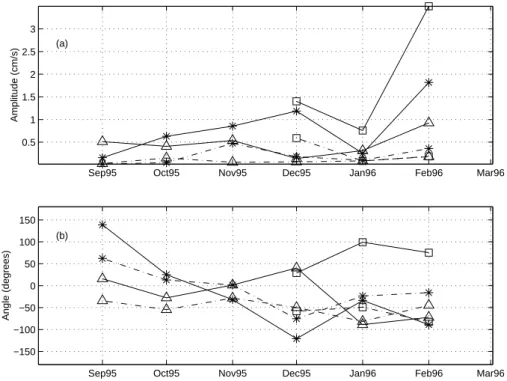
Fig. 4. (a) Semi-major (solid line) and semi-minor (dashed line) axis of the M2 tidal component calculated for periods of one month each
for current-meters at station H10. Squares indicate the surface current-meter (26 m depth), stars are the intermediate ones (76 m depth), and triangles are the bottom ones (220 m depth). (b) The same as for (a), but for phase (solid line) and orientation (dashed line). Angles are given in a trigonometric coordinate system.
Sep Oct 10 cm/s
N 22 m depth
Sep95 Oct95
45 m depth
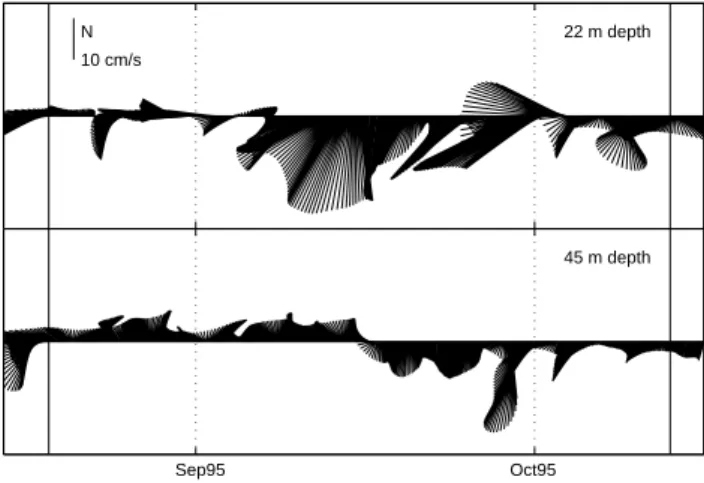
Fig. 5. Low-pass component for surface (top) and bottom (bottom)
current-meters at station B07.
dependence in the data set. Therefore, the detiding method developed by Candela et al. (1992) was used. The method consists of a horizontal space-time fit of the data to a func-tion sum of a “steady” time independent term, and a linear combination of sine and cosine of the tidal frequencies. Both the “steady” part and the coefficients of the tidal term are arbitrary functions of the spatial coordinates. In the present case, biharmonics have been chosen. The time dependent part is comprised of two terms: the tidal component and the one containing the residual temporal variability, which will be called the “residual” in the rest of the paper. The latter is the difference between fitted velocities and current data. In this way, the residual component of the flow field has a time variability on a scale of about a day, and it is contam-inated to some unknown extent by the inertial variability as well. The number of tidal components included in the fit is determined by the length of the record which permits the resolution of different frequencies. Both periods analysed are long enough to resolve the diurnal frequencies from the semidiurnal ones, but it is possible to distinguish some dif-ferent frequencies in each of the two groups only during the summer season. In this way, M2, K1, S2 and O1 are re-solved in the summer period, and only diurnal and semidiur-nal oscillations, in general, during the winter season. Parts of the moored current-meter time series are used to comple-ment ADCP measurecomple-ments in order to cover areas without ADCP data; for this purpose, the current-meter time series which lasts about a day and a half at selected locations has been chosen and treated in the same manner as the ADCP data.
4 Results and discussion
4.1 Tidal structure
The semidiurnal tides in the Adriatic co-oscillate with the tides of the Ionian Sea (Mosetti, 1986). For this reason, the M2 (as well as S2) component can be seen as a Kelvin wave
entering the Strait of Otranto. It propagates northward along the oriental coast of the basin, reaching the northern coast and reflecting together with a certain number of Poincar´e waves, which decay within a distance of about 40 km, and finally, returns along the Italian shoreline (Taylor, 1921; Hen-dershott and Speranza, 1971). The pattern formed by these waves presents an amphidromic point in the current field which is located one-quarter of the wave length to the south of the amphidromic point for the sea level (Polli, 1960). If a mean depth of 200 m is considered for the whole Adri-atic, the amphidromic point in the current field is located at about 450 km to the south of the amphidromic point for the sea surface elevation, which is situated in front of Ancona. This means that the amphidromic point in the current field for the M2 tide should be positioned in front of the Gargano promontory.
Following Defant (1961), the K1 component should present a similar behaviour, since its frequency satisfies the condition that allows for the propagation and reflection of a Kelvin wave in a channel of such dimensions. He predicts that the amphidromic point for the sea level should be lo-cated near the Strait of Otranto, but since the channel’s open end is too close, the amphidromy is very weak and the re-sponse of the basin at the K1 tidal frequency seems then to be a direct one, with the amplitude growing northward. On the contrary, Mala˘ci˘c et al. (2000) suggest that the diurnal constituent is better described as a topographic wave which propagates across the basin from the Croatian coast to the Italian shore. They also show that both the semi diurnal and diurnal tides are manifestations of a family of waves, which exist under the combined actions of gravity and topography. In particular, the M2 tide can be seen as a Kelvin wave prop-agating along the basin since gravity dominates; K1, on the other hand, is better represented by a continental shelf wave propagating across the basin since topography dominates.
Moored current-meter data are used to study the character-istics of tides at some locations in the basin in order to under-stand if the tidal pattern changes with different stratification conditions, i.e. if the predominant component is the baro-clinic or the barotropic one. Looking at the M2 amplitude and phase calculated from the whole set of current-meter data for the two seasons (Fig. 3), it is evident that the semi-major axes at transect B are smaller at the bottom than at the surface, during both summer and winter. On the contrary, the current-meters at transects E and H show similar semi-major axes at different depths. The phase presents a variabil-ity along the water column only at station H10. Moreover, by calculating for each current-meter the M2 amplitude and phase from the data set which has been divided into monthly subsets, it can be observed that the temporal variability is of the same order of magnitude as the spatial one along the ver-tical. At transect B, the variability along the vertical affects the semi-minor and semi-major axis rather than the phase. On the contrary, the winter data set at station H10 (the only available at transect H) shows variability both in amplitude and in phase (Figs. 4a and b). It must be remembered that the deepest current meter at transect B is close to the bottom
12 13 14 15 16 17 18 19 40 41 42 43 44 45 LONGITUDE (East) LATITUDE (North) CROATIA ITALY 20 m2/s 0 50 100 150 200 250 300 350 Degrees
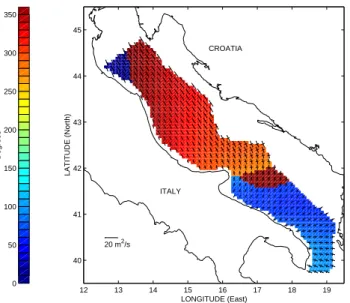
Fig. 6. M2 phase and ellipses calculated from vertically averaged
ADCP data for the summer season. Phase corresponds to times when the semi-major axis is in the first or the fourth trigonometric quadrant.
and, therefore, the variability is probably generated by bot-tom stress and not by stratification. Phase variation along the vertical at station H10 can be explained by the fact that the expected amphidromic point is probably positioned close to transect H and presents a phase jump of about 180 degrees; in this way, small displacements in space can give rise to big phase variations. In conclusion, there is no clear evidence of different behaviour of the tidal pattern between summer and winter from the moored current-meter data analysis. The temporal variability of amplitude and phase within a single period is of the same order as the spatial variability along the vertical.
Therefore, it was decided to remove the barotropic tide from the ADCP data. The mentioned method was applied two times: first, to the velocity field averaged along the verti-cal and multiplied by the depth (barotropic transport) in order to calculate and extract barotropic tides and second, to the detided data at different depths in order to obtain the steady and residual parts and resolve their vertical variability. In fact, low-pass current-meter data show a strong difference in current between the surface and the bottom layer during the stratified season, especially in the northern part of the basin. In particular, the currents for the two current-meters at station B07 (Fig. 5) appear out of phase at the end of the summer when the stratification is still strong and the ther-mocline is located between the two of them; in autumn, the wind induces vertical mixing of the water column and the currents are in phase. The low- pass currents, therefore, sug-gest a baroclinic behaviour during summer and a barotropic behavior during vertically homogeneous density conditions.
The summer tidal structure obtained from ADCP data presents the amphidromic point for M2 slightly more to the south with respect to the theoretical predictions, and the
12 13 14 15 16 17 18 19 40 41 42 43 44 45 LONGITUDE (East) LATITUDE (North) CROATIA ITALY 20 m2/s 0 50 100 150 200 250 300 350 Degrees
Fig. 7. Same as Fig. 6, but for the K1 tidal component.
phase shift is greater than 180 degrees (Fig. 6). Tidal ellipses are longitudinally polarized almost all over the area covered by the data. This is in agreement with the work of Lozano and Candela (1995). The structure of K1 (Fig. 7) presents a growing amplitude proceeding northward, and concerning the phase, it is almost constant in the south, and growing from east to west in the north. This feature in the phase pat-tern in the north is in agreement with Mala˘ci˘c et al. (2000), for whom the diurnal component has the characteristics of a continental shelf wave, propagating from the east coast to the west coast. The jump in the phase pattern near the Strait of Otranto is not real, and is due to the fact that the phase cho-sen is the time for which the semi-major axis is in the first or fourth trigonometric quadrant. In fact, as phase and ellipse orientation are mutually dependent, a shift in the orientation is seen also in the phase. It should be noted that sometimes, defining an interval for the orientation in order to eliminate its indetermination of 180 degrees, introduces an unreal dis-continuity in the phase pattern, as well.
Winter data coverage is insufficient south of the Gargano Promontory. Again, the ellipses for M2 are polarised along the basin axis and the correspondent phase pattern presents the amphidromic point (Fig. 8), but with a shift smaller than expected. The shift observed in the phase pattern in the northern part of the basin is due to the discontinuity of the trigonometric system. The ellipses for K1 (Fig. 9) are not polarized like in summer, but there are two zones (one in the north and the other in the central-eastern part) for which the oscillations are transversal. The amplitude of the K1 tidal component increases southward along the Italian coast and the ellipses are polarized parallel to the shore. The corre-sponding phase is almost constant all over the considered zone. The discontinuities encountered can be explained in the same way as in the case of the summer data.
The fit is done by using as a basis, very general functions, such as polynomials or biharmonics. This procedure permits
12 13 14 15 16 17 18 19 40 41 42 43 44 45 LONGITUDE (East) LATITUDE (North) CROATIA ITALY 20 m2/s 0 50 100 150 200 250 300 350 Degrees
Fig. 8. M2 tidal phase and ellipses calculated from vertically
aver-aged ADCP data for the winter season. Phase corresponds to times when the semi-major axis is in the first or the fourth trigonometric quadrant. 12 13 14 15 16 17 18 19 40 41 42 43 44 45 LONGITUDE (East) LATITUDE (North) CROATIA ITALY 20 m2/s 0 50 100 150 200 250 300 350 Degrees
Fig. 9. Same as Fig. 8, but for the K1 tidal component.
one to obtain preliminary results, but does not reproduce the finer structure. Moreover, this method does not permit the calculation of the errors for the calculated quantities and, therefore, it is difficult to compare them with the ones ob-tained by the current-meters.
It is clear from the above analysis that the spatial and tem-poral distributions of the ADCP data permit an almost com-plete description of the characteristics of the tidal pattern all over the basin; this is hardly possible with moored current-meter data. On the other hand, the analysis of the ADCP data set requires some a priori information, such as the individ-uality of the tidal frequencies or the vertical structure of the tidal pattern.
Jan Feb Mar Apr May Jun Jul Aug Sep Oct Nov Dec Jan Feb 0 500 1000 1500 2000 2500 3000 3500 4000 4500 (1) (2) (3) (4) (5) Discharge (m 3/s)
Fig. 10. Po River discharge for the period of May 1995 to February
1996. The pulses in the Po River discharge analysed in the text are shown.
For what concerns the steady part (not shown here), the applied analysis reproduces well the general features in the basin circulation, with a southerly current along the Italian coast and a counter current along the eastern coast. Sub-basin cyclonic features due to bathymetry and horizontal density gradients are also well reproduced, showing a recirculation structure over the Palagru˘za Sill and at the north of the Mid-dle Adriatic Pit. The detailed discussion of the steady part and the flux calculations can be found in Ga˘ci´c et al. (1998), in Ursella and Ga˘ci´c (1998) and in Ursella et al. (1998).
4.2 Residual currents
The characteristics of the residual field with a time variabil-ity on the order of several days is often very different from the general circulation. In fact, it is possible to find some-times a northward current along the Italian coast, as well as a southward current along the Croatian shore, i.e. opposite to the general circulation pattern. Strong temporal variations of the field are illustrated in Fig. 14, where it is shown that a surface coastal current decreases in a day by 50%, i.e. from about 20 cm/s on 22 September 1995 to about 10 cm/s on the next day. Moreover, the same figure shows two different spa-tial scales in the current field: a larger one with structures on the order of less than 50 km, and a smaller one with patches of dimensions on the order of 10 km in the horizontal, and 10 m in the vertical. The latter can be related to mesoscale eddies, while the former is associated with the basin-wide circulation. In this work, the possible relation between some features encountered in the residual pattern along the Ital-ian coast and the Po River discharge are investigated. In particular, this field can be affected by the sudden discharge events, while the rest of the signal is contained in the steady field. The Po River run-off during the study period (Fig. 10) presents a series of maximums with a time scale typically on the order of a week, concentrated in two periods: May–June and September–January.
From the current-meters of transect B, it is possible to in-vestigate the relation between currents and the Po River dis-charge pulses as a function of the distance of the current-meter from the coast. For this purpose, the low-pass
compo-Table 1. Values for the parameters used in the calculation of the free coastal trapped modes (see Fig. 12 for the explanation of the variables
used), obtained from CTD measurements during August 1995. In the Table, ∆ρ = ρ2− ρ1and ρ = ρ2
H0(m) H1(m) HT OT (m) L (km) ∆ρ(kg/m3) ρ (kg/m3) transect B 5 24 50 30 3 1028 transect E 11 22 100 12 3 1028 transect H 10 20 200 8 2 1029
Table 2. Characteristics of the first four modes (denoted by index n) for the three transects analysed (B, E and H); cnis the velocity of
propagation of the mode, Bnis the ratio of the sea level change across the shelf to the thermocline displacement at the shelf edge, and h is
the thermocline displacement at the shelf edge
B E H cn(m/s) Bn h(m) cn(m/s) Bn h(m) cn(m/s) Bn h(m) n=1 2.0280 0.0159 0.6271 1.5194 0.0047 2.1094 1.2662 0.0028 3.5664 n=2 0.5144 −0.0048 −2.0668 0.1581 −0.0042 −2.4066 0.1111 −0.0028 −3.3484 n=3 0.1633 −0.0008 −12.1296 0.0333 −0.0022 −4.4634 0.0225 −0.0016 −6.4203 n=4 0.0703 −0.0041 −2.418 0.0132 −0.0034 −2.9211 0.0089 −0.0026 −3.8567
nent of the currents was calculated using a 24m214 digital fil-ter (Thompson, 1983) that cuts periods shorfil-ter that 36 hours. The low-pass data were then projected along the shore direc-tion (−50◦in the trigonometric coordinate system). Almost no correlation can be found at any of the current-meter loca-tions, apart from the spring time series at station B03. This current-meter is, in fact, the only one close to the Italian coast (about 30 km), for which current data cover some of the pe-riods of the strong Po River discharge events. Fig. 11 depicts the situation at B03 during May–June 1995, and it is clear that the only significant departures from the zero value in the current curve take place in correspondence to the three Po River maxima and two strong wind events. This can be ex-plained by taking into consideration that the increasing strat-ification during this period, together with strong pulses in the discharge helps the fresh waters to spread evenly over the northern basin (Sturm et al., 1992), thus reaching sta-tion B03; the current, in any case, is weak and it is proba-bly the geostrophic response to the horizontal pressure gra-dients, rather than a direct one. Later during the summer pe-riod, when current data are available, no relevant pulses are present. On the other hand, during the winter season, even if the discharge is rather strong, the mixed water column pre-vents the Po River waters from spreading radially (Sturm et al., 1992), thereby making it impossible to see the signal in the current-meter data. The absence at B03 of the signal as-sociated with the Po River discharge in the winter period can also be attributed to the relatively deep measurement level (17 m). Furthermore, stations B07 and B11 are too far from the delta to be influenced by the fresh water.
In the case of the ship-mounted ADCP, the measurements are much closer to the coast than those of the current-meter moorings, thereby permitting a more detailed study of the coastal boundary layer and a possible relationship with the
Po River discharge. The sudden increases in Po discharge generate impulses that can propagate southward as waves along the Italian coast. Furthermore, their passage may pro-duce displacement of the thermocline, thereby producing upwelling and downwelling. We try to explain the strong changes in the residual current in terms of wave solutions as a response to Po run-off pulses. Simple Kelvin waves are not good approximations for the wave behaviour in the area. The solutions obtained by Gill and Clark (1973), indeed, seem to be more appropriate to describe these waves during the summer period due to the conditions of strong stratification of the sea (Ga˘ci´c et al., 1998). In fact, the method permits one to calculate the free coastal trapped modes, in the case of a system with the coast on one side, a bottom topography approximated by an exponential function for the region near the coast, and a two-layer vertical density distribution in the open sea (Fig. 12). These waves are a hybrid between conti-nental shelf waves and internal Kelvin waves. Applying this method to the western Adriatic shelf, and by taking into ac-count the values for the parameters along different transects reported in Table 1 and calculated from CTD data collected during the summer campaign (August 1995), the character-istics of the modes can be found (Table 2). The first mode is the most relevant one, since the others are confined to very narrow areas near the coast, with space scales much smaller than the first radius of deformation (Gill and Clark, 1973). Moreover, this mode is the fastest one, even if the amplitude of its alongshore component is the smallest; it has a phase velocity cn along the coast of 2.03 m/s at transect B,
de-creasing to 1.52 m/s at transect E and 1.27 m/s at transect
H. Considering these velocities, it is possible to calculate
the time of arrival of the signal at the different sections; it has been imposed that the wave travels the distance between two transects with the mean phase speed between the two
11 13 15 17 19 21 23 25 27 29 31 2 4 6 8 10 12 14 16 18 20 22 24 25 0 5 10 15 20 25 cm/s Po current wind May 95 June 0 500 1000 1500 2000 2500 3000 3500 4000 m 3/s 2 4 6 8 10 m/s
Fig. 11. Comparison between Po River discharge, wind intensity and alongshore low-pass current at mooring B03.
Depth H1 Density ρ1 Interface displacement h Depth H2 Density ρ2 Depth H(y) z y = 0 y Surface elevation η HTOT H0 y = L H(y)=H0 e2λy
Fig. 12. Approximation of the across shore section used in the
cal-culation of the free coastal trapped modes.
transects. The delay with respect to the Po River discharge pulse is about 13 hours at B, about 43 hours at E and about 91 hours (i.e. less than 4 days) at H.
The ratio Bn of the sea level change across the shelf to
the thermocline displacement at the shelf edge, denoted by the letter h, permits an evaluation of the importance of the upwelling for each mode at the different transects. In Table 2, the values for the ratio Bnare given; it is evident that for
the first mode, the thermocline displacement increases mov-ing southward. For example, the first mode presents a Bnof
0.0159 at transect B that corresponds to a displacement of 0.6271 m of the thermocline for each centimeter of sea level change, while h is 3.5664 m at transect H. In the Adriatic Sea, the sea level change is typically on the order of a cen-timetre; therefore, the displacement of the thermocline is on the order of a meter.
Possible evidence of the passage of the hybrid waves gen-erated by the Po River pulses, manifested by the concomi-tant occurrence of the southward coastal jet and the tran-sient upwelling can be found both in the residual current data and in the vertical distribution of thermohaline prop-erties. Figure 10 shows the daily Po River discharge rate as a function of time for the period of the ADCP measure-ments. The Po run-off is characterized by a series of pulses with a duration of less than a week, which are several thou-sands of m3/s stronger than the average run-off (1500 m3/s),
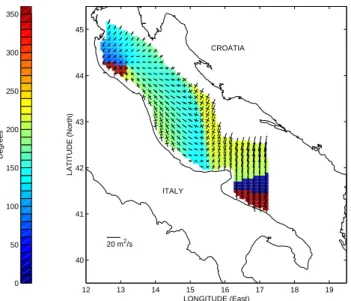
and which could be responsible for the generation of hybrid waves. During the stratified season, i.e. the one for which the above theory is valid, five pulses are present (denoted by numbers in Fig. 10). We try to find evidence of a possi-ble hybrid wave generated by these run-off pulses, travelling downstream from the Po River mouth. Since neither ADCP surveys nor CTD measurements at selected transects were carried out at regular time intervals, only in some cases do the ADCP and/or CTD measurements coincide with the ex-pected time of arrival of the hybrid wave, i.e. in the cases of the pulses denoted by (1), (2) and (5) in Fig. 10. In cor-respondence to the pulses (1) and (2), the ADCP data are available only at the transect south of the Gargano Promon-tory (not shown). In both cases, there are clear indications of the presence of a strong southward coastal jet which was not evidently generated by the local wind, since at the measure-ment time, the weather was calm in both cases. The pulse (5), occurring on 21–22 September, is the only one for which we have rather good evidence of the wave passage, both from ADCP and CTD data. A southward jet is present at the tran-sect B on 22 September (Fig. 13), i.e. at the time of the wave arrival and decreasing in strength the next day, as could be expected. Also, just the day before, for the Po River pulse occurrence on 21 September, no coastal jet is present at all at the transect 20 km to the north of B and at another tran-sect, 20 km to the south of it. The transient upwelling associ-ated with the passage of the hybrid wave can also clearly be seen from the vertical temperature distribution at the transect
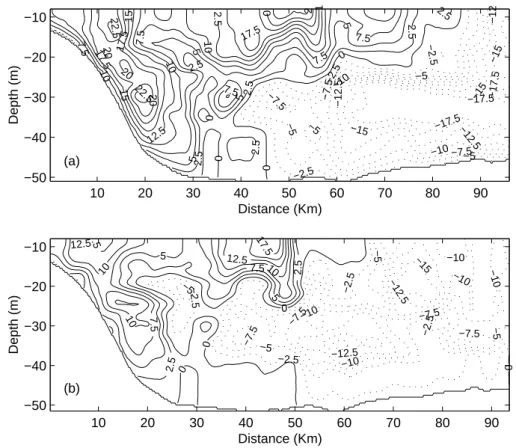
B on 22 and 23 September (Fig. 14). An upward slope of
the isotherms is evident at the expected time of the wave ar-rival on 22 September, and associated with the coastal jet, as shown by the ADCP data. On the other hand, the isotherms are much less inclined the next day, when the jet becomes weaker and when, presumably, the wave has passed by. In conclusion, from this analysis, it follows that the signal trav-els with velocities that are one order of magnitude greater than the flow field speed, and it is well approximated by hy-brid waves between shelf waves and internal Kelvin waves.
CTD data are used, together with ADCP results, in order to delimit with more accuracy the bottom outflow of dense wa-ter (Artegiani et al., 1989). In the steady part of the ADCP
10 20 30 40 50 60 70 80 90 −50 −40 −30 −20 −10 Distance (Km) Depth (m) −17.5 −17.5− 17.5 −15 −15 −15 − 12 − 12.5 −12.5 −10 −10 −7.5 −7.5 −7.5 −5 −5 −5 −5 −2.5 −2.5 − 2.5 0 0 0 0 2.5 2.5 2.5 2.5 2.5 2.5 5 5 5 5 7.5 7.5 7.5 7.5 7.5 10 10 10 12.5 2.5 15 15 1 17.5 17.5 17.5 0 20 20 20 2 22.5 22.5 10 20 30 40 50 60 70 80 90 −50 −40 −30 −20 −10 Distance (Km) Depth (m) −15 −12.5 −12.5 −10 −10 − 10 −10 −10 −7.5 −7.5 −7.5 −7.5 − 5 −5 − 5 −5 −2.5 −2.5 −2.5 − 2.5 0 0 0 0 2.5 2.5 5 5 7.5 7.5 10 10 10 12.5.5 12.5 17.5 (a) (b)
Fig. 13. Residual currents at transect B on 22 September (a) and on 23 September (b). The component of the current perpendicular to the
section is depicted. Positive values mean southward flow. No data are available in the layer from the surface to the 9 m depth.
0 10 20 30 40 50 60 70 80 90 100 −50 −40 −30 −20 −10 Distance (Km) Pressure (dbar) 14.6 14.8 14.6 20.2 20.2 20.4 20.4 20.6 20.6 20.8 20.8 21 21 21 21 21.2 21.2 15 15 16 16 17 17 18 18 19 19 20 20 21 21 21 21 B01 B02 B03 B04 B05 B06 B07 B08 B09 B10 B11 B12 0 10 20 30 40 50 60 70 80 90 100 −50 −40 −30 −20 −10 Distance (Km) Pressure (dbar) 14.8 20.2 20.2 20.4 20.4 20.6 20.6 20.6 20.8 20.8 20.8 20.8 21 21 21 21.2 15 15 16 16 17 17 18 18 19 19 20 20 21 21 21 B01 B02 B03 B04 B05 B06 B07 B08 B09 B10 B11 B12 a) b)
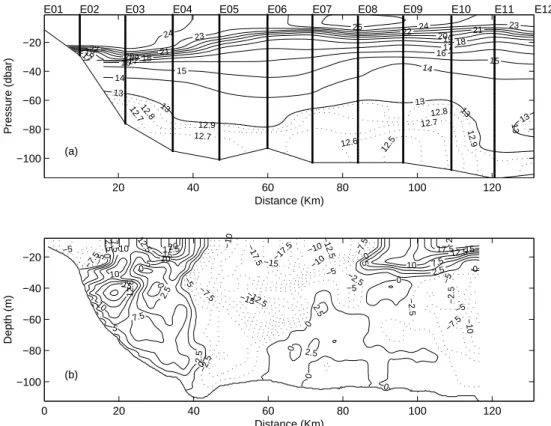
20 40 60 80 100 120 −100 −80 −60 −40 −20 Distance (Km) Pressure (dbar) 13 13 13 14 14 15 15 16 16 17 17 17 18 18 18 19 19 20 20 21 21 22 22 23 23 24 25 24 12.5 12.6 12.7 12.7 12.7 12.8 12.8 12.9 12.9 13 13 13
E01 E02 E03 E04 E05 E06 E07 E08 E09 E10 E11 E12
0 20 40 60 80 100 120 −100 −80 −60 −40 −20 Distance (Km) Depth (m) −17.5 −17.5 −15 −15−12.5 − 12.5 −10 −10 −10 − 10 −7.5 −7.5 −7.5 −7.5 −5 − 5 −5 −5 −5 −5 −5 −2.5 −2.5 − 2.5 −2.5 0 0 0 0 0 0 0 0 0 0 0 2.5 2.5 2.5 2.5 2.5 2.5 5 5 5 7.5 7.5 7.5 10 10 10 10 10 12.5 12.5 12.5 15 15 15 17.520 17.52 (a) (b)
Fig. 15. Temperature field (a) and residual currents (b) at transect E on 26 August 1995. The component of the current perpendicular to the
section is depicted. Positive values mean southward flow. No data are available in the layer from the surface to the 9 m depth.
current data (Ga˘ci´c et al., 1998), it is evident that the signal of the dense water flow is very weak at transect B (about 1–2 cm/s) and completely absent at transect E. On the contrary, the residual pattern frequently shows a strong southward flow in the bottom layer along the Italian shelf, in correspondence to a water mass with low temperature and salinity. An exam-ple of a perfect coherence between the vertical temperature distribution pattern and the residual field of the alongshore, current component in the bottom layer is shown in Fig. 15. A near-bottom core of the southward current is evident in the slope area about 30 km from the shoreline, corresponding to the local bottom temperature minimum, which is, in turn, as-sociated with the dense water formed during the preceding winter. A secondary core of the southward bottom current is located at about 80 km from the coast which again corre-sponds to another temperature minimum. In conclusion, it can be said that the outflow of dense water is only weakly evident in the steady current component, while its signal is clearly present in the residual current field, suggesting the prevalence of transients over a steady flow in the bottom density-driven current.
5 Conclusions
In this work, basin-wide ADCP data are analysed to study the general circulation of the Adriatic Sea. Data sets obtained within the PRISMA1 project during the period from 15 May
1995 to 28 February 1996 are used, together with parts of the moored current-meter data sets, where the spatial coverage of the ADCP data is insufficient. The horizontal and vertical resolutions of the ADCP data set, together with their tempo-ral extension, permit the study of some phenomena both on large and small spatial and temporal scales.
The ADCP data set is separately analysed for the stratified season and for the vertically homogeneous part of the year, i.e. the entire data set is subdivided into two subsets called summer and winter. The current field is separated into three time-dependent terms: the tidal one, calculated with Can-dela’s detiding method, the steady, and the residual parts.
Concerning the tidal flow, the M2 current pattern shows the expected amphidromic point south of the Gargano Promontory, characterized by a minimum in the amplitude and a discontinuity in the phase of about 200 degrees. The K1 presents an almost constant phase structure that increases in the north, from east to west during summer. The ellipses are generally polarized along the basin axis in summer, while in winter, they seem to follow more closely the coastline ori-entation.
The residual field shows a variable structure that depends on the Po River discharge impulses and the wind field. It is found that, during the stratified season, the influence of the Po discharge impulses on the coastal flow can be approxi-mated by hybrid waves between the shelf area and Kelvin
waves that propagate along the Italian coast. The
bathymetry and the stratification in the area. The calculated phase velocities have been found to be about 2 m/s in the northern part, decreasing to 1.27 m/s in the south. The pas-sage of the wave induces upwelling in the shelf along the Italian coast, as shown in the vertical temperature distribu-tions. In the ADCP data set, evidence of the transient inten-sification of the southward current can be associated with the passage of these waves.
ADCP data, together with CTD measurements, show that the Adriatic dense water formed in the northern part of the basin flows southward along the Italian shelf, and its signal is much stronger in the sub-inertial time-dependent component of the current field than in the steady current field.
Therefore, ADCP measurements enable us to conclude that the circulation features which have been traditionally considered quasi-steady structures, such as WAC and the bottom-density driven current, have a strong time-dependent component, and are variable on time scales on the order of days due to mesoscale variability and external forcing.
Acknowledgements. This work is part of the Italian national project
PRISMA1 financed by MURST (Ministero dell’Universit`a e della Ricerca Scientifica e Tecnologica). We express our thanks to N. Medeot, D. Deponte, T. Di Gaetano, L. Perini, I. Tomini and G. Spaggiari for their precious contribution in the field work and data pre-processing. R. Nair helped in editing the paper.
Topical Editor N. Pinardi thanks a Referee for his help in evalu-ating this paper.
References
Artegiani, A., Azzolini, R., and Salusti, E., On the dense water in the Adriatic Sea gen, Oceanologica Acta, 12, 151–160,1989. Artegiani, A., Bregant, D., Paschini, E., Pinardi, N., Raicich, F.,
and Russo, A., The Adriatic Sea general circulation. Part I: Air-sea interactions and water mass structure, J. Phys. Oceanogr., 27, 1492–1514, 1997.
Candela, J., Beardslay, R. C., and Limeburner, R., Separation of tidal and subtidal currents in ship-mounted Acoustic Doppler Current Profiler observations, J. Geoph. Res., 97, C1, 769–788, 1992.
Defant, A., Physical oceanography, Pergamon Press, London, vol. 2, 399–403, 1961.
Ga˘ci´c, M., Civitarese, G., and Ursella, L., Spatial and seasonal vari-ability of water and biogeochemical fluxes in the Adriatic Sea, The eastern Mediterranean as a Laboratory Basin for the Assess-ment of contrasting Ecosystems, (Eds) Malanotte-Rizzoli, P. and Eremeev, V. N., 335, Kluver Academic Publishers, 1998. Gill, A. E. and Clarke, J., Wind-induced upwelling, coastal currents
and sea-level changes. Deep-Sea Res., 21, 325–345, 1973. Hendershott, M. C. and Speranza, A., Co-oscillating tides in long,
narrow bays; the Taylor problem revisited, Deep-Sea Res., 18, 959–980, 1971.
Krajcar, V. and Orli´c, M., Seasonal variability of inertial oscillations in the northern Adriatic. Cont. Shelf Res., 15, 1221–1233, 1995. Lozano, J. and Candela, J., The M2 tide in the Mediterranean Sea: dynamic analysis and data assimilation, Oceanol. Acta, 18 (4), 419–441, 1995.
Mala˘ci˘c, V., Viezzoli, D., and Cushman-Roisin, B., Tidal dynamics in the northern Adriatic Sea, J. Geoph. Res., 105, C11, 26 265– 26 280, 2000.
Mosetti, R., Determination of the current structure of the M2 tidal component in the northern Adriatic by applying the rotary anal-ysis to the Taylor model, Boll. Oceanol. Teor. Appl., 4 (3), 165– 172, 1986.
Orli´c, M., Ga˘ci´c, M., and La Violette, P. E., The currents and circu-lation of the Adriatic Sea, Oceanol. Acta, 15 (2), 109–124, 1992. Polli, S., La propagazione delle maree nell’Adriatico, Atti del IX Convegno dell’ Associazione Geofisica Italiana, Roma 1959, also: Publ. Inst. Talassogr., 370, 11, 1960.
Sturm, B., Kuzmi´c, M., and Orli´c, M., An evaluation and interpre-tation of CZCS-derived patterns on the Adriatic shelf, Oceanol. Acta, 15 (1), 13–23, 1992.
Taylor, L., Tidal oscillations in gulfs and rectangular basins, Proc. London Math. Soc., 20, 93–204, 1921.
Thompson, R. O. R. Y., Low-pass filters to suppress inertial and tidal frequencies, J. Phys. Oceanogr., 13 (6), 1077–1083, 1983. Ursella, L., Accerboni, E., Ga˘ci´c, M., and Mosetti, R., Basin-wide
use of a ship-mounted ADCP gives a new picture of the Adriatic Sea circulation, 35thCIESM congress proceedings, vol. 35 (1),
202–203, 1998.
Ursella, L. and Ga˘ci´c, M., Studio della circolazione dell’Adriatico per mezzo di profilatore acustico ad effetto Doppler (ADCP), Atti del Workshop “Tecnologie marine: attualit`a e prospettive”, CNR-Istituto Talassografico di Trieste, 119–148, 1998. Zore-Armanda, M., Bone, M., Dadi´c, V., Morovi´c, M., Ratkovi´c,
D., Stojanoski, L., and Vukadin, I., Hydrographic properties of the Adriatic Sea in the period from 1971 through 1983, Acta Adriatica, 32, 6–544, 1991.


![[PDF] Fonctions Essentielles d’un Réseau Informatique | Cours informatique](data:image/gif;base64,R0lGODlhAQABAIAAAP///wAAACH5BAEAAAAALAAAAAABAAEAAAICRAEAOw==)