Denitrification as a Means of Addressing Nitrate-Contaminated Groundwater on Cape Cod, Massachusetts
by
Kenneth M. Motolenich-Salas B.S. Chemical Engineering University of Notre Dame
(1995)
ARCHINES
MASSACHUSETTS INSTITUTE OF TECHNOLOLGYJUL
02
2015
LIBRARIES
Submitted to the Department of Civil and Environmental Engineering in Partial Fulfillment of the Requirements for the Degree of
MASTER OF ENGINEERING In Civil and Environmental Engineering
at the
Massachusetts Institute of Technology June 1997
@Massachusetts Institute of Technology All rights reserved.
Signature of Author
Certified by
Accepted by
Signature redacted
Department of Civil and Environ ental Engineering 9 May 1997
Signature redacted
Harold F. Hemond Professor, Civil and Environmental Engineering
n Thesis Supervisor
Signature redacted
Joseph M. Sussman, Chairman Departmental Committee on Graduate Students
0
1 F
77 Massachusetts Avenue
Cambridge, MA 02139 http://Iibraries.mit.edu/ask
MITLibraries
DISCLAIMER NOTICE
Due to the condition of the original material, there are unavoidable flaws in this reproduction. We have made every effort possible to provide you with the best copy available.
Thank you.
The images contained in this document are of the best quality available.
Denitrification as a Means of Addressing Nitrate-Contaminated Groundwater on Cape Cod, Massachusetts
by
Kenneth M. Motolenich-Salas
Submitted to the Department of Civil and Environmental Engineering on 9 May 1997 in partial fulfillment of
the requirements for the Degree of
Master of Engineering in Civil and Environmental Engineering ABSTRACT
The residents of Cape Cod face a problem of nitrate contamination of their groundwater (their primary source of drinking water) and their coastal and aquatic environments. Groundwater is the only source of drinking water on Cape Cod and the aquifer is defined as a "sole source aquifer" by the Safe Drinking Water Act. While many activities contribute nitrate (NO3-) contamination to groundwater,
nitrate contamination from land application poses the greatest threat on Cape Cod. Only a few small areas on Cape Cod are sewered, and the majority of homes and businesses rely on septic systems. Increased urban development has increased the
frequency of installation of septic systems. In many locations, the density of septic systems is greater than the natural ability of the subsurface environment to receive and purify system effluents prior to their movement into groundwater. Many of Cape Cod's environmental resources, including coastal receiving waters, marine embayments threatened with eutrophication, endangered wetlands, and Areas of Critical Environmental Concern (ACECs), are also threatened by
nitrate-contaminated groundwater flowing into the coastal waters of Cape Cod, which are extremely sensitive to eutrophication from excess nitrogen loading.
In order to address nitrate-contaminated groundwater on Cape Cod, solutions based on biological denitrification should be considered. In this work, these
solutions are discussed and explored. First, the major sources of contamination and possible health and environmental effects are discussed. Second, the fate and
transport of nitrate in the subsurface environment is analyzed, with a detailed discussion of the factors governing biological denitrification. Third, the current status of groundwater nitrate contamination on Cape Cod is detailed. Fourth, possible options, alternative septic systems and in-situ remedial schemes, which all use biological denitrification as a means of attenuating nitrate in septic system effluent, are presented. Lastly, a proposal for action to deal with nitrate
contamination on Cape Cod and suggestions for future study and long-term action for domestic sewage are given, based on my opinion of the scientific and
engineering aspects of the circumstances of the contamination.
Thesis Superviosr: Harold F. Hemond
Acknowledgments
My time here at MIT has had its ups and downs. Throughout it all, I could rely on certain individuals and institutions to provide me with a kind word, good advice, a smile.
I would like to first thank the GEM (National Consortium for Graduate Degrees for Minorities in Engineering and Science), based at my alma mater; my sponsoring company, E.I. duPont de Nemours, Inc.; the Department of Civil and Environmental Engineering at MIT; the United States Navy; and the University of Notre Dame. GEM provided to me the opportunity to pursue a Master's degree in Environmental Engineering. E.I. duPont de Nemours gave me invaluable work experience, an undergraduate scholarship, and, through their benevolent giving, funding for graduate school. The Department of Civil and Environmental
Engineering, especially Cynthia Stewart and Pat Dixon, helped me through the tough Summer of 1996. The United States Navy has also provided me with
numerous opportunities, including a R.O.T.C. scholarship to Notre Dame, allowing me to enter the Navy debt free, and for granting me a leave of absence to pursue graduate studies immediately after my undergraduate years, so that I did not have a chance to forget all that I had learned. Lastly, I want to thank my beloved alma
mater, the University of Notre Dame, for educating me and being more than an
exemplary institution of higher learning: Notre Dame continues being a source of inspiration for me.
However, my true source of inspiration throughout my life is people whom I love. My mother and father, Peter and Nilda Motolenich, have always provided for me: financially, spiritually, emotionally, and always lovingly. Finally, I owe my happiness in life to the love of my life, my future wife, Anita Varma. Before she
came into my life, I was alone walking a journey with no definite destination. With Anita, I have a loving companion with whom I can share all the joys of life. It is to Anita, the woman I love and want to spend my life with, that I dedicate this thesis.
Table of Contents Page Abstract Acknowledgments 3 List of Tables 8 List of Figures 9 Chapter 1. Introduction 12
1.1 Scope of the Problem 12
1.2 Sources of Nitrate 15
1.3 Health and Environmental Effects 16
1.3.1 Health Effects 16
1.3.1(a) Methemoglobinemia 17
1.3.1(b) Gastric Cancer 17
1.3.1(c) Other Health Effects 18
1.3.1(d) Cancer on Cape Cod 18
1.3.2 Environmental Effects 19
1.3.2(a) Algal Blooms 20
1.3.2(b) Case Study: Waquoit Bay, MA 20
1.4 Conclusions 21
Chapter 2. Nitrate in Groundwater 22
2.1 Nitrate in Groundwater: Introduction 22
2.2 Nitrate Transport 24
2.2.1 Physical Processes 25
2.2.2 Sinks 27
2.3 Microbial Activity in Groundwater 28
2.4 Biological Denitrification 29
2.4.1 Conditions Needed for Denitrification 2.4.1(a) Oxygen
2.4.1(b) Microorganisms and Organic Carbon (OC)
2.4.1(c) Nutrients, Temperature, and pH
2.4.1(d) Redox Potential (EH) 2.4.1(e) Depth in Aquifer 2.4.1(f) Depth of Aquifer
2.4.1(g) Losses of Nitrate in the Unsaturated Vadose Zone 2.5 Denitrification Rates in Groundwater Environments
2.6 Conclusion
Nitrate Contamination on Cape Cod
3.1 Introduction
3.2 Cape Cod Nitrate Contamination 3.3 Use of Septic Systems
3.4 Nitrate from Septic Systems
3.5 Groundwater on Cape Cod
3.6 Effects of Nitrate on Water and Environmental Quality on Cape Cod 3.6.1 Water Quality
3.6.2 Environmental Quality
3.6.2(a) Wetlands
3.6.2(b) Areas of Critical Environmental Concern 3.7 Urbanization and Nitrate Contamination
3.8 Conclusion
Remediation Technology
4.1 Introduction: Motivation for Addressing Nitrate Contamination 4.2 Title V
4.3 Zones of Groundwater Protection
6 Chapter 3.
4.4 Environmental Motivation for Action 4.5 Remediation Technology
4.5.1 Permitted Alternative Septic Systems 4.5.1(a) The RUCK System
4.5.1(b) The FAST System
4.5.1(c) Ekofinn BioclereTM
4.5.1(d) Recirculating Sand Filter (RSF)
4.5.1(e) Sequencing Batch Reactors (SBR)
4.6 In-Situ Treatments
4.6.1(a) Daisy System
4.6.1(b) Peat
4.6.1(c) Reactive Porous Media Barriers
4.6.1(d) Bioremediation via Autotrophic, Hydrogen-Oxidizing, Denitrifiers on Cape Cod
4.6.1(e) Sulfur/Limestone Denitrification 4.7 Conclusion
What Should Be Done For Cape Cod's Nitrate Contamin
5.1 Introduction
5.2 Immediate Action for Domestic Sewage Disposal 5.2.1 Homes Near the Coast
5.2.2 Large Cluster of Homes
5.2.3 Other Domestic Sewage
5.3 Large-Scale Contamination Remedial Action
5.4 Conclusion: Future Work and Long Term Action for Domestic Sewage Disposal
ation? References 7 Chapter 5. 76 78 80 84 88 90 93 95 96 97 100 104 106 111 112 113 113 114 115 117 118 118 120 127
List of Tables
Page Table 1: Microbial Growth Requirements in Subsurface Environments 28 Table 2: Field Estimates of Denitrification Rates in Aquifers 40 Table 3: Towns on Cape Cod and Percentage of Homes with Sewer Connections 57 Table 4: Physical Properties and Constituents in Cape Cod's Groundwater 62
Table 5: Major Wetlands on Cape Cod 65
Table 6: Waste Water Loading Credits For Four Alternative Septic Systems 83 Table 7: Effluent from Porter's Orchard Partnership 87 Table 8: Denitrification Efficiencies for the Ekofinn BioclereTM Septic System 92 Table 9: Summary of Construction Details for Experimental Peat Filter Bed 103 Table 10: Treatment of Septic Tank Effluent by Sphagnum Peat Filter Beds 103
List of Figures
Page
Figure 1: Sources and Pathways of Nitrogen in the Subsurface Environment 23 Figure 2: Movement of Fertilizer Nitrate Through Sandy Loam Soil 26 Figure 3: Oxidation of Organic Carbon in the Saturated Zone with the
Sequence of Electron Acceptors and the Resulting Reduced
Inorganic Compounds 32
Figure 4: Stability Diagram of Nitrogen Species Showing the Predicted Species
of Most Groundwater at 25 'C and 1 atm 39
Figure 5: Nitrous Oxide Production by Slurried Core Material at 1.5 m
Beneath the Water Table versus Time 42
Figure 6: Vertical Profile of Rates of Denitrification for Slurried Core Material 42 Figure 7: Time Course of Nitrous Oxide Production by Core Samples and
Well Water Samples from Two Depths 43
Figure 8: Frequency Distributions of Denitrification .Rates Measured in
Sediment Cores 44
Figure 9: Vertical Profiles of Denitrification Rates, Dissolved Oxygen, Nitrate-Nitrogen, and Dissolved Organic Carbon Measured in Sediment
Cores 45
Figure 10: Nitrous Oxide Production in Sediment Slurries with Nitrate and
Carbon Addition 47
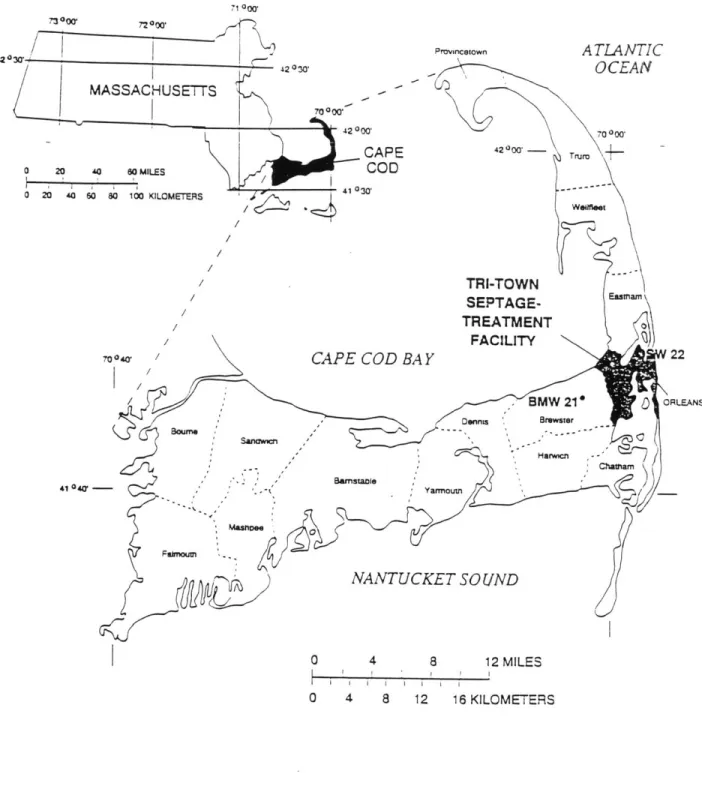
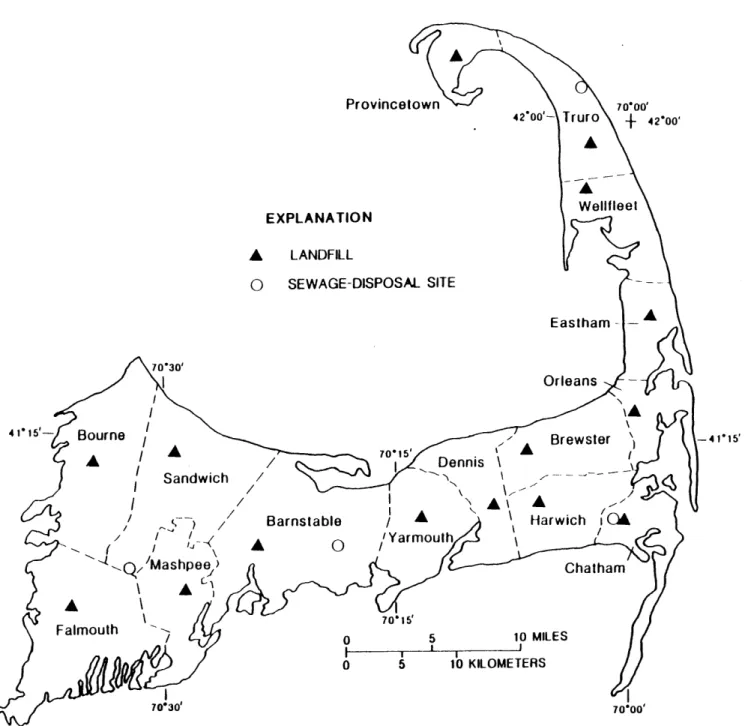
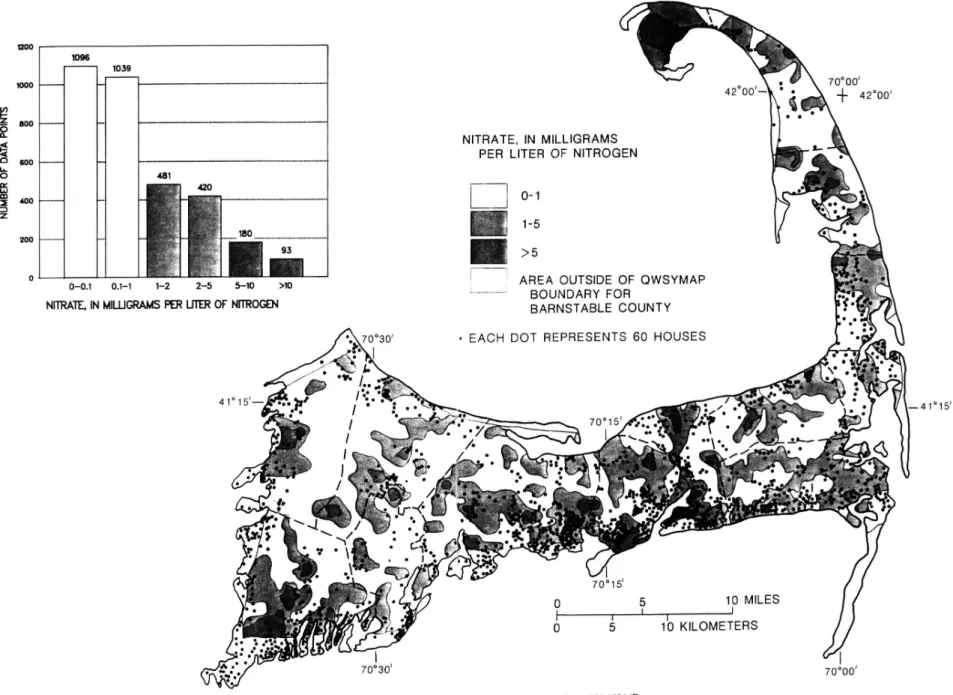
Figure 11: Political Map of Cape Cod, Massachusetts 49 Figure 12: Landfills and Sewage-Disposal Sites on Cape Cod 50 Figure 13: Nitrate Concentrations and the Frequency Distribution on Cape
Cod, 1980-1984 53
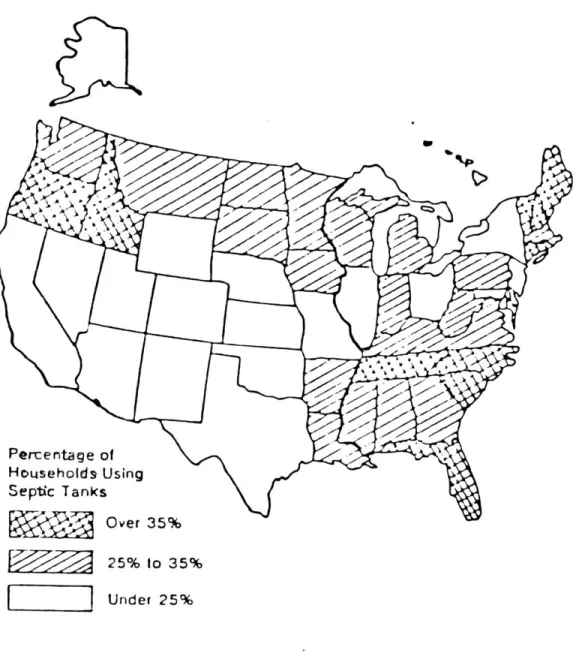
Figure 14: Approximate Populations Using Septic Tanks 55 Figure 15: Schematic Cross-Section through a Conventional Septic Tank Soil
Disposal System for On-Site Disposal and Treatment of Domestic
Figure 16: Figure Figure Figure 17: 18: 19: Figure 20: Figure 21: Figure 22: Figure 23: Figure 24: Figure 25: Figure 26: Figure 27: Figure 28: Figure 29: Figure 30: Figure 31: Figure 32: Figure 33: Figure 34:
(a) Schematic Cross Section of a Conventional Septic System,
Including Septic Tank, Distribution Pipe, and Groundwater Plume (b) Sequence of Simplified Redox Reactions in the Two Major Zones of a Conventional Septic System: the Septic Tank and the Drain Field
Cape Cod Regional ACEC Locus Map
Changes in Eelgrass Distribution in Waquoit Bay, 1951-1987
Growth in Housing Units in Massachusetts Counties, 1980-1990 in Relation to Distance From the Sea
Nitrate Concentrations in Groundwater Below Areas of Cape Cod Having Different Densities of Buildings
Housing Density on Cape Cod, 1985
Median Nitrate Concentration as a Function of Housing Density Median Nitrate Concentration as a Function of Building Density Recharge Areas to a Pumped Well in a Valley-Fill Aquifer
Ocean Sanctuaries of Massachusetts
Alternative Onsite Septic Systems Installed to Date in Barnstable County: Estimates as of August, 1996
RUCK System
Smith and Loveless Single Home FAST System Sectional View of BioclereTM Components
Final Effluent Nitrogen Component Concentrations
Principal Components of a Recirculating Sand Filter System Schematic Description of In-Situ Denitrification
Schematic Description of the Daisy System
Schematic Diagram of System One and Two Peat Filter Beds
56 66 68 69 69 70 72 72 77 79 82 86 89 91 91 94 98 98 102
Figure 35:
Figure 36:
Figure 37:
Killarney and Borden (Horizontal) Denitrification Layers Showing Chemical Profiles (mg/L) After One Year of Operation
Long Point (Vertical) Denitrification Wall with Chemical Levels Up- and Downgradient of the Wall
Time Course of Nitrate Concentration (mM) in Sediment Slurries
107
108 110
Chapter 1
Introduction
1.1 Scope of the Problem
Groundwater is a vital resource. Over 50% of drinking water in the U.S. is supplied by groundwater and is the source of drinking water in 95% of rural farm areas (Follett, 1989). In Massachusetts, groundwater consists of 22% of public
drinking water supplies and 97% in rural areas (Persky, 1986). Groundwater is the only source of drinking water on Cape Cod.
Many activities of modern society contribute nitrate (NO3-) contamination to groundwater. Nitrates are mobile in soil and will often present a potential threat to groundwater whenever they are used as a fertilizer or when nitrogen is discharged onto land surfaces by septic tanks or under feedlots. Wells and groundwater
exhibiting nitrate contamination have been noted in every state in the USA (Follett, 1989). Nielsen and Lee (1986) from the U.S. Department of Agriculture's Economic Research Service noted that wells with greater than 3 mg/L occurred in 29% of all the counties in the U.S.A. Nitrate is the most frequently reported health-related contaminant in the world's groundwater systems (Spalding and Parrott, 1994).
Nitrate is also an environmental contaminant of concern. Groundwater contributes to the nitrate contamination of surface waters through base-flows to streams and lakes. In coastal zones from Cape Cod to Texas, groundwater conveys land-derived nitrogen to receiving waters (Valiela and D'Elia, 1992). High nitrate concentrations in groundwater could cause a serious environmental quality problem.
The conventional septic tank-soil absorption system is the most convenient and economical method for home sewage disposal. Increased development of
housing and mobile home parks in rural areas and in small towns without
domestic waste treatment plants has increased the frequency of installation of septic systems for sewage treatment and disposal. Groundwater degradation has occurred in many areas having high densities of septic systems, including Cape Cod, with the degradation exemplified by high concentrations of nitrates, bacteria, and other contaminants. Septic system problems are magnified by the fact that in many areas, a substantial reliance on subsurface disposal systems is paralleled by a reliance on private wells for drinking water supplies. Hence, nitrate from septic system effluent can have a detrimental effect on health by contaminating the drinking water supply and the environment by groundwater flow to surface waters.
Water quality problems may occur when the amount of nitrogen released from septic systems exceed health and ecological limits of water resources. While nitrogen from one septic system may not be a problem, a concentration of septic systems in a resource area may threaten water quality by exceeding safe limits. What is even more critical for Cape Cod is the extreme sensitivity of marine recharge areas to excess nitrogen loading. A marine embayment is very sensitive to nitrogen
loading, depending on the shape and depth of the embayment. Its nitrogen limit can be exceeded at a housing density as low as one house per three acres in its water shed or marine water recharge area (Cape Cod Commission, 1996).
Nitrate in groundwater is subject both to reactions within aquifer systems and to effects from surface land use and reactions within the unsaturated zone above the aquifer (Follett, 1989). Biological denitrification is important in many aquifers for removing nitrate. The rate of denitrification is governed by redox conditions, the existence of denitrifier populations, and available carbon. Increased dissolved organic carbon (DOC) in a contaminated aquifer would probably increase
from microbial activity, could be used as a remediation approach to nitrate-contaminated groundwater.
There is a possibility that the rates of denitrification in aquifers may be greater than previously estimated. A number of studies conclude that rates of
denitrification may be relatively high in groundwater, based on three lines of evidence:
Larger than expected concentrations of dissolved organic matter: Concentrations of labile organic matter in groundwater (0.7-27 mg DOC/L, Fiebig et al., 1990) may be greater than was thought to occur. Such concentrations make denitrification more likely in groundwaters than in unsaturated zones, because the carbon might support microbial activity which would result in lower oxygen concentrations.
* Downgradient lowering of nitrogen concentrations: Correlational evidence that nitrate losses occur downgradient (in waste water or fertilizer plumes) has been obtained by examining distributions of
solutes (Trudell et al., 1986; Smith and Duff, 1988; Robertson et al., 1991). In a sand and gravel aquifer on Cape Cod, denitrification is the predominant nitrate-reducing mechanism within the aquifer (Smith and Duff, 1988).
* Tracer experiments: Experimental injections of nitrate into aquifers showed that nitrate disappeared downgradient faster than expected based on dilution of a conservative tracer (bromide, Br-). Further,
nitrate consumption was matched by increases in bicarbonate (HCO3) and decreases in dissolved oxygen (02), as expected from carbon mineralization attributable to denitrification (Trudell et al., 1986). One could thus use denitrification as a possible means of addressing nitrate contamination in groundwater on Cape Cod.
It should be noted that many researchers report nitrate concentrations either as nitrate or as nitrate-nitrogen (N03-N). The drinking water standard, to which I
will be referring later, is an example of the latter. To clarify, the drinking water standard is
10 mg N03--N/L (nitrate as nitrogen) = 44.3 mg N03~/L (nitrate)
It is necessary to establish a framework by which to investigate possible remediation technologies and/or management options for groundwater
contamination. One must answer the following questions initially in order to understand the motivation for addressing contamination:
1) What are the major sources of contamination? 2) What are the possible health effects?
3) What are the possible environmental effects?
I will answer these questions in this chapter, with reference to the sources and environmental and health effects specific to Cape Cod and its residents.
1.2 Sources of Nitrate
Nitrate occurs naturally in the environment at low concentrations; around 0.05 mg/L from the decay of vegetation and the infiltration of nitrogen-laden precipitation (Frimpter et al., 1990). Nitrate in groundwater can also arise from
deposits laid down during geologic times (Boyce, 1976). Concentrations of N03~-N greater than 0.5 mg/L probably reflect anthropogenic inputs. Anthropogenic sources of nitrate that contribute to groundwater quality problems include typical point sources, such as sites related to the disposal of human and animal sewage, in particular areas with a high-density of individual septic systems; industrial sites, related to food processing, including dairy and poultry feedlots; munitions, or some polyresin facilities; and sites where handling and accidental spills of nitrogenous materials may accumulate (Vomocil, 1987). A long-range source is atmospheric deposition. On Cape Cod, the major source is from domestic septic systems.
1.3 Health and Environmental Effects
Increased attention nationwide on nitrate as a contaminant has been prompted by health and environmental studies and an increasing number of
groundwater sources experiencing contamination. For example, the
Commonwealth of Massachusetts Department of Environmental Protection has set a planning goal of 5 mg N03--N/L, which is one-half of the federally mandated
drinking water standard for nitrate. The Commonwealth of Massachusetts has adopted this as a goal since a consistent background concentration of 5 mg N03--N/L
has been shown to correlate to isolated exceedances of the drinking water standard. The planning guideline must be met for Zone II (hydrogeologically defined
wellhead protection areas for public supply wells) as described in the Massachusetts Water Supply Regulations 310 CMR 22.21(2)(d). However, concentrations of N03
--N 10 to 100 times less than the drinking water standard can cause adverse environmental effects (Geist, personal communication).
1.3.1 Health Effects
The importance of groundwater is illustrated by data which shows that
groundwater is the source of drinking water for about half of the population and for about 85% of the rural population (CAST, 1985). Cape Cod depends almost entirely on groundwater for its drinking water, making it necessary to ensure the protection of supplies from present and future contamination. Nitrate is one of the primary contaminants of concern. Nitrate poses a health hazard. Public health standards for nitrate in public drinking water supplies have been set at 10 mg N03-N/L. Concern
arises when nitrate accumulates in groundwater because, when ingested in high enough amounts by humans and animals, potential adverse health effects may
occur. These health effects are reported to include methemoglobinemia, cancer, and possibly others.
1.3.1(a) Methemoglobinemia
Ingestion of water exceeding the nitrate standard has been shown to cause varying levels of methemoglobinemia (also known as blue baby syndrome) and sometimes death in infants younger than six months. Methemoglobinemia results when ingested nitrate is converted to nitrite (NO2-) in the oral cavity and the
stomach. The nitrite is absorbed through the intestinal wall and combines with hemoglobin in the blood, making it incapable of absorbing and transporting oxygen. The blood is then unable to transport oxygen, which results in the infant's death due to oxygen starvation. The public health standard of 10 mg N03--N/L was chosen because it was the concentration below which no cases of infant
methemoglobinemia had been identified (Walton, 1941). Adults are immune to this condition because they have developed bacteria in their intestines which prevent the absorption of the nitrite.
1.3.1(b) Gastric Cancer
An association between nitrate intake and gastric cancer mortality has been suggested by Fine (1982) based upon the correlation of stomach cancer mortality rates against previously published data on daily nitrate intake in different countries
(r=0.88). Both for healthy individuals and for special risk groups, the possible correlation between nitrate and nitrite intake and stomach cancer is based upon intake of possible exogenous sources as well as endogenous formation of
carcinogenic nitrosamines. It has been proposed that nitrate in drinking water could, under certain conditions, react with compounds in foods to form
nitrosamines. Nitrate can be transformed in the gastrointestinal tract to nitrite, which, in the presence of secondary or tertiary amines (R-NH2, with R an organic
moiety), to form nitrosamines:
N03- -+ gastrointestinal tract -+ N02- + Tertiary/Secondary R-NH2 -+ nitrosamines
However, it is presently impossible to make a scientifically reliable estimate of the risk of human cancer posed by exposure to nitrate in drinking water and the possible formation of nitrosamines.
1.3.1(c) Other Health Effects
Other studies (Scragg, et al., 1982) have shown a positive correlation between nitrate in groundwater supplies and birth defects. Cattle which were fed high nitrate levels exhibited inhibited growth, shortening of life spans, increased abortion rates, and reproductive difficulties. Although it has not been proven that the nitrate is the cause of the malformations, the association with elevated nitrate in drinking water has been proven. Also, high nitrate levels indicate that the water supply is intercepting septic system leachate and may be contaminated with other harmful chemicals contained in waste water. About half of the waterborne disease outbreaks in the United States are related to contaminated groundwater; septic systems are the most frequently reported cause of this contamination (Yates, 1985).
1.3.1(d) Cancer on Cape Cod
On Cape Cod, Federal and State health officials have reported an increased incidence of certain cancers, other illnesses, and symptoms (Cape Cod Times,
January 8, 1997). The Department of Public Health of Massachusetts feels that there is an association between environmental factors and cancer incidence on Cape Cod.
5,654 Upper Cape residents from Bourne to Barnstable reported having cancer from 1982 to 1990 compared with the 4,543 cases expected. That represents 24% higher rates than the state average, and Massachusetts has the twelfth highest cancer rate in the country (Cape Cod Times, January 8, 1997). It has not been conclusively shown that the elevated rates of cancer are the result of increased exposure to waste water in the drinking water, of which nitrate can be used to detect. However, when the effect at issue is a serious and irreversible one such as cancer, even a largely
speculative risk may be seen as justification for some policy action. In this case, the soundest way to reduce the potential risk of cancer is to reduce exposures to waste water and, since nitrate can serve as an indicator of waste water presence, reduce
exposure to nitrate.
1.3.2 Environmental Effects
Coastal and estuarine water are the most nutrient-enriched ecosystems on earth (Valiela et al., 1992). The principal alteration of coastal and estuarine
ecosystems today is eutrophication brought about by increased nitrogen loads derived from human activities on land (National Academy of Sciences, 1994) and transported by freshwater to coastal waters (Cole et al., 1993). Nitrogen transport rates are of critical importance because rates of coastal production, as well as many other key processes coupled to production, are set by nitrogen supply (Nixon et al., 1996). Nitrate, a plant nutrient, is often assumed to be the limiting nutrient for phytoplankton activity in marine systems, which could contribute to eutrophication
(a pervasive problem along the east coast of the U.S.) in estuarine environments (Nixon and Pilsen, 1983). A marine embayment is very sensitive to nitrogen loading, depending on the shape and depth of the embayment. Its nitrogen limit
can be exceeded at a housing density as low as one house per three acres in its water shed or marine water recharge area (Cape Cod Commission, 1996). Nutrient
loading has led to increased abundance of algae and plants, reduced oxygen content of water, decimated shell and finfish, and many other changes in structure and function of aquatic communities.
1.3.2(a) Algal Blooms
Today the health of large marine ecosystems- their diversity, productivity, and resilience- is threatened by coastal algal blooms. Algal blooms (red, green, golden, brown, bioluminescent), covering vast expanses of marine, estuarine, and inland water have now been described from points as diverse as California, North Carolina, Guatemala, Iceland, Japan, Thailand, and the Tasman Sea. This increase in blooms is a direct consequence of human activities. The major anthropogenic influences are pollution, over-harvesting of shellfish and finfish, and loss of
wetland habitats. Excess nutrients from sewage and fertilizer effluents is a primary cause of marine eutrophication. Algal blooms have been linked to cholera
outbreaks (Epstein et al., 1993), which seriously threaten both the environment and pubic health. The degradation of marine ecosystems increases the risk of diseases emerging. Changes along coastlines contribute to pubic health hazards and can cause hpyoxia in the breeding grounds of marine animals and plants.
1.3.2(b) Case Study: Waquoit Bay, MA
Waquoit Bay is a shallow bay on Cape Cod which exhibits symptoms of eutrophication, largely attributed to septic nitrogen inputs. Valiela et al. (1992) found that groundwater is the major mechanism that transports nutrients to
Waquoit's coastal waters. Nitrogen delivered to the watershed surface can be taken up by vegetation, be denitrified in the soil, or percolate through soil. On Cape Cod, domestic waste water from septic tanks provides more nitrogen than precipitation
(atmospheric deposition) or use of fertilizers. The waste water releases nitrogen deep in the subsoil, which eventually enters the aquifer. The groundwater seeps or flows through the sediment-water boundary and sufficient groundwater-borne nutrients, nitrogen in particular, traverse the boundary to cause significant changes in the aquatic ecosystem. These loading-dependent alterations include increased nutrients in water, greater primary production by phytoplankton, and increased macroalgal biomass and growth. For example, Valiela noted that even small increases in nitrogen loads markedly decrease eelgrass cover area and leads to
increased biomass and productivity of benthic seaweeds. Macroalgal photosynthesis largely controls oxygen supply in bottom waters and the more nitrogen loading, the greater the fluctuations of oxygen concentrations, with increased frequency of
hypoxia within the bay and its estuaries (D'Avanzo and Kremer, 1994). Thus, nitrate contamination in groundwater can adversely affect ambient aquatic
ecosystems. I will be referring to Waquoit Bay throughout this thesis to highlight the environmental impacts of nitrate on Cape Cod.
1.4 Conclusion
In Chapter 1, I established a framework by which to investigate possible remedial efforts for groundwater contamination by citing the major sources of nitrate contamination and the health and environmental effects of nitrate.
Cognizant of this information, I now address the fate and transport of nitrate in the subsurface environment.
Chapter 2
Nitrate in Groundwater
2.1 Nitrate in Groundwater: Introduction
Nitrogen is ubiquitous in the natural environment and its conversion to nitrate is part of the natural functioning of any ecosystem. Nitrogen is an essential nutrient for plant and animal growth. In the natural environment, nitrogen is cycled through plants and animals in a complex of series of biological and chemical processes. Figure 1 is a summary of the sources, sinks and pathways that are
integrated into the nitrogen cycle into the subsurface environment.
Nitrate can be discharged directly from septic system soil absorption drainage tiles into the subsurface environment. It can also form in the soil by nitrification of other nitrogen compounds, such as ammonium (NH4+). Nitrates can reach
groundwater from a variety of sources. Nitrogen is a primary component of inorganic and organic fertilizers (Scarsbrook, 1965), transforms rapidly to nitrate under normal soil conditions (Alexander, 1965), and is primarily transported in the water infiltrating the soil (groundwater), not the water moving over it (runoff, or surface water).
The widespread appearance of nitrates in groundwater is a consequence of a number of factors. The nitrate ion is negatively charged; consequently, it is repelled rather than attracted to negatively-charged clay mineral surfaces. This is contrasted with the ammonium ion which, in groundwater, adsorbs to aquifer solids that have a significant cation exchange capacity (CEC). Thus, nitrate is very mobile in most soils, and is easily displaced from its point of origin by water additions. It is stable in
Precioitation
Plant residue, compost Organic -N
proteins
NZ Nitrif icationecm ston N 4
(N
rfiaonPrens (Denitrif ca i nNHD n rfia=
-Asr7
n (Adsorption) NIO NO~ L e ach *ng GroundwaTer Nitrogen Fi xa3t io n Plant proteins I7NK I7 Decomposition NHI N03)
Ni 4 Denitrification Nitrification NO-1N1O1
N03
Denitrification in reducing zones}
Figure 1: Sources and Pathways of Nitrogen in the Subsurface Environment (From Freeze and Cherry,
NH3 NO~ NH3 NO~ Sewage Organic-N NH3 Mineral fertilizer N H-3 NO N2 FN 2 NH3 N2 a 0
transformed by denitrification, which only occurs in very wet soil or inside of soil aggregates at high moisture content (Broadbent, 1973). Although nitrate is taken up rapidly by plant roots, this removal mechanism only occurs near the surface in a region known as the soil root zone. Thus, wherever there is a source of nitrogen
and an excess of water applied to the soil, nitrates have the potential to reach groundwater. Since two of the major sources of nitrogen addition to soil, irrigated agriculture and septic tanks, are also sources of excess water, it is easy to see why these operations have been associated with nitrate pollution.
If one wishes to use a specific (bio)chemical transformation of a chemical compound in order to address its contamination, one must investigate the phenomena which affect the transport and transformation of that chemical compound. In this chapter, I will present biological denitrification of nitrate to gaseous nitrogen species, which has been suggested as a means of addressing nitrate-contaminated groundwater. I will do this in the context of fate and transport of nitrate in groundwater. Again, I will address denitrification and nitrate fate and transport in groundwater with respect to the specific case at hand: nitrate
contamination of groundwater on Cape Cod.
2.2 Nitrate Transport
In general, delivery of nitrate to groundwater is via vertically percolating recharge and typically exceeds the denitrification potential of aquifer material. Nitrate can move with groundwater flow with minimal transformation. It can migrate long distances from input areas if there are highly permeable subsurface materials which contain dissolved oxygen. Movement of any dissolved ion such as nitrate through soil is governed by two mechanisms: convection of the chemical with moving soil solution and diffusion of the chemical within the solution. The
amount of nitrate found at a point of groundwater is a function of physical and (bio)chemical factors.
Nitrate concentrations can be modified by physical processes which do not change the total mass of nitrate but which change the concentration in solution. Nitrate can be removed permanently or temporarily from aquifers by (bio)chemical
conversion and a decline in the redox potential of the groundwater to other forms of nitrogen.
2.2.1 Physical Processes
Recharge of water with lower nitrate concentration causes dilution. Other physical processes which can modify nitrate concentrations in aquifers are advection (transport by motion of the flowing groundwater), diffusion (movement of nitrate from areas of high to low concentration), and dispersion (mixing caused by
microscopic differences in flow rate through porous media). Figure 2 shows the movement of nitrate fertilizer through a sandy loam soil. Nitrate will have an increasingly broad concentration peak as it moves with water through a soil. This spreading is caused by diffusion and hydrodynamic dispersion. The peak moved downward with time and gradually became less sharply defined as a result of diffusion and dispersion. Movement into less permeable areas or carbon-rich
portions of the aquifer can promote nitrate reduction through denitrification, which is discussed later.
Although these physical processes can modify nitrate concentrations in homogeneous aquifer systems, their effects can be small compared to dilution
caused by heterogeneities in aquifer flow patterns, storage, recharge, and discharge. For example, in settings such as sand and gravel aquifers (Cape
0.0 0.2 0.4 15 30 45 60 75 90 105 120 135 150 DAY
NITRATE-N BULK DENSITY
0.6 0.8 1.0 0.0 0.2 0.4 0.6 0.8
3
15- 30- 45-60 75 90 - 105 - 1 - 120 - 1 - 135 - 1: 150 ' DAY2 (g/m2 /cm) 0.0 0.2 0.4 15 30-75- - 0- 35-20- -50 DAY 3 0.0 0.2 0.4 15 -30- -45 60- 75-90- -105- - 120-135 -150 DAY 4Figure 2: Movement of Fertilizer Nitrate Through Sandy Loam Soil (From National Academy of Sciences, 1978)
26
a. Uj
Cod) and fractured bedrock, low dispersion often maintain high nitrate
concentrations for considerable travel distances (Wilhelm et al., 1994). Today, the effect of dilution on nitrate concentration is coming under criticism. In the past, many researchers thought that dilution was a major source of nitrate attenuation. However, tracer tests have now demonstrated that hydrodynamic dispersion in most sand aquifers is much less than previously thought and the dilution models which are commonly used to attenuate nitrate from septic systems are probably
physically unrealistic (Robertson and Cherry, 1995).
The nitrate mass balance equation may be written as d/dt (C) + on = d/dz
Js
Il} where:9 = soil moisture content
C = mass of nitrate per unit volume fluid
On= a term describing the net disappearance of nitrate mass per volume per unit time from (bio)chemical transformation (a sink term)
Js = nitrate mass flux in mass of nitrate per area per unit time
Js
is the sum of convective and diffusive mass fluxes:Js = -F(6)Dsw dC/dz + uwC {2}
where:
E(O) = tortuosity factor as a function of soil moisture content
Dsw = effective diffusion and dispersion coefficient, area per unit time uw = water velocity, length per unit time
2.2.2 Sinks
It is desirable to identify and evaluate any potential nitrate sinks within the groundwater regime that may be acting to protect water supplies from
contamination. Below the root zone, there are four possible "fates" (other than continued leaching) for nitrate: (1) soil retention, (2) assimilatory reduction into
microbial biomass, (3) dissimilatory nitrate reduction to ammonium (DNRA), and (4) denitrification. Only the latter may serve as a major nitrogen sink since the others only temporarily immobilize nitrogen.
2.3 Microbial Activity in Groundwater
Microorganisms are key factors that control the chemistry of groundwater. Microbial populations can have profound effects on the transport and fate of both naturally-occurring and contaminant solutes (Smith et al., 1996). In general, except for heavily contaminated situations, groundwater microbial processes proceed at rates that are slower than the rate of groundwater flow; that is, many solutes are transported faster than they are transformed. This is due to the nutrient and energy-poor nature of the groundwater environment.
Nitrogen transformations by groundwater microorganisms largely depend on redox conditions in the aquifer (Smith et al., 1976). Microbial activity can reduce the redox potential by oxidizing potential electron donors. It is well established that substantial microbial populations do exist naturally in many groundwaters. Britton and Gerba (1984) summarized microbial growth requirements in the subsurface environment:
Carbon E Mode of Other Ele Electron
Table 1: Microbial Growth Requirements In Subsurface Environments
Parameter Comments
ources Inorganic: Carbonates and bicarbonates Organic: Humic substances and waste water organics
Utilization of Organics Secondary substrates
ments N, P, S, Na, Ca, Mg may be present in sufficient quantities to allow growth
Elements 02: absent in most deep aquifers
Other Electron Acceptors: NO3- and SO42 -Source: Britton and Gerba, 1984.
Specially adapted organisms, such as those which can use electron acceptors other than oxygen, are able to proliferate in the subsurface environment. Due to relatively low substrate concentrations and high specific surface areas, bacteria which form biofilms on the surface of solid particles predominate in groundwater
(McCarty et al., 1984) although most bacteria may remain in solution in sand aquifers, like those located on Cape Cod (Matthes, 1985).
2.4 Biological Denitrification
Biological denitrification is the only permanent sink for nitrate and the major pathway by which nitrogen is returned to the atmosphere as gaseous nitrogen
(dinitrogen, N2, and nitrous oxide, N20). Biological denitrification is a respiratory
process whereby nitrate is utilized as the terminal electron acceptor in lieu of oxygen by bacteria which are mainly aerobes (Knowles, 1982). Nitrate is reduced to gaseous nitrogen and an electron donor, usually organic carbon, is oxidized. The
denitrifying bacteria are capable of normal respiratory growth in the presence of oxygen. However, under microaerobic and anaerobic conditions they use nitrate, nitrite, or nitrous oxide as the terminal electron acceptors.
The reduction of nitrate to nitrogen involves several specific biochemical sequences (the oxidation state of nitrogen in each molecule is shown above it in parentheses):
(+5) (+3) (+2) (+1) (0)
N0
3 -> N02- -+ NO -> N20
-+ N2Many bacteria are able to perform only one or two of these. Thus, the denitrifying microflora must be considered as a group of complimentary microorganisms able to carry out the conversion of nitrate to dinitrogen in its entirety.
The following discussion of the factors needed for biological denitrification refers to heterotrophic denitrification. However, Thurman (1985) stated that the majority of all groundwaters have dissolved organic carbon (DOC) < 2 mg/L. Thus, in the absence of DOC, large amounts of denitrification are often only possible in aquifers with large quantities of reduced inorganic compounds or solid labile OC in the porous matrix. Thus, with low DOC and high inorganic carbon, autotrophic (inorganic carbon as energy source) denitrification is possible. The potential for autotrophic denitrification is discussed later in Chapter 4 and 5.
2.4.1 Conditions Needed for Denitrification
Biological denitrification rates are controlled by redox conditions, available carbon, denitrifier populations, and other environmental factors. Denitrification
can be carried out by several common genera of bacteria provided a substrate, usually organic matter (as a source of energy and electrons), and oxidized nitrogen
are present, but it only occurs under anaerobic or almost anaerobic conditions. At least 14 genera of denitrifying bacteria have been identified, and they are present in most soil and aquatic environments (Follett, 1989). Because much of the
groundwater is suboxic or anoxic, denitrification is one of the predominant terminal electron-accepting processes in the groundwater plume, and it is a key factor in carbon and nitrogen cycling by microorganisms within the affected portions of the aquifer (Smith et al., 1996).
2.4.1(a) Oxygen
Denitrification primarily occurs under low oxygen conditions. Oxygen, which competes with nitrate as an electron acceptor in the energy metabolism of cells, is an important inhibitor. Considerable changes take place in the energy metabolism of
microflora when the availability of oxygen is limited (Hiscock, 1991). The gradual depletion of oxygen or provision of semi-anaerobic conditions appears to favor denitrification. Knowles (1982) explains that in soils there is frequently an inner-aggregate air-filled porosity surrounding intra-inner-aggregate water filled pores which become virtually anaerobic permitting denitrification to occur. Aerobic respiration is then replaced by anaerobic respiration, during which oxygen is replaced by nitrate as an alternative electron acceptor (see Figure 3). Nitrate is the first compound to be reduced after oxygen depletion (half reaction):
N03- + 6 H+ + 5 e- -> 0.5 N2 (g) + 3 H20 {3}
Generally, denitrification is not observed at an oxygen concentration above 0.2 mg/L (Korom, 1992). It has also been observed that the denitrification rate decreases as the air-filled porosity increases, and denitrification ceases as the environment becomes oxidizing at air-filled porosities of 11 to 14% (Pilot and Patrick, 1972). However, the presence of denitrifying enzymes has been detected even in sandy soils which have 20% 02 in the air-filled spaces (Tiedje et al., 1982).
2.4.1(b) Microorganisms and Organic Carbon
Microbial populations in the aquifer can catalyze redox processes and, therefore, affect speciation of the inorganic nitrogen compounds (Ceazan et. al. 1989). Bacteria capable of denitrification are commonly found in many subsurface environments, even when denitrification is not actively occurring (Keeney, 1986). Most denitrifying bacteria are heterotrophic (organic carbon is used both as a carbon source and electron donor) and are able to utilize a wide range of carbon compounds
(sugars, organic acids, amino acids) as sources of electrons. For example, the oxidation half reaction of a carbohydrate is:
SahuraIed Zone
Organic Carbon
Min(IV) as f&022
L~e Mas FeO0 H~
-- - - -~ I
Mn_(U) as N jnC(
1h-h(
-
t
I(II as FeCO31ISE14
)
Figure 3: Oxidation of Organic Carbon in the Saturated Zone with the Sequence of Electron Acceptors and the Resulting Reduced Inorganic Compounds (From Korom, 1992)
CH2O + H20 -+ CO2 (g) + 4 H+ + 4e- {4}
Combining equations (3) and (4) for heterotrophic biological denitrification yields: 5 CH2O + 4 NO3-+ 4 H+ -+ 2 N2 + 5 C02 (g) + 7 H20 {5}
As can be seen in equation {5}, the alkalinity and pH of the solution increases during denitrification. Dinitrogen is unavailable to most organisms.
In groundwater, the concentration of organic carbon is limited by oxidation of the organic matter to carbon dioxide before reaching the water table, and the general lack of soluble organic carbon contained in aquifer solids. Bradley et al. (1992) found
a highly significant relationship between potential denitrification and sediment total organic content. An enhancement of denitrification activity in sediments amended with glucose indicated that denitrification rates were carbon limited. According to equation {5}, the denitrification reaction requires 1.25 mmol of carbon for the reduction of each mmol of nitrate and this stoichiometry has been observed in situ by measuring excess N2 and C02 gas produced at the Cape Cod MMR site (Smith et al., 1991).
Denitrification is carbon limited in a sewage-effluent-contaminated glacial aquifer on Cape Cod (Smith and Duff, 1988) and will most likely be the limiting factor for denitrification throughout Cape Cod's groundwater. The organic carbon limitation is potentially complex because a wide variety of organic compounds are available to denitrifying organisms (Beauchamp et al., 1989). However, only a fraction of the naturally occurring total organic carbon in soils or aquifer sediments generally is labile (Lalisse-Grundmann et al., 1988). Solid-phase organic carbon also may support denitrification (Robertson et al., 1991). However, the amount of
organic carbon in subsurface sediments is often very small, generally less than 0.5% (by weight) in sand aquifers and much of this solid organic matter may be very old and resistant to biodegradation (Mackay, 1990).
Trudell et al. (1986) found that for denitrification to occur in a shallow
unconfined sand aquifer, soil organic carbon at 0.08-0.16% by weight, was adequate to denitrify large amounts of nitrate. During recharge events, when the volumetric water content of the surface soil increases to near saturation, it is possible for organic carbon dissolved in the surface soil zone to be transported to the water table without completely undergoing oxidation. At the water table, this carbon may remain
dissolved or precipitate as solid organic carbon. However, each recharge event that brings dissolved oxygen and nitrate to the water table will deplete the pool of residual solid organic carbon in an aquifer to some extent. The potential exists for extended inputs of nitrate to a flow system over a long period of time to deplete the carbon source to the point at which the aquifer no longer has the capacity to support
denitrification. The net result is the loss of this nitrate sink in the flow system, giving rise to the possibility of extensive accumulation of nitrate contamination of shallow groundwater. However, further work is required to evaluate the potential of this process for the replenishment of DOC in the aquifer for possible
denitrification.
2.4.1(c) Nutrients, Temperature, and pH
The availability of nutrients is an important requirement in sustaining biological cell growth. On the basis of average cellular composition, the favorable ratio of C:N:P:S is about 100:20:4:1 (Spector, 1956), although additional organic carbon is required as an electron donor. Most groundwaters contain adequate
concentrations of the necessary minerals and trace metals to support biosynthesis (Champe et al., 1979).
Denitrification was reported to be positively related to pH with an optimum in the range of 7.0-8.0 (Hiscock, 1991). However, Bradley et al. (1992) did not find a significant correlation between the rate of denitrification and the pH of the
groundwater and hypothesized that denitrifiers adapt to in-situ pH conditions. Temperature is also a significant controlling factor. At a low temperature, denitrification decreases markedly but is measurable between 0 and 5 'C. A
synergistic effect of temperature and oxygen upon denitrification can be noted. At a high temperature, oxygen solubility is less, thus increasing the biological rate
process, and vice versa. Generally, a doubling of denitrification rate is possible with every 10 'C increase in temperature (Gauntlett and Craft, 1979).
2.4.1(d) Redox Potential (EH)
Nitrogen transformations by groundwater microorganisms largely depend on redox conditions in the aquifer. Microbial activity can reduce the redox potential by oxidizing potential electron donors. In a groundwater redox investigation of the Lincolnshire, England limestone aquifer, Gauntlett and Craft (1979) reported that nitrate levels were lowered dramatically when the groundwater EH dropped below ~
+0.25 V. Spalding and Parrott (1994) found that in both domestic and irrigation wells in Nebraska, N03--N concentrations greater than 10 mg/L occurred at a much
higher N03--N frequency in groundwater with measured EH > - +0.28 0.02 V than
in groundwater with lower EH values. They concluded that removal of nitrate via bacterial reduction (heterotrophic denitrification) occurred below +0.28 V. They observed that N03--N and EH decrease both with depth and proximity to the redox front, which is due to the more reducing conditions at greater depths in most
aquifers. Spalding and Parrott thought that there would be no reason to suspect that the low redox groundwater they investigated was unique to that geographical
location so that, worldwide losses via this mechanism could be high and that communities plagued by high nitrate groundwater areas could utilize this in-situ nitrate removal systems by locating their municipal wells on the reducing side of the EH front.
2.4.1(e) Depth in Aquifer
A feature of nitrate contamination of groundwater that has been noted in studies worldwide is the general, inverse relationship between nitrate concentration and depth below the land surface or within an aquifer (Freeze and Cherry, 1979). This is generally attributed to greater rates of biological denitrification in the less oxygenated (i.e., deeper) parts of the aquifer (Trudell et al., 1986). Bradley et al. (1992) found that deep sediments exhibited a rate of denitrification three times that of shallow sediments. Trudell et al. (1986) observed a striking similarity in decreasing nitrate and dissolved oxygen concentrations, which extended from a depth of 1.5-2.1 m. This is believed to be the zone of ongoing denitrification. It has also been noted that the concentration of organic carbon, both solid and dissolved, declines
dramatically with depth in the subsurface, which would imply oxidation via denitrification (Thurman, 1985).
Figure 3 is a schematic representation showing the fate of organic matter, the most common electron donor in nature, in the presence of a variety of electron acceptors in the saturated zone. The figure additionally depicts a generalized progression of reactions with depth below the water table. Nitrate is the next electron acceptor, after 02, to oxidize organic carbon. This is heterotrophic denitrification. It helps explain why nitrate is often found in much greater concentrations near the saturated surface than at greater depths in the aquifer.
2.4.1(f) Depth of Aquifer
Gillham and Cherry (1978) studied several unconfined aquifers in southern Ontario, Canada and found that aerobic conditions and nitrate contamination were generally limited to depths of one to two meters below the water table in aquifers
whose water table was less than two to three meters below ground surface. Starr and Gillham (1989) found that the common pattern of denitrification occurring in
shallow but not deep water table aquifers is controlled by the decline in organic carbon availability with depth. They provided results which showed that there was sufficient labile organic carbon under the ground surface at a site in Canada. This shows that under shallow water table conditions, there is sufficient labile organic carbon present to reduce the dissolved oxygen, followed by denitrification. These results provide strong evidence that denitrification can be an important process in shallow unconfined aquifers.
In contrast, Gillham and Cherry (1978) also observed that aerobic conditions and high nitrate concentrations persisted for substantial depths below the water table in aquifers whose water table was deeper than two to three meters below
ground surface, indicating that denitrification was not an important process in these situations. Under deeper water table conditions, there was insufficient labile organic carbon to provide a substrate for dissolved oxygen and nitrate reduction. The
evidence suggests that dissolved organic carbon originating in the soil zone and transported down by infiltrating water is an important source of labile organic carbon in unconfined aquifers. If this were the case, then the occurrence of denitrification in groundwater would probably be more closely related to the residence time of infiltrating water in the vadose zone than to the depth of the water table. Soil texture and infiltration rate affect residence time in the vadose zone, and could therefore be important factors in addition to water table depth.
2.4.1(g) Losses of Nitrate in Unsaturated Vadose Zone
The fate of nitrate as it traverses unsaturated vadose sediments above the water table remains unclear. Keeney (1986) argues that denitrification is unlikely in
zones than in aquifers (m vs. km) and conditions favoring denitrification are somewhat more likely in aquifers than in unsaturated sediments. Smith and Duff (1988) reported that biological processes (in particular, denitrification) did not seem to have any significant effect on effluent nitrate concentrations during transport through the unsaturated zone.
2.5 Denitrification Rates in Groundwater Environments
From a consideration of thermodynamic principles, the most stable nitrogen species within the pH-EH range encountered in the majority of groundwaters (see figure 4) is predicted to be gaseous dinitrogen (N2). For, example, Freeze and Cherry (1979) state that in an ideal situation, thermodynamics predicts bacterial
denitrification with an organic carbon electron donor will occur in water at pH - 7.0 and EH +0.25 V. The observed departure from equilibrium is explained by the catalyzing effect of bacteria in accelerating the biological reduction of nitrate at lower redox potentials. Denitrification is not an equilibrium process because, as a
microbially-catalyzed reaction, it is irreversible due to the absence of a suitable
catalyst (microbe) for the reverse reaction. Thus, one must address denitrification in groundwater from a standpoint of kinetics, not thermodynamics.
The following table is a sampling of some of the denitrification rates reported in the literature:
I I , I
i I
-Water oxidised N2(g)
NO
-+1200
+1000
+800
+600
+400+200
0
-200
I I0
2
I I II
II
4
6
8
10
12
14
pH
Figure 4: Stability Diagram of Nitrogen Species Showing the Predicted Species of Most Groundwater at 25 *C and 1 atm (From Hiscock et al., 1991)
pH-Eh field representing -+H +most -4 groundwaters Water reduced
E
.=
-w
-400-600
-800
-1000
i II I
I I
I I
I I
Table 2: Field Estimates of Denitrification Rates in Aquifers
Reference Location Aquifer Sample
Material Depths Kolle et al. (1985) and Bottcher et al. (1989) Trudell et al. (1986) Van Beek and Van Puffelen (1987) Starr and Gillham (1989) Korom (1991a) Hannover, Germany Ontario, Canada Holland Ontario, Canada Utah Source: Korom, 1992. 1: Denitrification rates 2: Not reported. 3: Denitrification rates Sand Sand Coarse Sand with Gravel Multiple Depths to 12 m (water table at 2 m) 3 (water table at 1 m) 44m Temp. (*C) Initial [N03--N], mg/L 8-10 up to 40 NR2 10 13.0 2.1 Denitrifi-cation Rates first order reaction with a half-life of 1.2-2.1 years1 0.19-3.1 (mg N/L)/d 0.09-0.15 (mg N/L)/d3 Sand below NR 6.4 0.58 (mg water table N/L)/d which was 1m below ground surface
Clay, Silt, 35 m 6-8 12.5 and up to 0.73
Sand (water 23.7 (mg
table at 1 N/L)/d3
m)
are claimed to be by autotrophic denitrification.
are claimed to be by heterotrophic and autotrophic denitrification.
Smith and Duff (1988) reported rates ranging from 2.3 to 260 pmol of N20 produced (g of wet sediment)-1 h-1. Smith et al. (1996) estimated in-situ rates of denitrification in the range of 0.60-1.51 (nmol N20 produced/cm3 aquifer)/d (0.017 -0.042 (mg N/L)/d). They reported rates highest nearest the contaminant source, with decreasing rates with increasing distance downgradient. In incubated sediment samples, denitrification in samples in which the nitrate concentration was low was stimulated by nitrate; denitrification in samples in which the nitrate concentration was high was stimulated by glucose addition (see figure 5). Near the contaminant
source, N03--N concentrations up to 24 mg/L were measured. The center of the plume 0.25 km downgradient had no detectable N03--N concentrations. Figure 6 shows vertical profile of rates of denitrification and, as stated earlier, follows the general occurrence of greater rates of denitrification at shallow depths.
Smith and Duff (1988) found that the bulk of the denitrifying activity was associated with sediment core solids, not in the interstitial groundwater (see figure 7). The population of denitrifying organisms must then be attached to particulate surfaces rather than existing as free-living organisms in the interstitial groundwater. This was consistent with the findings of Harvey et al. (1984) for the entire subsurface
microbial community: 96% of the organisms within the contaminant plume are particle bound. Thus, groundwater movement past the particulate surfaces controls the nitrate supply to particle-bound microorganisms.
DeSimone et al. (1995) measured denitrification rates in sediment cores from the anoxic zone of a sewage plume on Cape Cod ranging from 0.2 to 32 (ng
N/cm3)/d (2 x 10⁻⁴ -0.032 (mg N/L)/d), with a mean of 9.6 7.4 (ng N/cm3)/d
(0.0096 0.0074 (mg N/L)/d) ( one standard deviation) (see figure 8). Denitrification rates were high where oxygen was depleted and concentrations of nitrate and
dissolved organic carbon were high (figure 9). They also found that nitrous oxide production in unamended slurry incubations was enhanced significantly with the addition of glucose only. The mean denitrification rate calculated from dinitrogen production, 3.0 (ng N/cm3)/d (0.003 (mg N/L)/d), corresponds to a nitrate reduction of 0.015 mg N/L per foot of travel distance, using the groundwater flow velocity of 0.5 ft/d and aquifer characteristics. This is equivalent to an attenuation in nitrate concentration of about 1.5 mg N/L per 100 feet of travel distance under anoxic conditions. This quantity is less than 5% of the nitrate concentrations in the center of the plume. Interestingly, the addition of nitrate had no effect on denitrification