HAL Id: hal-01739577
https://hal.sorbonne-universite.fr/hal-01739577
Submitted on 21 Mar 2018HAL is a multi-disciplinary open access
archive for the deposit and dissemination of sci-entific research documents, whether they are pub-lished or not. The documents may come from teaching and research institutions in France or abroad, or from public or private research centers.
L’archive ouverte pluridisciplinaire HAL, est destinée au dépôt et à la diffusion de documents scientifiques de niveau recherche, publiés ou non, émanant des établissements d’enseignement et de recherche français ou étrangers, des laboratoires publics ou privés.
Effects of Signal Saturation on QUS Parameter
Estimates Based on High-Frequency-Ultrasound Signals
Acquired From Isolated Cancerous Lymph Nodes
Kazuki Tamura, Jonathan Mamou, Alain Coron, Kenji Yoshida, Ernest
Feleppa, Tadashi Yamaguchi
To cite this version:
Kazuki Tamura, Jonathan Mamou, Alain Coron, Kenji Yoshida, Ernest Feleppa, et al.. Effects of Signal Saturation on QUS Parameter Estimates Based on High-Frequency-Ultrasound Signals Ac-quired From Isolated Cancerous Lymph Nodes. IEEE Transactions on Ultrasonics, Ferroelectrics and Frequency Control, Institute of Electrical and Electronics Engineers, 2017, 64 (10), pp.1501-1513. �10.1109/TUFFC.2017.2737360�. �hal-01739577�
Effects of Signal Saturation on QUS Parameter
Estimates Based on High-frequency-ultrasound
Signals Acquired from Isolated Cancerous Lymph
Nodes
Kazuki Tamura, Student Member, IEEE, Jonathan Mamou, Senior Member, IEEE, Alain Coron, Member, IEEE,
Kenji Yoshida, Member, IEEE, Ernest J. Feleppa, Fellow, IEEE and Tadashi Yamaguchi, Member, IEEE
K. Tamura is at the Graduate School of Engineering, Chiba University, Chiba, Japan (e-mail: k_tamura@chiba-u.jp). J. Mamou (e-mail: JMamou@RiversideResearch.org) and E. J. Feleppa are at the Lizzi Center for Biomedical Engineering, Riverside Research, New York. A. Coron is at Laboratoire d'Imagerie Biomédicale, CNRS, INSERM, Sorbonne Universités, UPMC Univ Paris 06, Paris, France. K. Yoshida and T. Yamaguchi (e-mail: yamaguchi@faculty.chiba-u.jp) are at the Center for Frontier Medical Engineering, Chiba University, Chiba, Japan.
This work was supported in part by NIH Grant CA100183, JSPS KAKENHI Grant Number 15K12555, JSPS Invitation Fellowship for Research in Japan (Short-term) S13162 and The Canon Foundation.
Abstract: Choosing an appropriate dynamic range (DR) for acquiring radio frequency (RF) data from a high-frequency-ultrasound (HFU) system is challenging because signals can vary greatly in amplitude as a result of focusing and attenuation effects. In addition, quantitative ultrasound (QUS) results are altered by saturated data. In this paper, the effects of saturation on QUS estimates of effective scatterer diameter (ESD) and effective acoustic concentration (EAC) were quantified using simulated and experimental RF data. Experimental data were acquired from 69 dissected human lymph nodes using a single-element transducer with a 26-MHz center frequency. Artificially saturated signals (𝑥𝑥𝑐𝑐) were produced by thresholding the
original unsaturated RF echo signals. Saturation severity was expressed using a quantity called saturate-signal-to-noise ratio (SSNR). Results indicated that saturation has little effect on ESD estimates. However, EAC estimates decreased significantly with decreasing SSNR. An EAC correction algorithm exploiting a linear relationship between EAC values over a range of SSNR values and 𝑙𝑙1-norm of 𝑥𝑥
𝑐𝑐 (i.e., the sum of absolute values of the true RF echo signal) is developed. The maximal errors
in EAC estimates resulting from saturation were -8.05, -3.59, and -0.93 dB/mm3 with the RF echo signals thresholded to keep
5, 6, and 7-bit from the original 8-bit DR, respectively. The EAC correction algorithm reduced maximal errors to -3.71, -0.89, and -0.26 dB/mm3 when signals were thresholded at 5, 6, and 7-bit, respectively.
INTRODUCTION
Quantitative ultrasound (QUS) methods based on the backscatter coefficient can be used to characterize tissue microstructure using a scattering model [1] and successful QUS studies have been performed to assess various organs. High-frequency (i.e., >20 MHz) ultrasound (HFU) permits fine-resolution imaging of tissue features because its wavelength is short (e.g., 75 μm at 20 MHz) and it typically uses focused beams with low F-numbers.
Also, HFU data have been successfully exploited to quantify ultrasound scattering in soft tissues using spectral-based QUS methods. For example, a study used neural network classification based on spectral parameters [2] to tissue type imaging. In another study, Ghoshal et al. [3] assessed fat amount in liver tissues. Oelze et al. [4] investigated animal models of fibroadenomas and carcinomas using an effective acoustic concentration (EAC) and an effective scatterer diameter (ESD). The exponential, Gaussian, and fluid-filled sphere form factors were investigated to develop QUS methods to investigate human thyroids. The exponential form factor showed the best goodness fit and estimated scatterer diameter ranged from 44 to 56 μm [5]. Lavarello et al. [6] were able to detect and classify diseased thyroid tissues (normal, C-Cell adenoma, papillary thyroid carcinoma, and follicular variant papillary thyroid carcinoma) using ESD, and EAC, homodyned-K parameters. ESD and EAC showed significant difference among normal, papillary thyroid carcinoma, and follicular variant papillary thyroid carcinoma.
Recently, new QUS methods were developed to describe ultrasound scattering in dense media using structure form factor-based method [7]. These dense form factors could prove highly relevant to cancer studies.
However, QUS using HFU remains challenging because of acoustic attenuation and focusing effects. Specifically, HFU, radio frequency (RF), echo signals often have a large dynamic range (DR) because of high-frequency-dependent attenuation along the propagation path and strong focusing. The RF signal amplitude typically covers several orders of magnitude between the sample surface and the deepest imaged regions. Single-element, spherically focused HFU transducers have small f-numbers because a high sound pressure is required to obtain adequate echo-signal data in attenuating media. Therefore, diffraction effects associated with strong focusing become significant and greatly affect the DR of the transmitted and received RF signals, even if the depth range of interest is small. It is one of the reasons why QUS methods are often limited to superficial tissues and why applying QUS clinically can be challenging [5].
Attenuation and diffraction effects create challenging experimental conditions for digitizing RF echo-signal data with 8-bit, or even 12-bit, A/D cards. If the voltage range is set too high, then the signal-to-noise ratio (SNR) of small signals (e.g., from deep regions or weak scatterers) becomes too low. Conversely, if the range is set too low, then large signals are clipped creating nonlinear signals and signal-saturation issues. In clinical ultrasound, saturation can be reduced by adjusting TGC, gain, DR, and other scan settings, but because the latest generation of clinical ultrasound systems is fully digital, saturation still occurs at the digitization step and is related to the assigned digitizer DR. So, a tradeoff exists between the ability to acquire unsaturated RF data for QUS processing as a function of location in the imaged field of view. This problem also exists at typical clinical frequencies, but its investigation in the case of an HFU system is the focus of this paper.
Signal saturation will affect the frequency contents of RF signals. The Fourier transform (FT) of a saturated signal contains harmonics and nonlinear components; therefore, saturation is expected to affect QUS estimates based on the backscatter coefficient. This paper determines the effect of saturation on QUS-parameter estimates and investigates possible correction methods for affected QUS parameters. Recent work by our group demonstrated how QUS estimates were able to distinguish metastatic regions within freshly excised lymph nodes (LNs) using a single element and HFU transducer [8]–[9][10]. Acquiring the LN data was time consuming because it required careful adjustment of several parameters (e.g., DR, gain, and attenuation) to obtain unsaturated RF data. This paper examines the effects of saturation on two QUS parameters proven to be useful for cancer detection in LNs: ESD and EAC. This paper also presents an original method to mitigate the effects of saturation on these parameters. This paper is performed first on simulated data that mimics experimental data from LNs and then on experimental data acquired from human LNs excised from cancer patients. EAC and ESD also are useful in various other tissue-evaluation applications (e.g., distinguishing among different types of rat mammary tumors [11], or assessing types and degrees of fatty liver [3]).
Accurate knowledge of whether LNs contain metastases is mandatory for staging cancer using the American Joint Committee on cancer tumor-node-metastases staging system. The method requests to make a lot of histological samples for definitive diagnosis.
Therefore, because the pathologist cannot evaluate every LN in its entirety, these approaches suffer serious sampling inadequacies. Inadequate LNs sampling results in a large number of false-negative determinations and can greatly affect outcomes. A purpose of our QUS studies of LNs was to develop QUS-based methods to guide the pathologist to the optimal plane for cutting and microscopically examining the LN and thereby reducing the chance of missing small, otherwise occult metastases and the rate of false-negative determinations without increasing the labor load on the pathologists. Our studies to date demonstrated that we have made encouraging progress toward this end [8], [12], [13].
Our approach requires scanning LNs using HFU and acquiring and processing individual LN RF data. Therefore, if the investigated methods are successful, a significant improvement in scanning could be achieved by reducing the time currently needed to prescan the LN in order to set the digitizer DR to avoid saturation.
Although the investigated methods were evaluated on simulated and clinical human-LN data, the methods can be applied to all studies using ESD and EAC. Therefore, if successful, the methods could be invaluable for a wide range of preclinical as well as clinical QUS studies.
The goal of this paper was to rigorously investigate the effects of saturation on two clinically important QUS estimates and to devise, if possible, corrections methods to mitigate these effects. If successful, these methods would permit relaxing experimental constraints on data collection and processing at no detriment to the QUS results. In addition, application of QUS approaches to deeper organs would become easier and more reliable. This paper presents methods and results applied to simulated data, experimental data from a glass-bead phantom, and experimental data from a representative clinical database of 69 LNs acquired from 48 colorectal cancer patients.
MATERIALS AND METHODS
A. ESD AND EAC ESTIMATION
Estimates of ESD and EAC were computed using a spherical Gaussian scattering model [1]. The Gaussian scattering model permits efficient implementation and has been used successfully in numerous studies [11], [14].
For a single element, spherically focused transducer, the normalized theoretical power spectrum obtained from random medium filled with Gaussian scatterers is given by [11]
𝑊𝑊𝑡𝑡ℎ𝑒𝑒𝑒𝑒𝑒𝑒(𝑓𝑓) = 185𝐿𝐿𝑞𝑞 2𝑎𝑎
𝑒𝑒𝑒𝑒𝑒𝑒6 𝜌𝜌𝑍𝑍𝑣𝑣𝑣𝑣𝑒𝑒2 𝑓𝑓4
1 + 2.66�𝑓𝑓𝑞𝑞𝑎𝑎𝑒𝑒𝑒𝑒𝑒𝑒�2
𝑒𝑒−12.159𝑒𝑒2𝑣𝑣𝑒𝑒𝑒𝑒𝑒𝑒2 .
where f is the frequency [MHz], L is the gate length [mm], q is the ratio of transducer diameter to the distance between the transducer and the region of interest (ROI), 𝑎𝑎𝑒𝑒𝑒𝑒𝑒𝑒 is the effective scatterer radius (i.e., 2𝑎𝑎𝑒𝑒𝑒𝑒𝑒𝑒is ESD), and 𝜌𝜌𝑍𝑍𝑣𝑣𝑣𝑣𝑒𝑒2 is an EAC.
Also, ρ is the number of scatterers per mm3 and 𝑍𝑍
𝑣𝑣𝑣𝑣𝑒𝑒= (𝑍𝑍 − 𝑍𝑍0)/𝑍𝑍0is commonly termed the “relative acoustic impedance”
where Z and 𝑍𝑍0 are the acoustic impedances of the scatterers and the surrounding medium, respectively. After removing,
the 𝑓𝑓4 dependence, the logarithm of the experimentally measured normalized power spectrum is fit to an affine function
of 𝑓𝑓2 at the frequency band 14.5–35 MHz, i.e., Q(𝑓𝑓) ≃ 𝐴𝐴𝑓𝑓2+ 𝐵𝐵 when Q(𝑓𝑓) = W(𝑓𝑓) − 40 log(𝑓𝑓), and ESD is estimated
from A [12]
𝐸𝐸𝐸𝐸𝐸𝐸 = 2𝑎𝑎𝑒𝑒𝑒𝑒𝑒𝑒= 2 × �−4.3[12.159 + 2.66𝑞𝑞𝐴𝐴 2] . (2)
EAC is estimated from 𝐵𝐵 and 𝑎𝑎𝑒𝑒𝑒𝑒𝑒𝑒.
𝐸𝐸𝐴𝐴𝐸𝐸 = 𝐵𝐵 − 10log [185𝐿𝐿𝑞𝑞2𝑎𝑎
𝑒𝑒𝑒𝑒𝑒𝑒6 ] . (3)
B. ARTIFICIAL SATURATION
Signal saturation occurs when the RF signal exceeds the digitizer dynamic range. We considered two types of artificial saturation, which are illustrated in Figure 1. Both saturation processes are fully characterized using a parameter 𝜏𝜏 (0 to 2𝑁𝑁−1) where N is the quantization bit number.
1) Natural Artificial Saturation [Fig. 1(a)]: In this type of artificial saturation, the quantization bit number remains fixed
to N and the DR of the digitizer was reduced and defined as
𝐸𝐸𝐷𝐷 = max(|𝐷𝐷𝑅𝑅|)2𝑁𝑁−1𝜏𝜏 , (4) 𝑥𝑥𝑐𝑐= ⎩ ⎨ ⎧ 𝑥𝑥 > 𝐸𝐸𝐷𝐷 : 𝐸𝐸𝐷𝐷 |𝑥𝑥| ≤ 𝐸𝐸𝐷𝐷 : 𝑖𝑖𝑖𝑖𝑖𝑖 �𝑥𝑥 2𝐷𝐷𝐷𝐷𝑁𝑁−1�2𝐷𝐷𝐷𝐷𝑁𝑁−1 𝑥𝑥 < −𝐸𝐸𝐷𝐷 : −𝐸𝐸𝐷𝐷 , (5) where int represents the integer part of its argument and x is the original, unsaturated RF signal.
2) Loss-of-Bit Artificial Saturation [Fig. 1(c)]: This loss-of-bit artificial saturation (LAS) method can be applied to RF echo
signal which has already been acquired with an N -bit digitizer. An M -bit (M<N ) artificially saturated RF signal is obtained using 𝑥𝑥𝑐𝑐= � 𝑥𝑥 > 𝜏𝜏 : 𝜏𝜏 |𝑥𝑥| ≤ 𝜏𝜏 : 𝑥𝑥 𝑥𝑥 < − 𝜏𝜏 : −𝜏𝜏 . (6)
The investigated values of τ were 2𝑁𝑁−4, 2𝑁𝑁−3 and 2𝑁𝑁−2.. These values mean that the DRs were artificially limited to 1/8,
Figure 1 Two-way artificial saturation,
3) Saturate SNR: Saturation effects of natural artificial saturation (NAS) and LAS were quantified using saturate-SNR (SSNR)
𝐸𝐸𝐸𝐸𝑆𝑆𝐷𝐷 = 20 log � �|𝑥𝑥|�2
�|𝑥𝑥−𝑥𝑥𝑐𝑐|�2�. (7)
where ‖𝑥𝑥‖2 is the 𝑙𝑙2-norm of x . Note that if 𝑥𝑥 and 𝑥𝑥𝑐𝑐are identical (i.e., no saturation effects), then SSNR becomes infinite.
The use of SSNR is well established in audio signal restoration and was therefore also used here [15].
C. SPLINE INTERPOLATION
A possible approach to mitigating saturation effects is interpolation. We investigated cubic spline interpolation as a means of correcting saturated RF points because it is an easy method that often provides satisfactory results [16]. The control points were defined as sampled points not affected by artificial saturation (i.e., with absolute values less than τ in LAS and less than DR in NAS).
Fig. 2 shows a result of cubic spline interpolation applied to an RF signal acquired from a human LN. Fig. 2(a) and (b) depicts time-domain and frequency domain signals, respectively. The black, blue, and green lines show the original unsaturated RF signal, the artificially saturated RF signal (with NAS and 𝜏𝜏 =32 when N=8 ), and the restored (i.e., interpolated) RF signal.
Figure 2 Example of signal restoration using cubic spline interpolation. The circles show control point for spline interpolation when 𝜏𝜏 = 32 using LAS. (a) Time-domain signal-form differences. (b) Frequency-dependency differences.
D. EAC CORRECTION METHOD
To correct the effects of saturation on EAC, we took advantage of the empirical linear relationship between the 𝑙𝑙1-norm of
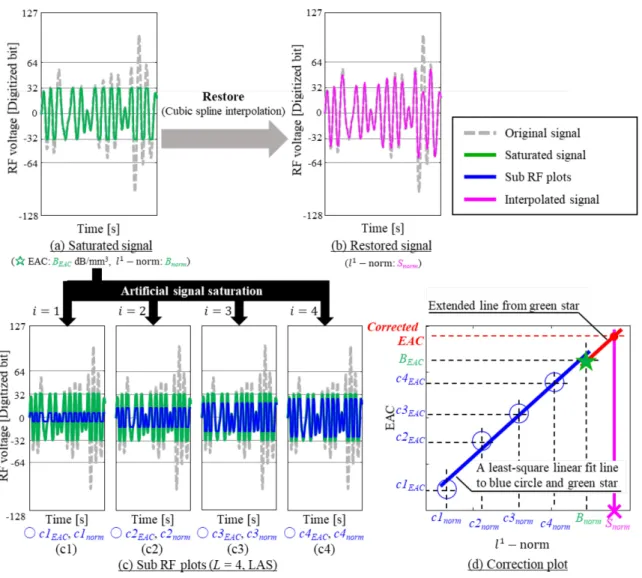
saturated RF signals and EAC. The correction method estimates EACs from saturated RF data and spline interpolation. Fig. 3 illustrates the EAC-correction method applied to an ROI (which was acquired using an 8-bit digitizer) from a human LN. The RF signal was generated using LAS with 𝜏𝜏 = 28−3= 32. A representative (unsaturated) RF segment from this ROI
is shown in gray in Fig. 3(a)–(c), and its saturated version is shown in green.
The method requires the restored signal [Fig. 3(b)], the sub-RF plots [Fig. 3(c1)–(c4)] and the correction plot [Fig. 3(d)]. Fig. 3(b) shows the restored signal (magenta) computed using cubic spline interpolation. The 𝑙𝑙1-norm of restored
signal was plotted as a cross in Fig. 3(d).
Sub RF plots (blue lines in Fig. 3) were artificially saturated versions of the (already) saturated signal [Fig. 3(a)] obtained with lower thresholds. They were obtained by using LAS or NAS on the green signal with L (number of sub RF plots) thresholds which were 𝜏𝜏𝑖𝑖(=𝐿𝐿+1𝜏𝜏 ∙ 𝑖𝑖) or 𝐸𝐸𝐷𝐷𝑖𝑖�=𝐿𝐿+1𝐷𝐷𝐷𝐷 ∙ 𝑖𝑖 = max(|𝐷𝐷𝑅𝑅|)2𝑁𝑁−1𝜏𝜏𝑖𝑖 � in LAS or NAS, respectively, where i was between
1 and L. Sub EAC values (c1EAC, c2EAC, c3EAC, c4EAC) and l1-norm (c1norm, c2norm, c3norm, c4norm) values were calculated from
each sub-RF plot and added to Fig. 3(d). BEAC and Bnorm (computed from the saturated signal) were also shown as the green star in Fig. 3(d). A least-square linear fit was performed in the correction plot to calculate the slope of the linear fit to the green star and the blue circles (slope of the blue line). Then, the red line was obtained using the slope of the fit and forcing it to go through the green star derived from the saturated normalized spectrum. The vertical magenta line in the correction plot was extended vertically from the magenta X. In a final step, the cross point of the extended red line and extended magenta line indicated the corrected EAC value.
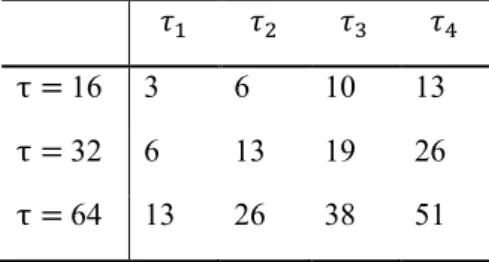
In this example, the value of L was 4 and the values of of τ i were 6, 13, 19 and 26 when LAS was applied with 𝜏𝜏 = 32 on N = 8. The parameters used for the experimental data are shown in Table I.
TABLE I τi Values for Correction
for Experimental Signal (N=8) 𝜏𝜏1 𝜏𝜏2 𝜏𝜏3 𝜏𝜏4
τ = 16 3 6 10 13 τ = 32 6 13 19 26 τ = 64 13 26 38 51
Figure 3 Correction method for EAC. (Right bottom) The green star was plotted using the estimated EAC value and 𝑙𝑙1-norm
of the saturated data. Additional saturated points (blue circle) were plotted using signals which were artificially saturated with threshold 𝜏𝜏𝑖𝑖. The blue line illustrates a least squares fit to the green star and blue circle. The red line is the identical slope as
the blue line and passes through the green star. The magenta line shows the 𝑙𝑙1-normo of the restored data obtained using
cubic spline interpolation. The value of EAC at the intersection point of the red and magenta lines is the corrected EAC value. (a) Saturated signal. (b) Restored signal. (c) Sub-RF plots (L=4 , LAS). (d) Correction plot.
E. SIMULATIONS
Simulated RF signals were computed for random media containing scatterers that followed a Gaussian scattering model. The simulated signals were used to assess the effects of LAS and NAS saturation as well as to evaluate the performance of our EAC correction method under well-controlled conditions.
Backscatter signals were generated in the frequency domain. Transducer pulse-echo impulse-response (Rayleigh pulse modulation) and scatterer locations were converted to the frequency domain with a FT and multiplied. The scatterer locations were set randomly on an axial line, and the scatterer density was controlled for mimicking the lymph node. The resultant spectra were converted to the time domain by an inverse FT. The beam profile was calculated from theoretical equations [17] using the transducer dimensions which was used for LNs measurement and its experimentally measured bandwidth.
The simulated RF signal was then quantized to 8-bit (i.e., constrained to be a signed integer between −128 and 127). For LAS, quantization of the simulated signals was based on maximum |RF(t)| . The simulation parameters shown in Table II were chosen to mimic the experimental human-LN data. The simulation used a single-element focused transducer with an aperture of 6.1 mm, f -number of 2, and a center frequency of 26 MHz. The simulated scan was 1256 lines with 325 points per line sampled at 400 MHz (i.e., 1 mm for depth of computed area). The number of lines and depth were the same as in the ROIs used on human-LN data. Random Gaussian white noise was added to the simulated RF signals to yield an SNR of 31.2 dB, which was the average SNR in the experimental data. Simulations were performed to mimic nonmetastatic and fully metastatic LNs. To that end, EAC and ESD values were −3.57 dB/mm3 and 26.3 μm for the nonmetastatic simulations and EAC and
estimates in our experimental LN data [12]. Each generated RF echo signal was artificially saturated using τ values ranging from from 2N−5 to 2N−2 using LAS (e.g., DR on NAS were 2−4 to 2−1times maximum RF signal) and to permit statistical
analysis, each simulation case was conducted 100 times. TABLE II SIMULATION PARAMETERS
Speed of sound 1540 m/s Aperture 6.1 mm f-number 2
Center frequency 26 MHz Number of lines 1256 lines Number of RF points per line 325 points SNR 31.2 dB Non –
metastatic
Number of scatterers 534 Scat/pl Diameter 26.2 μm ESD 26.3 μm EAC -3.57 dB/mm3
Metastatic
Number of scatterers 219 Scat/pl Diameter 37.1 μm ESD 37.1 μm EAC -7.45 dB/mm3
F. GLASS-BEAD-PHANTOM DATA
Ultrasound RF data were collected from a scattering phantom with glass beads of known average diameter (i.e., 15.9 μm ) and number density (i.e., 1.99×10⁴ scat/mm3). The phantom speed of sound and acoustic attenuation was measured to be
1560 m/s and 0.5 dB/MHz/cm, respectively. RF data were acquired using a single element, focused transducer (Panametrics-NDT, V328) with an aperture of 9.5 mm, a focal length of 19 mm, a center frequency of 14.4 MHz, and a −6 dB bandwidth extending from 9.6 to 18.8 MHz. The theoretical axial and lateral resolutions were 78.6 and 208 μm , respectively. RF echo signals were digitized at 250 MS/s with a 12-bit A/D board. The DR was set 800 mV for nonsaturated RF data and 400, 200, 100, and 50 mV for NAS data. Data were acquired in 31 planes composed of 301 A-lines. Adjacent A-lines were 30 μm apart. The purpose of this experiment was to compare and evaluate the effects of the two artificial saturation methods on ESD and EAC estimates.
G. EXPERIMENTAL HUMAN-LN DATA
LNs were dissected from patients with colorectal and gastric cancers at Kuakini Medical Center (KMC), Honolulu, HI, USA. Echo-signal data acquisition and histological analysis have been described in detail [8]–[9][10], and are summarized here. After gross preparation, individual LNs were placed in a saline bath at room temperature for HFU scanning and data acquisition. RF echo signals were acquired using a single element, focused transducer (Olympus, PI35-2-R0.50 IN) with an aperture of 6.1 mm, a focal length of 12.2 mm, a center frequency of 25.6 MHz, and a −6 dB bandwidth extending from 16.4 to 33.6 MHz. The theoretical axial and lateral resolutions were 86 and 116 μm , respectively. RF echo signals were digitized at 400 MS/s with an 8-bit A/D board. The transducer scanned in x - and y -directions with 25 μm between scan positions to acquire RF echo signals over the full 3-D volume of the LN. A representative data set consisting of 50 nonmetastatic LNs and 19 fully metastatic LNs was used for this paper. The size of LNs varied, but they usually ranged between 5 and 10 mm in their largest dimension. Because the LN project investigated QUS-based methods to differentiate metastatic LNs from nonmetastatic LNs, all experimental settings were set to prevent saturation of RF data acquired from LN tissue. As a result, only the LAS method could be performed on the clinical LN data.
The Institutional Review Boards (IRBs) of the University of Hawaii and the KMC approved the participation of human subject in this paper. All participants were recruited at KMC and gave written informed consent as required by both IRBs.
RESULTS
A. NAS AND LAS EFFECTS ON ESD AND EAC
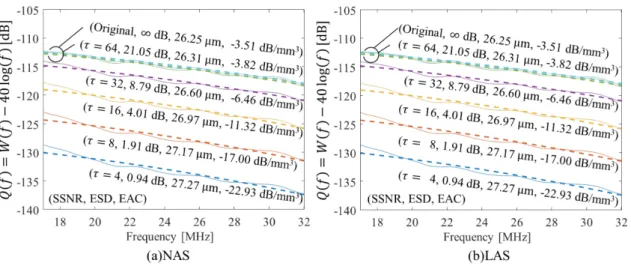
1) Simulation Results: Fig. 4 illustrates the effects of NAS (a) and LAS (b) in the frequency band used for ESD and EAC estimation for the simulated nonmetastatic data. Fig. 4 displays Q(f) (solid curves) and the Gaussian scattering model fit (dashed curves) as a function of 𝜏𝜏 and DR. As expected, the amplitude of the normalized spectrum decreased as 𝜏𝜏 and DR decreased because they result in decreased energy in the RF signal. Interestingly, the frequency dependence of the normalized spectra was not strongly affected by LAS or NAS.
Therefore, EAC also decreased with decreasing τ (e.g., from −3.66 to −16.39 dB/mm3 for LAS), while ESD remained mainly
unaffected with values remaining within 4% of 26 μm for nonmetastatic LN.
Fig. 5(a) shows the ESD error as a function of SSNR with green lines. The error was defined as the difference between the estimated and the simulated ESD. Fig. 5(a) demonstrates that LAS and NAS effects on ESD estimation errors are identical. The estimation errors without saturation (i.e., infinite SSNR) were 0.41±0.45 μm and −0.13±0.30 μm for nonmetastatic and metastatic simulations, respectively. ESD was not affected by saturation using LAS or NAS and a comparison between ESD estimates obtained using saturated data (SSNR > 12.7 dB) and those obtained with nonsaturated data failed to yield a statistically significant difference. Student’s t -test p -values ranged between 0.059 and 0.913 (p<0.05 was the chosen threshold for statistical significance). Therefore, we concluded that both saturation methods had nonsignificant effects on ESD and we did not investigate an ESD-correction algorithm.
Fig. 5(b) shows the EAC error as a function of SSNR. The error was defined as the difference between the estimated and simulated EAC. EAC errors obtained using saturated signals increased exponentially as SSNR decreased for nonmetastatic as well as metastatic simulations. The EAC correction method reduced the errors. For example, for metastatic simulations with SSNR = 6.76 dB, EAC error reduced from −4.02 to −0.37 dB/mm3 with LAS. Similarly, for nonmetastatic simulations
with SSNR = 6.92 dB, EAC error reduced from −4.27 to −1.52 dB/mm3.
The magenta line in Fig. 5 shows the error in ESD and EAC as a function of SSNRs using spline-interpolated RF signals. Maximal ESD errors (percentages of theoretical values) of the interpolated RF signals were 13.32(50.08%)±0.22 μm and 2.05(5.55%)±0.21 μm occurred when 𝜏𝜏 =8(i.e., SSNR ≈ 3 dB) for nonmetastatic and metastatic LNs with LAS, respectively. Spline interpolation reduced EAC estimation errors when the SSNR was greater than 15 dB. However, the error increased rapidly when SSNR decreased below 15 dB for both saturation methods.
Figure 4 Effect of saturation on Q(f) and estimated of EAC and ESD on simulated data. The line colors were saturation level (a) DR and (b) threshold. Line styles illustrate spectrum (solid line) and Gaussian fitting result (dashed line).
Figure 5 (a) ESD errors and (b) EAC error as a function of SSNR obtained using simulated data. Saturation methods were NAS (dashed line) and LAS (solid line). Circle and cross marks were metastatic and nonmetastatic, respectively. Means and standard deviations were obtained from 100 independent random simulations. EAC errors as a function of SSNR before and after application of our EAC correction algorithm. Magenta lines were estimated using spline-interpolated RF echo signal.
2) Glass-Bead-Phantom Results: Fig. 6(a) and (b), respectively, illustrates the effects of NAS and LAS in the frequency band
used for ESD and EAC estimation from glass-bead-phantom data. Fig. 6 displays Q(f) (solid curves) and the Gaussian scattering model fit (dashed curves) as a function of 𝜏𝜏 and DR. Results follow trends similar to those obtained from simulations.
Fig. 7(a) and (b) shows the ESD error as a function of SSNR with NAS and LAS methods, respectively. Overall, ESD error increased with decreasing SSNR. The NAS and LAS results were nearly identical although ESD error from LAS was larger than that obtained from NAS for intermediate values of SSNR (i.e., between 1 and 7.3 dB).
Fig. 7(c) and (d) shows the EAC error as a function of SSNR. EAC errors were different for LAS and NAS. For instance, NAS yielded a lower EAC error than LAS for SSNR values between 7 and 4 dB. The proposed EAC correction method [Fig. 7(c)] applied to NAS data reduced errors to 0.13 and −2.15 dB/mm3 from −7.68 and −1.05 dB/mm3 when DR was 200 mV
(i.e., 𝜏𝜏 =32 ) and 400 mV (𝜏𝜏 =64 ), respectively. In addition, the corrected EAC value 𝜏𝜏 =32 was not statistically different from 0. The proposed EAC correction method applied to LAS data [Fig. 7(d)] reduced error to −6.54, −3.39, and −1.73 dB/mm3 from −14.75, −7.88, and −1.60 dB/mm3 when 𝜏𝜏 was 16, 32, and 64, respectively.
Figure 7 (a) and (b) ESD errors and (c) and (d) EAC error as a function of SSNR obtained using phantom data. (a) and (c) Saturated using NAS. (b) and (d) Saturated using LAS. Means and standard deviations were obtained from 231 ROIs. EAC errors as a function of SSNR before and after application of our EAC correction algorithm.
3) Summary of Results: The previous two results sections demonstrate that NAS and LAS methods have nearly identical
effects on estimated values of ESD and EAC (with or without correction).
B. HUMAN-LN-DATA SET RESULTS
1) Illustrative Effects in the Frequency Domain:
Fig. 8 illustrates the effects of LAS in the frequency band used for QUS estimation on a representative human-LN data set. Fig. 8 displays the normalized spectrum and the Gaussian scattering model fit (dashed line) as a function of 𝜏𝜏. The results are very similar to those of Figs. 4 and 6. The magnitudes of the normalized spectra decrease with decreasing 𝜏𝜏, but the effect of LAS on the frequency dependence of the normalized spectra is very limited. Therefore, as expected, EAC also decreased with decreasing τ (for values of SSNR from infinity to 1.2 dB), while ESD is essentially unaffected with values remaining within 4.3% of 25.7 μm.
Figure 8 Effect of saturation on Q(f) and estimated of EAC and ESD on representative experimental data.
2) Effective Scatterer Diameter Estimation:
Fig. 9(a) illustrates the impact of LAS on ESD estimates. SSNR values were distributed from infinity to 3.26 dB. The error was defined as the difference between the ESD value computed with and without LAS. Estimate values were very robust to LAS effects, with relative errors smaller than 1.65 μm , which is 4.5% of the original ESD. Fig. 9(b) demonstrates that nonsignificant differences (t -test, p>0.05 ) existed for SSNR values ranging from infinity to 3.9 dB. (The effects were so small that investigation of a correction method was not warranted in this paper, but may be the subject of a future study.)
Figure 9 ESD estimation errors as a function of saturation. Error is defined as mean of 𝐸𝐸𝐸𝐸𝐸𝐸𝜏𝜏− 𝐸𝐸𝐸𝐸𝐸𝐸𝑒𝑒𝑒𝑒𝑖𝑖, where 𝐸𝐸𝐸𝐸𝐸𝐸𝜏𝜏and 𝐸𝐸𝐸𝐸𝐸𝐸𝑒𝑒𝑒𝑒𝑖𝑖 are
the means of estimated ESD value using saturated data at τ and original. nonsaturated data, respectively. (a) ESD errors from all LNs. (b) ESD errors from LNs selected from (a) for which nonsignificant errors were found (i.e., t -test yielded p>0.05). Symbols and error bars are the mean and standard deviation of the ESD errors obtained from each LN, respectively.
3) Effective Acoustic Concentration Estimation:
Fig. 10(a) illustrates the effect of LAS on EAC estimates. The errors are defined as the difference between the value of the EAC estimate in the presence and absence of LAS. EAC values decreased as SSNR values decreased. The maximal errors were −8.05, −3.59, and −0.93 dB/mm3 when 𝜏𝜏 was 16, 32, and 64, respectively. Fig. 10(c) illustrates the result of the
EAC-correction algorithm. The maximal errors (after EAC-correction) were −3.71, −0.89, and −0.26 dB/mm3 when τ was 16, 32, and 64,
respectively. Fig. 10(b) and (d), which were extracted from Fig. 10(a) and (c), respectively, shows EAC error values that were not statistically different from 0 (i.e., t -test yielded p>0.05). The lower bound of the SSNR range of nonsignificant effects decreased from 22.78 to 3.99 dB using the proposed correction method. Finally, Fig. 10(e) shows the mean and standard-deviation values around SSNR values from 2 to 30 dB in steps of 2 dB. Fig. 10 clearly demonstrates the reduction in EAC error and shows that, for SSNR > 10 dB, the corrected EAC can be assumed to be accurate.
Fig. 10.(a) and (b) Estimated acoustic concentration before correction. (c) and (d) Estimated acoustic concentration after correction. (b) and (d) Extract plots which were showing nonsignificant difference (t -test, p>0.05). (e) Combined data from (a) and (c) where results were averaged binned every 2 dB in SNNR to permit easy visualization of the EAC correction effects.
4) Effects on Cancer Detection:
Ultimately, EAC and ESD values are intended to identify metastatic regions within LNs. Therefore, this section evaluates the effects of LAS on cancer detection before and after EAC correction.
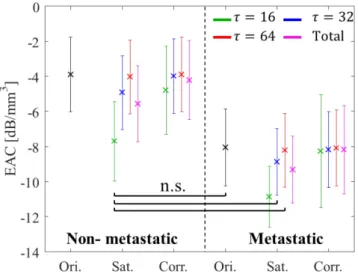
Fig. 11 shows means and standard deviations of the corrected EAC values of metastatic and nonmetastatic LNs for each threshold value. The mean value of corrected EAC values for metastatic LNs at 𝜏𝜏 =16 was approximately −8 dB/mm3. A
nonsignificant difference (t -test, p>0.05) existed between the mean EAC values of nonmetastatic and metastatic LNs. Table III shows the effect of LAS on EAC estimates and the performance of the correction method for the purpose of cancerous LN detection. The highest mean error caused by LAS was −3.83 dB/mm3 and the maximal error was −8.05 dB/mm3.
In comparison, the difference in the mean values of EAC estimates in the original unsaturated signals from nonmetastatic and metastatic LNs was 4.18 dB/mm3. However, after correction, the mean errors in values of the EAC estimate were less than
−1.06 dB/mm3 and the maximal error was less than −4 dB/mm3.
Fig. 11. Mean and standard deviation of EAC estimates in nonmetastatic and metastatic LNs.
TABLE III. SATURATION EFFECT AND CORRECTION PERFORMANCE (MEAN VALUES±STANDARD DEVIATION VALUES). ERRORS WERE DEFINED AS SATURATION OR CORRECTION MINUS ORIGINAL. MEAN ERROR IS THE DIFFERENCE BETWEEN NON-SATURATED AND VALUES WITH SATURATED DATA OR CORRECTED DATA. ERROR MAXIMUM (MAX.) IS MAXIMUM OF ABSOLUTE ERROR
Original [dB/mm3]
Saturation [dB/mm3]
Saturation Error Correction [dB/mm3]
Correction Error
Mean Max. Mean Max.
τ=16 Non- meta. -3.88 ± 2.38 -7.71 ± 1.88 -3.83 -8.05 -4.79 ± 2.10 -0.91 -3.71 Meta. -8.06 ± 4.69 -10.87 ± 3.97 -2.81 -5.73 -8.27 ± 4.63 -0.22 2.24 τ=32 Non- meta. - -4.94 ± 2.07 -1.06 -3.59 -3.99 ± 2.37 -0.11 -0.60 Meta. - -8.88 ± 4.35 -0.82 -2.72 -8.18 ± 4.57 -0.13 -0.89 τ=64 Non- meta. - -4.03 ± 2.31 -0.15 -0.09 -3.88 ± 2.39 0.00 0.11 Meta. - -8.21 ± 4.60 -0.15 -0.89 -8.08 ± 2.39 -0.03 -0.26
DISCUSSION
A. EFFECT ON QUS PARAMETERS
The effects of LAS saturation on ESD and EAC have the same trend on simulated RF data (Fig. 5) and human-LNs RF data (Figs. 9 and 10). In particular, these studies demonstrated that saturation effects on ESD estimates were limited regardless of the saturation method because the frequency dependence of the normalized spectrum used for QUS estimation was not affected. On the contrary, EAC was strongly affected because of the amplitude decrease of the normalized spectrum in the presence of signal saturation.
Nevertheless, Eqs. (2) and (3) indicate that EAC depends on the amplitude of the normalized spectrum as well as its frequency dependence. In particular, a small error in ESD can greatly affect EAC because of the 6th power of 𝑎𝑎𝑒𝑒𝑒𝑒𝑒𝑒 in (3). The EAC
values were still significantly reduced even if the 𝑎𝑎𝑒𝑒𝑒𝑒𝑒𝑒 used in (3) was fixed to the value obtained from unsaturated data.
Therefore, the main cause of EAC reduction is the signal power loss caused by saturation and not the small errors on ESD. Our proposed correction algorithm has value in reducing the need to optimize the voltage range on the A/D card used to quantize RF echo signals or to use multiple voltage ranges to assure acquisition of unsaturated signals. The algorithm can be seen as a means to enhance the DR of the RF data for QUS estimation, which could prove invaluable in fast-paced clinical use of these techniques.
A significant difference in the EAC values was not apparent in nonmetastatic and metastatic LNs when echo signals were saturated, as indicated in Fig. 11. However, the EAC values of nonmetastatic LNs were affected more strongly than those of metastatic LNs because the normalized spectra of nonmetastatic LNs were typically larger than those of metastatic LNs. Note that in our LN studies, ESD was the single QUS parameter which permitted cancer detection the most effectively [12]. Therefore, this paper also confirms that cancer detection in human LNs using ESD could be performed directly without the need for any correction and without careful optimization of the digitizer range.
Nevertheless, this paper also suggests that detection of cancer in LNs using uncorrected EAC estimates from saturated signals could increase false-negative determinations. This is particularly true for the LNs excised from breast cancer patients where EAC could be an important contributor to cancer detection [13]. This hypothesis will be tested in subsequent studies performed on our extensive database of LN excised from breast cancer patients.
The EAC correction method was carefully demonstrated on single-element data. In addition, our results also demonstrated that no ESD correction was needed. Nevertheless, clinical ultrasound data is most often acquired using array transducer and while we are encouraged by our results to hypothesize that they may generalize to array data, further investigations are needed and will be the subject of subsequent studies.
In conclusion, the proposed correction algorithm has value in QUS-based diagnosis because: 1) ESD values can be used without correction as shown in Section III-B2 and 2) EAC values can be used following our correction algorithm.
B. ON THE USE OF THE INTERPOLATED RF SIGNAL TO ESTIMATE ESD AND EAC
In this paper, we also investigated the use of the spline-interpolated RF signal to estimate EAC and ESD (Fig. 5); however, QUS estimates were found to be unsatisfactory. In fact, ESD errors were found to be larger than those obtained from saturated signals and EAC errors were larger than those obtained after our EAC correction method.
As expected, with the proposed method and the interpolation method, EAC errors increased as SSNR decreased. The proposed EAC correction method produced a smaller EAC error than the interpolation method did when SSNR ranged from infinity to 3.19 dB for nonmetastatic LNs and from infinity to 8.11 dB for metastatic LNs [See Fig. 5(b)]. In addition, our method is more adapted to QUS studies because, saturation effects can greatly vary within an ROI (i.e., each RF segment has its own SSNR) Therefore, the optimal correction method must be effective over a wide range of SSNR values. When SSNR values span a wide range, the correction method described here is superior to the spline-only interpolation method.
C. ROBUSTNESS AND EFFECTIVE BIT GAIN
The result of EAC correction (simulation: Fig. 5(b), glass-bead phantom: Fig. 7(c) and (d), and human-LN data set: Fig. 10) shows satisfactory results for SSNR greater than 7 dB. To illustrate the limitations of our EAC correction methods, Fig. 12 shows the results obtained from simulated RF data saturated with LAS using a τ value of 12, 20, and 32. As expected, Fig. 12 shows that for the lowest threshold, the correction is ineffective. Satisfactory results were obtained with τ=20, and nearly perfect correction was achieved with τ=32. These results demonstrate that estimating the unsaturated l1
-norm is critical for accurate EAC correction and that the cubic spline interpolation is unable to provide accurate l1-norm
estimates when τ is too small.
To further investigate how the 𝑙𝑙1-norm estimates degrade as SSNR decreases, Fig. 13 displays the ratio of the 𝑙𝑙1-norms of
the saturated and interpolated signals against the original unsaturated l1-norm. These plots show means and standard
deviations obtained from 100 random simulations. Both plots show positive correlation against SSNR The l1-norm ratio of
interpolation shows higher value than saturation on a wide SSNR range (i.e., between infinity and 1.03 dB) and drops rapidly when SSNR < 5 dB. It means that the accuracy of l1-norm estimation decreased sharply when SSNR was <5 dB. These results
demonstrate that our EAC correction method is stable and robust and can be used for SSNR > 5 dB; based on our representative data sets of 69 LNs, an SSNR of 5 dB is achieved with τ=16 in LAS, which means that our correction methods virtually extended the DR by 3-bit (i.e., log2 (128/16)). This feature could prove critical in clinical implementations of these
methods were time might not be available to optimally set the digitizer range or could permit the proper QUS processing of deeper suspicious regions.
Fig. 12. Robustness of EAC correction algorithm presented in the same format as Fig. 3(d). (a) Deficient correction. (b) Satisfactory correction. (c) Best correction.
Fig. 13. l1-norm ratios as a function of SSNR. They were
calculated as the l1-norm obtained from saturated or interpolated
data divided the l1-norm of the original unsaturated data. Mean
and standard deviation were obtained from 100 random simulations.
ACKNOWLEDGMENT
The authors would like to thank A. C. Luchies who provided initial codes for the Gaussian scattering simulations.
[1] F. L. Lizzi M. Ostromogilsky E. J. Feleppa M. C. Rorke M. M. Yaremko "Relationship of ultrasonic spectral parameters to features of tissue microstructure" IEEE Trans. Ultrason. Ferroelect. Freq. Control vol. 34 no. 3 pp. 319-329 May 1986.
[2] E. J. Feleppa C. R. Porter J. Ketterling P. Lee S. Urban A. Kalisz "Recent developments in tissue-type imaging (TTI) for planning and monitoring treatment of prostate cancer" Ultrasound Imag. vol. 26 no. 3 pp. 163-172 2004. [3] G. Ghoshal R. J. Lavarello J. P. Kemmerer R. J. Miller M. L. Oelze " Ex vivo study of quantitative ultrasound
parameters in fatty rabbit livers " Ultrasound Med. Biol. vol. 38 no. 12 pp. 2238-2248 2012.
[4] M. L. Oelze W. D. O’Brien J. P. Blue J. F. Zachary "Differentiation and characterization of rat mammary fibroadenomas and 4T1 mouse carcinomas using quantitative ultrasound imaging" IEEE Trans. Med. Imag. vol. 23 no. 6 pp. 764-771 Jun. 2004.
[5] J. Rouyer T. Cueva T. Yamamoto A. Portal R. J. Lavarello " In vivo estimation of attenuation and backscatter coefficients from human thyroids " IEEE Trans. Ultrason. Ferroelect. Freq. Control vol. 63 no. 9 pp. 1253-1261 Sep. 2016.
[6] R. J. Lavarello W. R. Ridgway S. S. Sarwate M. L. Oelze "Characterization of thyroid cancer in mouse models using high-frequency quantitative ultrasound techniques" Ultrasound Med. Biol. vol. 39 no. 12 pp. 2333-2341 2013. [7] E. Franceschini R. de Monchy J. Mamou "Quantitative characterization of tissue microstructure in concentrated cell
pellet biophantoms based on the structure factor model" IEEE Trans. Ultrason. Ferroelect. Freq. Control vol. 63 no. 9 pp. 1321-1334 Sep. 2016.
[8] J. Mamou et al. "Three-dimensional high-frequency backscatter and envelope quantification of cancerous human lymph nodes" Ultrasound Med. Biol. vol. 37 no. 3 pp. 345-357 Mar. 2011.
[9] A. Coron et al. "A quantitative ultrasound-based method and device for reliably guiding pathologists to metastatic regions of dissected lymph nodes" Proc. 9th IEEE Int. Symp. Biomed. Imag. pp. 1064-1067 May 2012.
[10] J. Mamou et al. "High-frequency quantitative ultrasound imaging of cancerous lymph nodes" Jpn. J. Appl. Phys. vol. 48 pp. 07GK08 Jul. 2009.
[11] M. L. Oelzea J. F. Zachary W. D. O’Brien "Characterization of tissue microstructure using ultrasonic backscatter: Theory and technique for optimization using a Gaussian form factor" J. Acoust. Soc. Amer. vol. 112 no. 3 pp. 1202-1211 2002.
[12] J. Mamou et al. "Three-dimensional high-frequency characterization of cancerous lymph nodes" Ultrasound Med. Biol. vol. 36 no. 3 pp. 361-375 2010.
[13] E. Saegusa-Beecroft et al. "Three-dimensional quantitative ultrasound for detecting lymph node metastases" J. Surgical Res. vol. 183 no. 1 pp. 258-269 2013.
[14] M. F. Insana R. F. Wagner D. G. Brown T. J. Hall "Describing small-scale structure in random media using pulse-echo ultrasound" J. Acoust. Soc. Amer. vol. 87 no. 1 pp. 179-192 1990.
[15] S. Kitic L. Jacques N. Madhu M. P. Hopwood A. Spriet C. De Vleeschouwer "Consistent iterative hard thresholding for signal declipping" Proc. 38th Int. Conf. Acoust. Speech Signal Process. (ICASSP) pp. 5939-5943 2013.
[16] C. de Boor A Practical Guide to Splines: Revised Edition New York NY USA:Springer 2001.
[17] C. H. Chou B. T. Khuri-Yakub G. S. Kino Transmission Imaging: Forward Scattering and Scatter Reconstruction New York NY USA:Springer 1980.