HAL Id: hal-02378044
https://hal.archives-ouvertes.fr/hal-02378044
Submitted on 24 Nov 2019
HAL is a multi-disciplinary open access
archive for the deposit and dissemination of
sci-entific research documents, whether they are
pub-lished or not. The documents may come from
teaching and research institutions in France or
abroad, or from public or private research centers.
L’archive ouverte pluridisciplinaire HAL, est
destinée au dépôt et à la diffusion de documents
scientifiques de niveau recherche, publiés ou non,
émanant des établissements d’enseignement et de
recherche français ou étrangers, des laboratoires
publics ou privés.
Granular Rayleigh-Taylor instability
Jan Vinningland, Øistein Johnsen, Eirik Flekkøy, Renaud Toussaint, Knut
Måløy
To cite this version:
Jan Vinningland, Øistein Johnsen, Eirik Flekkøy, Renaud Toussaint, Knut Måløy. Granular
Rayleigh-Taylor instability.
Appert-Rolland, C., Chevoir, F., Gondret, P., Lassarre, S., Lebacque, J.-P.,
Schreckenberg, M. Traffic and Granular Flow ’ 07, Springer, pp.577-586, 2009, 978-3-540-77074-9.
�hal-02378044�
Granular Rayleigh-Taylor instability
Jan Ludvig Vinningland1
, Øistein Johnsen1
, Eirik G. Flekkøy1
, Renaud Toussaint2
, and Knut Jørgen Måløy1
1
Department of Physics, University of Oslo, P.0.Box 1048, N-0316 Oslo, Norway
2
Institut de Physique du Globe de Strasbourg, CNRS, Université Louis Pasteur, 5 rue Descartes, 67084 Strasbourg Cedex, France
Summary. A granular instability driven by gravity is studied experimentally and numerically. The instability arises as grains fall in a closed Hele-Shaw cell where a layer of dense granular material is positioned above a layer of air. The initially flat front defined by the grains subsequently develops into a pattern of falling granu-lar fingers separated by rising bubbles of air. A transient coarsening of the front is observed right from the start by a finger merging process. The coarsening is later sta-bilized by new fingers growing from the center of the rising bubbles. The structures are quantified by means of Fourier analysis and quantitative agreement between ex-periment and computation is shown. This analysis also reveals scale invariance of the flow structures under overall change of spatial scale.
1 Introduction
Improved understanding of granular flows would be of essential importance to a range of industrial applications, to the study of geological pattern forming processes, and, in general, to the theoretical description of disordered media. As grains become smaller the effect of the interstitial fluid becomes more important. The result is a combination of dry granular dynamics and the hydrodynamics of the fluid. These systems give rise to a variety of exotic and most often poorly understood phenomena such as fluidization [1] and bubble instabilities [2], quicksand and jet formation [3], and sandwich structures in systems where different particle types segregate [4]. While the study of dry granular media has been extensive over the past decades, the exploration of fluid-granular systems has been of more limited scope.
A wide range of granular instabilities where various structures form along fluid-grain interfaces have been reported the last few years [7, 2]. Notably, the patterns formed by grains falling in a highly viscous liquid were investigated experimentally and theoretically by Völtz et al. [8]. The instability reported by Völtz shares its main qualitative characteristics with the classical Rayleigh-Taylor instability, i.e. a single dominating wavelength growing right from the
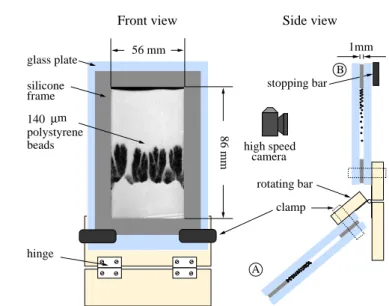
high speed camera A B m µ Side view 56 mm hinge glass plate silicone 1mm rotating bar stopping bar 86 mm 140 polystyrene beads Front view clamp frame
Fig. 1. Front and side view of the experimental setup. Two cell positions are su-perimposed in the side view to illustrate the manual rotation from position A to B.
start. In contrast, the instability discussed here arises along an air-grain in-terface where falling granular fingers and rising air-bubbles form [9, 10]. A coarsening of the finger-bubble pattern is observed right from the start of the instability. The coarsening subsequently stabilizes due to the continuous formation of new fingers at the centers of the rising and growing bubbles. Our experimental and numerical data compare favorably both qualitatively and quantitatively, despite the simplifications of the numerical model: Only two spatial dimensions, zero interparticle friction, no gas inertia, and a res-olution of the gas-grid of 2.5 grain diameters. The finger-bubble structures further exhibit scale invariance under change of particle size, a feature which is supported both by observations and theoretical considerations.
The experiment is presented in Sec. 2, and the numerical model is outlined in Sec. 3. The analysis and the consistency check are presented in Section 4, together with the scale invariance observed when the grain diameter increases. The conclusion is given in Section 5.
2 Experiment
The experimental setup, illustrated in Fig. 1, consists of a closed Hele-Shaw cell mounted on a hinged bar which enables the cell to rotate approximately 130 degrees from a lower to an upper vertical position (from A to B in Fig. 1). The Hele-Shaw cell is made of a 1 mm thick silicone frame sandwiched between two 8 mm thick glass plates. The internal dimensions of the cell are 56 mm ×
Granular Rayleigh-Taylor instability 3
Merging fingers New fingers
(a) t = 0.00 s (b) t = 0.09 s (c) t = 0.19 s (d) t = 0.28 s
(e) t = 0.38 s (f) t = 0.47 s (g) t = 0.56 s (h) t = 0.66 s
Fig. 2. Experimental images of the granular Rayleigh-Taylor instability where a layer of monodisperse polystyrene beads of 140 µm in diameter (black) displaces air (white) in a Hele-Shaw cell of dimensions 56 mm × 86 mm × 1 mm.
86 mm × 1 mm, and it is filled with polystyrene beads and air at atmospheric pressure. The cell is rotated manually and it takes about 0.2 seconds to bring the cell to an upright, vertical position. The off-center pivot of the cell causes the rotation to slow down the falling motion of the grains due to centrifugal forces. A bar is mounted at position B in order to have some control of the final vertical position of the cell. The evolution of the instability is recorded by a high speed digital camera (Photron Fastcam-APX 120K) taking images with a resolution of 512x512 pixels at a rate of 500 frames per second.
Monodisperse polystyrene beads of 140 µm in diameter (Microbeads® Dynoseeds TS 140-51) are used in the experiments. The filling of the cell is performed with one glass plate lying down horizontally with the silicone frame adhered on top. Small portions of beads are carefully deposited on the plate and leveled with the frame before the upper plate is attached and fasted with clamps. The cell is flipped a few times after closure to allow the grains to form a random loose packed configuration before the cell is rotated.
The humidity in the lab is important in order to keep the electrostatic and cohesive properties of the grains at a suitable level to prevent the grains from clustering or sticking to the glass plates. During the filling of the cell and throughout the experiment the humidity was kept constant at about 30%.
A series of images from the experiment is shown in Fig. 2. Due to ex-perimental imperfections the initial air-grain interface in Fig. 2(a) is not a well-defined, horizontal front. This is mainly caused by three factors: (1)
Os-nodes
grain
Fig. 3.Illustrating the smoothing function: A single grain i and its four neighbouring grid-nodes are shown. The four subdivisions of the cell-volume (i.e. the area between the stapled lines) correspond to the fraction of vi (or mi) that contributes to the
continuous u(x, y) (or ρ(x, y)) fields at the opposite nodes. The gray-scale of the subdivisions indicates which node they belong to.
cillations in the cell caused by the abrupt stop as it reaches the vertical (and hits the bar), (2) the falling of grains during the rotation, and (3) the granular Boycott effect during rotation (i.e. grains and air pass each others in layers parallel to the plates) caused by the fact that up to 7 layers of beads may fit between the plates. However, all these experimental effects are non-persistent and in Fig. 2(b) the first finger-bubble structures are clearly visible. As the instability evolves a coarsening of the structures is observed. However, new fingers emerging from the center of the rising bubbles (see Fig. 2(c)) prevent the size of the structures to grow indefinitely and gives rise to a characteris-tic bubble-size. The coarsening is driven by fingers merging and forming an inverted Y as is indicated in Fig. 2(c).
3 Simulation
The numerical model, first introduced by McNamara et al. [11, 12], combines a continuum description of the air with a discrete description of the granu-lar phase. The granugranu-lar phase is a collection of rigid spheres that constitute a deformable porous media described by coarse grained solid fraction ρ(x, y) and granular velocity u(x, y) fields on the grid where (x, y) are the two dimen-sional space coordinates. The continuous fields ρ(x, y) and u(x, y) are obtained from the positions and velocities of the individual grains by means of a linear smoothing function: To calculate u(x, y) a fraction of viis distributed to each of the four neighbouring grid-nodes of grain i. This is illustrated in Fig. 3.
The continuum gas phase is described solely by its pressure P (x, y). The inertia of the gas, and hence its velocity field, is not considered. This is justified for small particle Reynolds numbers as is the case for our system. The pressure is governed by the equation [11, 12]
φ³∂P ∂t + u · ∇P ´ = ∇ ·³Pκ(φ) µ ∇P ´ − P ∇ · u , (1)
Granular Rayleigh-Taylor instability 5
(a) t = 0.00 s (b) t = 0.09 s (c) t = 0.19 s (d) t = 0.28 s
(e) t = 0.38 s (f) t = 0.47 s (g) t = 0.56 s (h) t = 0.66 s
Fig. 4.Snapshots from a simulation where the input parameters are determined by the experiment in Fig. 2. The grain density is 1.05 g/cm3
, grain diameter is 140 µm, and the cell dimensions are 56 mm × 68 mm.
where φ(x, y) = 1 − ρ(x, y) is the porosity, κ(x, y) the permeability, u(x, y) the granular velocity field, and µ the gas viscosity. This equation is derived from the conservation of air and grain mass, using Darcy’s law [16] to obtain the pressure drop over a volume with permeability κ. The Carman-Kozeny relation [17] is assumed for the permeability, and the isothermal ideal gas law is assumed for the compressible gas. See Refs. [11, 12] for a detailed derivation. The empirical Carman-Kozeny relation is given by
κ(ρ, d) = d 2 180
(1 − ρ)3
ρ2 , (2)
where ρ is the local solid fraction, and d is the diameter of the grains, and 1/180 is an empirical constant valid for a packing of beads.
The grains are governed by Newton’s second law mdv
dt = mg + FI− V ∇P
ρ , (3)
where m, v, and V are respectively the mass, velocity, and volume of the grain. Contact dynamics [18] is used to calculate the interparticle force FI which keeps the grains from overlapping. The dynamics of the grains are simplified by neglecting particle-particle and particle-wall friction. A lower cutoff is imposed on the solid fraction because the Carman-Kozeny relation is not valid as the solid fraction drops below 0.25 [19]. This cutoff causes the permeability of the most dilute regions of the system to be slightly lower than the true permeability. The effect is a slight overestimation of the pressure forces acting on the grains in the dilute regions.
examples of power spectra at different horizontal slices (a) 0 2 4 6 8 10 12 14 0 0.5 1 1.5 2 2.5 3 hki =P k ¯PS¯(k) S(k) σk= s P k2S¯(k) PS¯(k) −hki2 hki k (1/cm) ¯ S(k) (b)
Fig. 5.(a) Power spectra superposed on the solid fraction field from which they are obtained. (b) The averaged power spectrum of the solid fraction field shown in (a) with the mean wave number hki indicated.
Figure 4 shows a series of snapshots from a simulation with the same grain diameter, grain density, and cell dimensions (except for the cell thickness since the simulation is 2D) as in the experiment shown in Fig. 2. A qualitative com-parison of the image-series in Figs. 2 and 4 renders the simulation and exper-iment consistent in many respects: The sizes of the bubbles and the fingers are comparable, and the dynamical processes of finger merging and finger nucleation are observed in both cases. Nevertheless, some discrepancies are observed, particularly at the start and toward the end of the instability. The initial differences are mainly attributed to imperfections of the experimen-tal setup: In the experiments the instability start from a homogeneous sheet of grains rather than from a sharp air-grain interface as in the simulations. Further differences are observed toward the end of the instability: In the nu-merical snapshots bigger bubbles reach the upper surface before the smaller bubbles (see e.g. Fig. 4(f)). In the experiment, however, the row of bubbles stays more or less horizontally aligned from start to finish. We believe this is an effect of the zero grain-wall and grain-grain friction used in the simulation.
4 Results
To study the coarsening of the observed structures quantitatively we use the Fourier spectrum of the solid fraction field to obtain a characteristic average wave number hki by the following procedure. The discrete Fourier transform and the power spectrum of each horizontal line of ρ(x, y) is cal-culated. The averaged power spectrum, ¯S(k), is then obtained by averaging over all these horizontal power spectra. An average wave number is defined
Granular Rayleigh-Taylor instability 7 0 0.1 0.2 0.3 0.4 0.5 0.6 0.7 0 1 2 3 4 5 time (s) < k > (1/cm) 0 0.1 0.2 0.3 0.4 0.5 0.6 0.7 1 2 3 4 σ k (1/cm) simulation experiment experiment
Fig. 6. Mean wave number hki and standard deviation σk (inset) for two
experi-ments and one simulation, all using polystyrene beads of 140 µm in diameter.
as hki = P
kS(k) · k/¯ P
kS(k), where 1/k is the wavelength. Likewise, we¯ define the squared standard deviation σ 2
k = P kS(k) · k¯ 2 /P kS(k) − hki¯ 2 . For the experimental data the image pixel values are used to estimate the solid fraction. Figure 5(a) shows ρ(x, y) for t = 0.09 s and three power spectra obtained at different vertical positions (indicated by black lines). Figure 5(b) shows the averaged power spectrum ¯S(k) and mean wave number hki of the solid fraction field in Fig. 5(a).
Figure 6 shows the temporal evolution of hki and σk (inset) for the numer-ical and experimental data. An additional set of experimental data is added to the plot. The numerical curve starts out with a significantly higher wave number than the experimental curves. This behaviour is however expected given the difference in initial conditions. After about 0.2 seconds the experi-mental and numerical data coincide and continue to show a similar coarsening behavior. The fluctuations of hki and σk are associated with the continuous nucleation of new fingers and merging of existing fingers.
We further investigate the behavior of the system as the overall spatial scale is changed: Keeping all length ratios and the particle number fixed, the size of the system will scale according to the diameter d of the grains. We measure the characteristic inverse length scale hki as d is changed and observe a scale invariance of the evolution. A series of seven simulations are performed where d varies from 70 µm to 490 µm in steps of 70 µm. The dimension of the numerical cell confining grains of 70 µm in diameter is 28 mm x 34 mm. To compare, a series of experiments using polystyrene beads of 80, 140, 230, and 570 µm in diameter, confined in Hele-Shaw cells that scale proportionally with d in all directions, are performed.
In these simulations we have introduced the larger density of glass, rather than polystyrene in order to minimize the numerical artifacts associated with
0 0.1 0.2 0.3 0.4 0.5 0 0.02 0.04 0.06 0.08 time (s) d < k > 0 0.1 0.2 0.3 0.4 0.5 0 2 4 6 8 10 < k > (1/cm) d = 70 µm d = 140 µm d = 210 µm d = 280 µm d = 350 µm d = 420 µm d = 490 µm (a) Simulation 0 0.1 0.2 0.3 0.4 0.5 0.6 0 0.02 0.04 0.06 0.08 time (s) d < k > 00 0.2 0.4 0.6 2 4 6 < k > (1/cm) d = 80 µm d = 140 µm d = 230 µm d = 570 µm (b) Experiment
Fig. 7. Data-collapse plot of dhki for a series of (a) simulations using glass beads, and (b) experiments using polystyrene beads. The grain diameters d are given in the legend box. The inset shows the evolution of the unscaled hki.
the solid fraction cutoff in the permeability. As the inertia of the grains de-creases the overestimated pressure forces in the dilute regions of the system will act even stronger on the falling granular fingers.
Data-collapse plots of the rescaled mean wave number dhki are shown in Figs. 7(a) (simulation) and 7(b) (experiment). These plots indicate that the characteristic size of the structures is invariant when size is measured in units of d; the number of grains that spans the width of the bubbles is the same for a wide range of grain sizes.
Theoretically, the scale invariance of the product dhki may be interpreted as follows: Compared to the other terms of Eqs. (1) and (3) the m dv/dt,
Granular Rayleigh-Taylor instability 9
FI and P ∇ · u terms may be shown to be small [20]. For that reason, these equations exhibit an approximate invariance under system size scaling. If we take δP to be the pressure deviation from the background pressure, express the velocity of grain i as vi = δvi+ u0 and the locally averaged granular velocity as u = δu + u0, where u0 is the constant sedimentation velocity of a close packed system, this scaling may be expressed as x → λx, δP → λδP , u0→ λ2
u0, δu → λδu and κ → λ2
κ, where λ is a scale factor. The structure formation of the system is governed by δu and, since this velocity scales the same way with λ as the length scales themselves, the evolution of any structure measured in units of d will be scale invariant. In particular this is true for the structures measured by the length 1/hki, and so dhki is scale invariant. However, the invariance deteriorates both when particle size is increased, and when it is decreased. In the first case, the relative effect of granular inertia is increased, in the second, the relative effect of the P ∇ · u term is increased.
The convergence of the numerical data-collapse in Fig. 7(a) is quite good. The deviation of the 70 µm curve for small t is probably explained by the increase in the relative importance of the P ∇ · u-term. The divergences of the 350, 420, and 490 µm curves for greater t in the same plot arise because the bubbles in the coarser packings disappear before they reach the surface due to the increase of u0with λ2
[20]. The experimental data in Fig. 7(b) have a wider distribution but collapses satisfactorily given the standard deviation error bars. The experimental data are obtained by averaging over three experiments for each diameter d. The standard deviation is calculated over a time window of 0.3 seconds. The accuracy of the experiments is at its lowest during the initial coarsening of the structures, but as the mean wave number stabilizes around 0.2 seconds the accuracy improves. Nevertheless, the data points are, with a few exceptions, within a distance of one standard deviation from one another. The loss of precision for small times is most likely caused by the inaccuracy involved with the manual rotation.
5 Conclusion
In conclusion, we have presented experimental and numerical results of a gravity-driven granular flow instability which is significantly different from its classical hydrodynamic analog. The simulations reproduce the characteristic shape and size of the experimentally observed structures and provide fine patterns in the early phase of the process that are not resolved experimentally. Data-collapse plots of the mean wave number hki indicate that the flow and the resulting structures are invariant when measured on a scale proportional to the grain diameter d for a range of diameters that spans from 70 µm to 570 µm.
References
1. H. J. Herrmann, J.-P. Hovi, and S. Luding, editors. Physics of Dry Granular Media, volume 350 of NATO ASI Series E: Applied Sciences, Dordrecht, 1998. Kluwer Academic Publishers.
2. D. Gendron, H. Troadec, K. J. Måløy, and E. G. Flekkøy. Bubble propagation in a pipe filled with sand. Phys. Rev. E, 64:021509, 2001.
3. D. Lohse, R. Rauhé, R. Bergmann, and D. van der Meer. Creating a dry variety of quicksand. Nature, 432(7018):689–690, December 2004.
4. C. Zeilstra, M. A. van der Hoef, and J. A. M. Kuipers. Simulation study of air-induced segregation of equal-sized bronze and glass particles. Phys. Rev. E, 74(1):010302(R), 2006.
5. G. Taylor. The instability of liquid surfaces when accelerated in a direction perpendicular to their planes. i. Proc. Roy. Soc. A, 201(1065):192–196, March 1950.
6. J. S. Langer. Instabilities and pattern formation in crystal growth. Rev. Mod. Phys., 52(1):1–28, Jan 1980.
7. Ø. Johnsen, R. Toussaint, K. J. Måløy, and E. G. Flekkøy. Pattern formation during air injection into granular materials confined in a circular hele-shaw cell. Phys. Rev. E, 74(1):011301, 2006.
8. C. Völtz, W. Pesch, and I. Rehberg. Rayleigh-taylor instability in a sedimenting suspension. Phys. Rev. E, 65:011404, December 2001.
9. J. L. Vinningland, Ø Johnsen, E. G. Flekkøy, R. Toussaint, and K. J. Måløy. Granular rayleigh-taylor instability: Experiments and simulations. Phys. Rev. Lett., 99(4):048001, 2007.
10. J. L. Vinningland, Ø. Johnsen, E. G. Flekkøy, R. Toussaint, and K. J. Måløy. Experiments and simulations of a gravitational granular flow instability. Phys. Rev. E, to appear.
11. S. McNamara, E. G. Flekkøy, and K. J. Måløy. Grains and gas flow: Molecular dynamics with hydrodynamic interactions. Phys. Rev. E, 61(4):4054–4059, 2000. 12. D.-V. Anghel, M. Strauß, S. McNamara, E. G. Flekkøy, and K. J. Måløy. Erra-tum: Grains and gas flow: Molecular dynamics with hydrodynamic interactions. Phys. Rev. E, 74(2):029906(E), 2006.
13. E. G. Flekkøy, S. McNamara, K. J. Måløy, and D. Gendron. Structure formation and instability in a tube of sand. Phys. Rev. Lett., 87(13):134302, 2001. 14. M. Strauß, S. McNamara, H. J. Herrmann, G. Niederreiter, and K. Sommer.
Plug conveying in a vertical tube. Powder Tech., 162:16, 2006.
15. E. G. Flekkøy, A. Malthe-Sørenssen, and B. Jamtveit. Modeling hydrofracture. J. Geophys. Res., 107 (B8)(2151), 2002.
16. H. Darcy. Les Fontaines Publiques de la Ville de Dijon. Dalmont and Paris, 1856.
17. P. C. Carman. Fluid flow through granular beds. Trans. Inst. Chem. Eng., 15:150–66, 1937.
18. F. Radjai, M. Jean, J.-J. Moreau, and S. Roux. Force distributions in dense two-dimensional granular systems. Phys. Rev. Lett., 77(2):274–277, 1996. 19. A. A. Zick and G. M. Homsy. Stokes-flow through periodic arrays of spheres.
J. Fluid Mech., 115:13–26, 1982.
20. J. L. Vinningland, Ø. Johnsen, E. G. Flekkøy, R. Toussaint, and K. J. Måløy. Size invariance in granular flows: simulation and experiment. unpublished.