HAL Id: hal-03196031
https://hal.archives-ouvertes.fr/hal-03196031
Submitted on 1 Jun 2021
HAL is a multi-disciplinary open access
archive for the deposit and dissemination of
sci-entific research documents, whether they are
pub-lished or not. The documents may come from
teaching and research institutions in France or
abroad, or from public or private research centers.
L’archive ouverte pluridisciplinaire HAL, est
destinée au dépôt et à la diffusion de documents
scientifiques de niveau recherche, publiés ou non,
émanant des établissements d’enseignement et de
recherche français ou étrangers, des laboratoires
publics ou privés.
Distributed under a Creative Commons Attribution - NonCommercial - NoDerivatives| 4.0
Altered visual processing in the mdx52 mouse model of
Duchenne muscular dystrophy
Mirella Telles Salgueiro Barboni, André Maurício Passos Liber, Anneka
Joachimsthaler, Amel Saoudi, Aurelie Goyenvalle, Alvaro Rendon, Jérôme E.
Roger, Dora Fix Ventura, Jan Kremers, Cyrille Vaillend
To cite this version:
Mirella Telles Salgueiro Barboni, André Maurício Passos Liber, Anneka Joachimsthaler, Amel Saoudi,
Aurelie Goyenvalle, et al.. Altered visual processing in the mdx52 mouse model of Duchenne muscular
dystrophy. Neurobiology of Disease, Elsevier, 2021, 152, pp.105288. �10.1016/j.nbd.2021.105288�.
�hal-03196031�
Neurobiology of Disease 152 (2021) 105288
Available online 5 February 2021
0969-9961/© 2021 The Authors. Published by Elsevier Inc. This is an open access article under the CC BY-NC-ND license
(http://creativecommons.org/licenses/by-nc-nd/4.0/).
Altered visual processing in the mdx52 mouse model of Duchenne
muscular dystrophy
Mirella Telles Salgueiro Barboni
a,b,1, Andr´e Maurício Passos Liber
b,1,
Anneka Joachimsthaler
c,d,1, Amel Saoudi
e,f, Aur´elie Goyenvalle
f, Alvaro Rendon
g, J´erome
E. Roger
h, Dora Fix Ventura
b, Jan Kremers
c,d,**,2, Cyrille Vaillend
e,*,2aDepartment of Ophthalmology, Semmelweis University, Budapest, Hungary bDepartment of Experimental Psychology, University of Sao Paulo, Sao Paulo, Brazil cSection for Retinal Physiology, University Hospital Erlangen, Erlangen, Germany dAnimal Physiology, Department of Biology, FAU Erlangen-Nürnberg, Erlangen, Germany
eUniversit´e Paris-Saclay, CNRS, Institut des Neurosciences Paris Saclay, 91190 Gif-sur-Yvette, France fUniversit´e de Versailles, St-Quentin, INSERM U1179, LIA BAHN CSM, Montigny-le-Bretonneux, France gDepartment of Therapeutics, Sorbonne University, Institut de la Vision, Paris, France
hParis-Saclay Institute of Neuroscience, CERTO-Retina France, CNRS, Universit´e Paris-Saclay, Orsay 91405, France
A R T I C L E I N F O Keywords: Retina Dystrophin Electroretinogram Photoreceptors B-wave
Duchenne muscular dystrophy Mouse model
Dp427 Dp260 Dp140
A B S T R A C T
The mdx52 mouse model of Duchenne muscular dystrophy (DMD) is lacking exon 52 of the DMD gene that is located in a hotspot mutation region causing cognitive deficits and retinal anomalies in DMD patients. This deletion leads to the loss of the dystrophin proteins, Dp427, Dp260 and Dp140, while Dp71 is preserved. The flash electroretinogram (ERG) in mdx52 mice was previously characterized by delayed dark-adapted b-waves. A detailed description of functional ERG changes and visual performances in mdx52 mice is, however, lacking. Here an extensive full-field ERG repertoire was applied in mdx52 mice and WT littermates to analyze retinal physiology in scotopic, mesopic and photopic conditions in response to flash, sawtooth and/or sinusoidal stimuli. Behavioral contrast sensitivity was assessed using quantitative optomotor response (OMR) to sinusoidally modulated luminance gratings at 100% or 50% contrast. The mdx52 mice exhibited reduced amplitudes and delayed implicit times in dark-adapted ERG flash responses, particularly in their b-wave and oscillatory poten-tials, and diminished amplitudes of light-adapted flash ERGs. ERG responses to sawtooth stimuli were also diminished and delayed for both mesopic and photopic conditions in mdx52 mice and the first harmonic am-plitudes to photopic sine-wave stimuli were smaller at all temporal frequencies. OMR indices were comparable between genotypes at 100% contrast but significantly reduced in mdx52 mice at 50% contrast. The complex ERG alterations and disturbed contrast vision in mdx52 mice include features observed in DMD patients and suggest altered photoreceptor-to-bipolar cell transmission possibly affecting contrast sensitivity. The mdx52 mouse is a relevant model to appraise the roles of retinal dystrophins and for preclinical studies related to DMD.
1. Introduction
Duchenne muscular dystrophy (DMD) is an X-linked neuromuscular disease affecting muscle tissues and the nervous system. It is due to a variety of genetic mutations (Koenig et al., 1987) that impede expression of several dystrophin-gene products (DMD gene, MIM: 300377)
expressed from independent internal promoters in a tissue and cell- specific manner (Fig. 1 A). Dystrophins are membrane-bound cytoskel-etal proteins known to play a central role in a scaffold of glycoproteins, the dystrophin-associated glycoprotein complex (DAGC). The DAGC includes the transmembrane dystroglycan complex, a receptor for extracellular-matrix proteins involved in the clustering of various
* Corresponding author at: Neuroscience Paris-Saclay Institute, Universit´e Paris Saclay, CNRS UMR9197, Bˆat. 446, rue Claude Bernard, 91405 Orsay cedex, France. ** Corresponding author at: Section for Retinal Physiology, University of Erlangen-Nuremberg, Germany.
E-mail addresses: [email protected] (J. Kremers), [email protected] (C. Vaillend).
1 M.T.S.B., A.M.P.L., and A.J. contributed equally to the paper. 2 J.K. and C.V. are equally responsible for the research work.
Contents lists available at ScienceDirect
Neurobiology of Disease
journal homepage: www.elsevier.com/locate/ynbdi
https://doi.org/10.1016/j.nbd.2021.105288
membrane receptors and ion channels, and key intracellular signaling proteins such as syntrophins (Pilgram et al., 2010; Waite et al., 2009).
The main clinical characteristic of DMD is a progressive muscular degeneration leading to premature death due to the loss of the full- length dystrophin protein (Dp427) (Hauser and Chamberlain, 1996; Hoffman et al., 1987). In addition, through non-invasive electroreti-nography (ERG) and behavioral measurements, it has been established that impaired cognitive performance, neurodevelopmental problems, altered retinal physiology, and altered contrast and color discrimination are characteristic of DMD (Ricotti et al., 2016b; Ricotti et al., 2016a; Snow et al., 2013). The severity of these non-muscle phenotypes in-creases as larger numbers of dystrophins (Dp427, Dp260, Dp140, and Dp71) expressed in the central nervous system (CNS) are affected by distal mutations (Daoud et al., 2008; Desguerre et al., 2009; Pillers et al., 1999a; Ricotti et al., 2016b; Taylor et al., 2010). DMD is therefore associated with heterogeneous and complex genotype-phenotype re-lationships depending on the mutation position, since distinct dystro-phins interact with different molecular partners in specific cell types throughout the CNS (Perronnet and Vaillend, 2010).
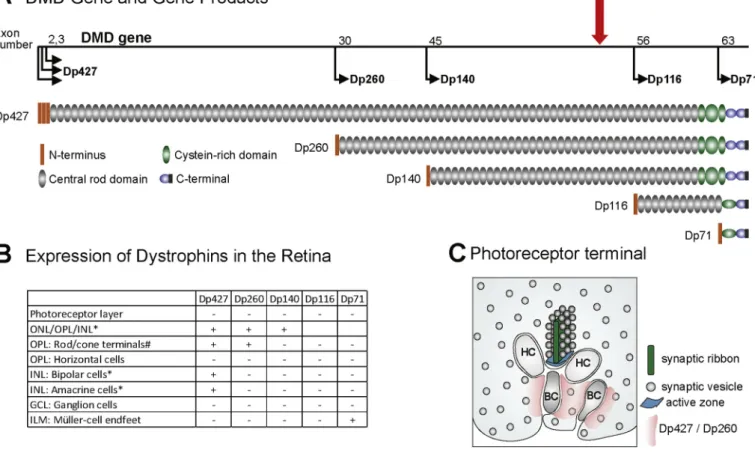
All known dystrophin proteins – except Dp116 – have been detected in various cell types and subcellular domains in the mouse retina (Fig. 1 B). The roles of dystrophins in retinal physiology however remain un-clear. The mRNAs coding for Dp427, Dp260, and Dp140 have all been detected in the outer nuclear and plexiform layers (ONL/OPL) and the Dp427 mRNA has been specifically detected in bipolar and amacrine
cells in the inner nuclear layer (INL) of the mouse retina (Wersinger et al., 2011). Both Dp427 and Dp260 proteins have been detected in photoreceptor terminals (Fig. 1 C). Dp260, a retina-specific dystrophin, is likely to contribute to signal transmission at the synapse between rod photoreceptors and depolarizing (On-) bipolar cells, whereas Dp427 is more strongly expressed in cone-associated synapses (Wersinger et al., 2011). The shortest dystrophin protein, Dp71, is involved in the clus-tering of the potassium Kir4.1 and aquaporin AQP4 channels in Müller glial-cell endfeet (Tadayoni et al., 2012). Interestingly, the severity of the ERG alterations, particularly leading to electronegative scotopic ERGs, varies depending on the mutation or deletion position in DMD patients (Pillers et al., 1999a; Ricotti et al., 2016a) and DMD mouse models (Bucher et al., 2019; Pillers et al., 1999b). In addition, alter-ations of the ERG correlate with the neurodevelopmental outcome (Ricotti et al., 2016a). Thus, the ERG may be regarded as a potential biomarker for assessing the severity of the neurological defects and their responsiveness to genetic therapies targeting the CNS.
The ERG is a well-recognized non-invasive tool used for clinical detection of retinopathies and experimental investigation of physio-logical processing in the retina, as well as of the effects of therapeutic interventions in animal models of human retinal disorders (Cuenca et al., 2014; Pardue and Peachey, 2014). ERG recordings in mice (Kremers and Tanimoto, 2018) allow a functional dissection of distinct retinal mechanisms such as the On- and Off-pathways in vivo (Barboni et al., 2020; Barboni et al., 2013; Tsai et al., 2016) and have been
Fig. 1. Schematic overview of DMD-gene products and their expression in the retina. (A) Genetic organization of the DMD-gene. The DMD gene (depicted by the
black line) contains 79 exons. The exon numbers above the gene indicate the first exons transcribed from alternative internal promoters and the thin black arrows show the transcription start sites and the resultant dystrophin proteins for each start site. The dystrophin proteins contain four subdivisions: An N-terminus, a spectrin-like central rod domain of variable size, a cysteine-rich domain and a C-terminus. The red arrow represents the position of exon-52 that is deleted in mdx52 mice. (B) A table summarizing the known sites of expression of dystrophins in the various retinal layers, cell-types, and/or subcellular domains. *: Detection of corresponding mRNA only. Dp427 was found proportionally more strongly expressed in cone- than in rod-associated synapses when compared with Dp260 ( Wer-singer et al., 2011). ONL: outer nuclear layer; OPL: outer plexiform layer; INL: inner nuclear layer; GCL: ganglion cell layer; ILM: inner limiting membrane. (C) Schematic representing the localization of Dp427 and/or Dp260 (pink) in photoreceptor terminals as suggested by others (adapted from Wersinger et al., 2011). HC: Horizontal-cell dendrites; BC: Bipolar-cell dendrites.
successfully applied to a variety of mouse models of retinal disorders (Collin et al., 2020).
In DMD mouse models, studies of electrophysiological dysfunction of the retina are still scarce and/or lack fine-level analyses of the involved cellular mechanisms. Our recent studies in mdx3Cv mice lacking all dystrophins (Tsai et al., 2016) and in Dp71-null mice lacking only Dp71 (Barboni et al., 2020) suggest that the profile of ERG alterations is more complex than the originally described changes in b:a-wave ratios. In both patients and mice, ERGs may also display hallmarks of specific defective cellular pathways, as also suggested by some of our studies with DMD patients (Barboni et al., 2016; Barboni et al., 2013).
A detailed study of the ERG defects caused by genetic alteration in a distal hotspot area between introns 43 and 55 is still missing, although they represent a large part (approximately 70% of exonic deletions) of the alterations occurring in the human DMD gene (Bladen et al., 2015; Juan-Mateu et al., 2015). These deletions are associated with a loss of several dystrophins (Dp427, Dp260 and Dp140). The same dystrophins are also missing in the exon 52-deficient mdx mouse model (mdx52) (Araki et al., 1997). A pioneering study of ERGs in mdx52 mice (Kameya et al., 1997) revealed the presence of delayed scotopic b-waves with normal amplitudes. This is at variance with the ERG deficits of patients bearing similar mutations, displaying not only delayed but also reduced b-wave amplitudes (De Becker et al., 1994; Girlanda et al., 1997; Ino-ue et al., 1997; Pascual Pascual et al., 1998; Pillers et al., 1999a; Ricotti et al., 2016a; Sigesmund et al., 1994).
In the present study, our main objectives were (1) to determine whether the study of retinal functions in mdx52 mice could support the current hypothesis that distal mutations affecting several dystrophins lead to a more severe deficit than proximal mutations and (2) to identify specific outcome measures that could be relevant for future preclinical studies. We aimed to obtain a full characterization of the ERG deficits in
mdx52 mice by recording an extensive ERG repertoire using a variety of
visual stimuli in scotopic, mesopic and photopic conditions, in order to probe the activity of different retinal cell populations and pathways. Moreover, optomotor response (OMR) measurements to sinusoidally modulated luminance gratings at 100% and 50% (Michelson) contrasts complemented the characterization of the visual phenotype in mdx52 mice.
We demonstrate that flash ERGs have reduced amplitudes and longer implicit times, but also more complex alterations of the a-waves, oscil-latory potentials, On- and Off-responses and responses to sinusoidal luminance modulation. Altered behavioral contrast sensitivity was also observed. We conclude that the mdx52 mouse displays some key visual features reported in DMD patients and may therefore represent an interesting model to investigate the pathophysiological mechanisms affected by the loss of CNS dystrophins and their response to gene therapies. Comparison of the ERG data with those obtained in other mouse models for DMD gives insight of the roles of the different dys-trophins in the physiology of the retina.
2. Material and methods
2.1. Animals
Exon 52-deleted X chromosome-linked muscular dystrophy mice (mdx52 mice) were produced by replacement of exon 52 of the DMD gene by the neomycin resistance gene, thereby eliminating expression of Dp427, Dp260 and Dp140 dystrophins but preserving expression of Dp116 (in peripheral nerves) and of Dp71 (in brain and retina) (Araki et al., 1997) (see Fig. 1 A). The mouse line was backcrossed with the C57BL/6 J strain for more than eight generations. Breeders were generously provided by Dr. Jun Tanihata and Dr. Shin’ichi Takeda (National Center of Neurology and Psychiatry, Tokyo, Japan). Hetero-zygous females were crossed with C57BL/6JRj male mice to generate
mdx52 and littermate control (WT) males in the animal facility of Neuro-
PSI at Universit´e Paris-Saclay in Orsay (France). The genotype was
determined by PCR analysis of tail DNA. The mice were kept under a standard 12-h light-dark cycle (light on 7.00 a.m.) with food and water ad libitum. ERG recordings were performed in young-adult mice at age 3–4 months (mdx52: 104.2 ± 22.8 days; WT littermates: 98.7 ± 19.3 days). All experiments adhered to the ARVO Statement for the Use of Animals in Ophthalmic and Vision Research and were conducted following the guidelines of the local mouse facility (agreement D91–471-104) in compliance with European Directive 2010/63/EU and French National Committee (87/848). The protocols were approved by the French Ethics Committee (Paris Centre et Sud, #59).
2.2. ERG recordings 2.2.1. Animal preparation
ERGs were recorded from 20 eyes of 10 mdx52 male mice and 12 eyes of six WT male littermates. Protocols and procedures have been described in detail elsewhere (Barboni et al., 2020; Tsai et al., 2016). Briefly, prior to testing, mice were dark-adapted for at least 12 h. Animal handling, preparation and electrode placement were performed under deep red illumination to keep the retina dark-adapted. Mice were anesthetized by an intramuscular injection of 25:5 mg/kg of 10% ke-tamine (keke-tamine 1000; Virbac, France), 2% xylazine (Rompun; Bayer Healthcare, Puteaux, France) in saline. During ERG recordings, the mice were positioned on a water-heated platform (38 ◦C) to maintain body
temperature during anesthesia. Subcutaneous injections of 0.9% saline (300 μl before recordings, 100 μl after recordings) were given to prevent
dehydration. Pupils were fully dilated using eye drops of 0.5% Tropi-camide (Mydriaticum; Thea, France) and 5% phenylephrine (Neo-synephrine FAURE; Europhta, Monaco) (1 drop each). To prevent corneal ulcerations and/or eye infection a drop of Tevemixine and N.A.C (TVM lab, France) was applied after ERG recordings. Contact lens electrodes (Ø 3.2 mm; Mayo Corporation, Inazawa, Japan) filled with Corneregel® (Dr. Mann Pharma, Berlin, Germany) were positioned on the corneas of the two eyes. They served as active electrodes. Two reference needle electrodes were placed subcutaneously medial to the two ears. A ground needle electrode was positioned subcutaneously at the base of the tail.
2.2.2. Apparatus and general conditions
Binocular recordings of full-field ERGs and stimulus presentations were controlled by a RetiPort system (Roland Consult, Brandenburg, Germany) using a Ganzfeld bowl (Q450SC, Roland Consult). All signals were amplified 100,000 times, band-pass filtered between 1 and 300 Hz, and digitized at a rate of 512 (flashes) or 2048 Hz (flicker). ERGs were measured in the order of increasing mean luminance to minimize the dark adaptation time interval to the following stimulus condition.
2.2.3. Scotopic flashes
Dark-adapted rod and mixed rod-cone mediated ERG responses were recorded to flashes of − 3.7, − 2.7, − 1.7, − 0.7, and 0.3 log cd.s/m2 (white light) strengths on a dark background. The number of repeats (sweeps) decreased with increasing flash strength (12, 10, 8, 8, and 4, respectively). The inter-stimulus interval was progressively increased with increasing flash strength (1, 2, 5, 10 and 20 s, respectively), thereby maintaining a dark-adapted state. Similarly, the interval between each condition increased from 10 to 120 s as the flash strength increased.
2.2.4. Mesopic responses to rapid-On and rapid-Off sawtooth stimuli
Rapid-On and -Off sawtooth stimuli, eliciting On- (to instantaneous luminance increments) and Off-responses (to instantaneous luminance decrements) respectively, were delivered at a mean luminance of 1 cd/ m2 (white light). The sawtooth was presented at 4 Hz (i.e. with a period
of 250 ms) and 100% luminance (Michelson) contrast. Before recording the On- and then the Off-responses, the mouse was adapted to the 1 cd/ m2 mean luminance for 2 min. Signals from the first two seconds after
sweeps of 1 s each were obtained.
2.2.5. Photopic flashes
0.3 log cd.s/m2 white flashes on a 25 cd/m2 white background were
delivered after a preadaptation period of 2 min. Twenty flashes with an inter-stimulus interval of 1 s were averaged.
2.2.6. Photopic sine-wave
After a preadaptation period of 2 min to 60 cd/m2 background,
si-nusoidal luminance modulation (100% Michelson contrast; 60 cd/m2
mean luminance, white light) at 10 temporal frequencies between 3 and 30 Hz were measured randomly. Averages of 20 sweeps, each lasting 1 s, were obtained. The first two seconds of recording were discarded to avoid onset artefacts.
Fig. 2. Dark- and light-adapted flash responses. (A) Average dark-adapted (scotopic) flash ERGs in WT (thin traces) and mdx52 mice (bold traces). (B) Mean (± one
standard deviation) amplitudes (μV; upper plots) and implicit times (ms; lower plots) of scotopic a- and b-waves, as indicated, in WT (open symbols) and mdx52 mice
(filled symbols). (C) Average OP traces isolated from the strongest scotopic flash (0.3 log cd.s/m2). (D) Mean (± one standard deviation) amplitude and implicit time
of OP3 as a function of flash intensity in WT (open symbols) and mdx52 (filled symbols) mice. (E) Averaged light-adapted (photopic) flash ERGs in WT (thin traces) and mdx52 mice (bold traces). (F) Histograms showing the mean (± one standard deviation) amplitude and implicit time of the photopic b-wave. Significant effects are marked with an asterisk (p < 0.05). Dotted lines in A, C and E show the physiological hallmarks used for measurement of response implicit times and/or amplitudes (see the Methods section for details). Recordings made in 20 eyes of 10 mdx52 mice and 12 eyes of 6 WT littermates.
2.2.7. Photopic On- and Off- sawtooth responses
Rapid-On and -Off sawtooth stimuli (white light) for incremental (On-) and decremental (Off-) responses were delivered with a mean luminance of 60 cd/m2. As in the mesopic condition, the temporal
profile was a 250 ms period (i.e. delivered at 4 Hz) with 100%
luminance contrast. Signals from the first two stimulus cycles were discarded to avoid onset artefacts. Averages of 40 episodes of 1 s each were obtained.
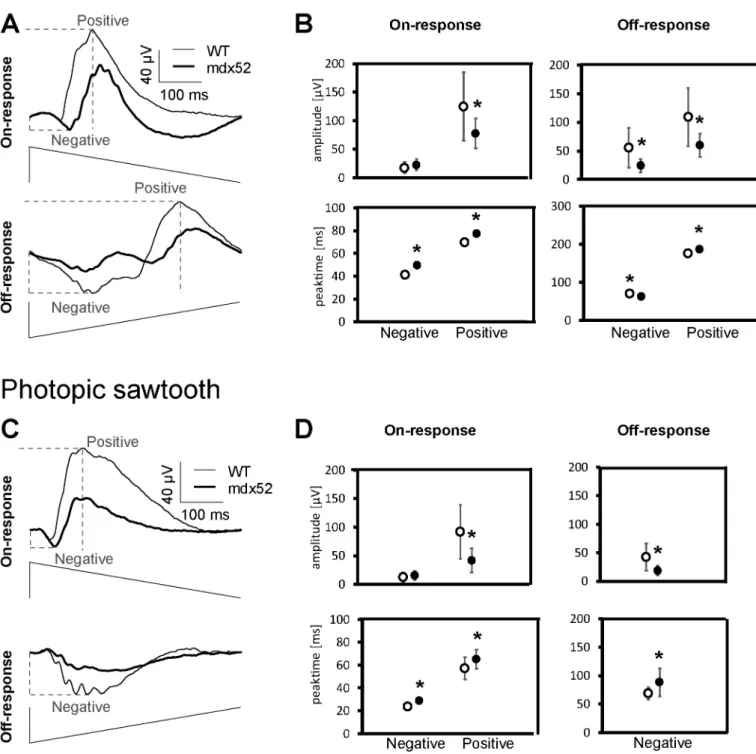
Fig. 3. Sawtooth On- and Off-responses. (A) Averaged responses of On- and Off-mediated mesopic ERG responses of mdx52 (bold traces) and WT (thin traces) mice.
Below the traces, representations of the luminance modulation for the rapid-On and the rapid-Off protocols are shown. (B) Mean (± one standard deviation) am-plitudes (μV; upper plots) and peak times (ms; lower plots) for the negative and positive components obtained with mesopic stimulation in WT (open symbols) and
mdx52 mice (filled symbols). (C) Averaged responses of On- and Off-mediated photopic ERG responses of mdx52 (bold traces) and WT (thin traces) mice. Below the
traces, representations of the average modulation for the rapid-On and the rapid-Off protocols are shown. (D) Mean (± one standard deviation) amplitudes (μV; upper
plots) and peak times (ms; lower plots) for the negative and positive components obtained with photopic stimulation in WT (open symbols) and mdx52 mice (filled symbols). All parameters, except the negative amplitude of the On-mediated response and the negative peak time of the Off-mediate response are significantly different between the groups (marked with an asterisk; p < 0.05). Dotted lines in A, C and E show the physiological hallmarks used for measurement of response implicit times and/or amplitudes (see the Methods section for details). Recordings made in 20 eyes of 10 mdx52 mice and 12 eyes of 6 WT littermates.
2.3. ERG signal processing
ERG components were analyzed offline by peak/trough detection, baseline measurements and Fourier analysis using self-written Matlab® routines (The Mathworks Inc., Natick, Massachusetts, United States) and Excel spreadsheets (Microsoft Office 2010, ©Microsoft Corporation, Redmond, WA, USA). The oscillatory potentials (OPs) were isolated and removed from the ERGs by a variable filter method (Harazny et al., 2009). ERGs without OPs were used to measure a- and b-wave param-eters. Isolated OPs were also obtained through the variable filter method and analyzed.
As shown in Fig. 2 A, the amplitude of the scotopic a-wave was defined as the difference in μV between the baseline (average of
re-cordings 17 ms before the occurrence of the flash) and the minimum within 50 ms after stimulus onset. The amplitude of the scotopic b-wave was the difference in μV between a-wave trough and the peak of the b-
wave. The implicit times corresponded to the intervals between the stimulus onset and the peaks of the a-wave and of the b-wave (shown as dotted lines in Fig. 2 A). We also analyzed the amplitudes and implicit times of OP2, OP3, and OP4, but quantitative data are only shown for the highest (OP3) in Fig. 2 D.
The b-waves of the light-adapted flash ERG were measured as above. In agreement with previous data (Barboni et al., 2020; Tsai et al., 2016) both the photopic a-waves and the photopic negative responses were found to be very small and, thus, were not included in the quantitative analyses.
For the On- and Off-ERGs (Fig. 3 A, C), the baseline was defined as the average of the first 5 ms of each response after the rapid luminance change. The first troughs were taken from baseline, with subsequent component amplitudes measured from the preceding peak or trough. Steady-state ERGs in response to sine-wave modulation were Fourier analyzed to obtain the amplitudes and phases of the first harmonic (fundamental) components. Noise was defined as the mean of the am-plitudes at the stimulus frequencies ±1 Hz. The first harmonic phase values were included in subsequent analyses only if the signal-to-noise ratio for the responses were equal to or larger than 2. The relationship between phases and temporal frequencies between 3 and 30 Hz were evaluated by calculating the slope of the corresponding linear regressions.
2.4. Optomotor response (OMR)
Real time video tracking and automated measurements of compen-satory head movements in freely moving mice were performed using an OMR recording setup (Phenosys, Berlin, Germany). Each mouse was freely moving and placed on a platform (5 cm in diameter) in the center of four computer controlled LCD monitors (for details see Kretschmer et al., 2013, 2015). Visual stimuli were sinusoidally modulated lumi-nance gratings generated by four LCD screens (60 Hz refresh rate; OkrArena, PhenoSys GmbH, Berlin, Germany), presented with a con-stant rotation. Video tracking considered the animal’s distance to the monitors, thereby keeping the spatial frequency of the retinal image constant and providing data for automated OMR quantifications.
OMRs were recorded using two different Michelson contrasts and different spatial frequencies (presented in random order) in two distinct cohorts of mice: 100% contrast (n = 8 mice per genotype) or 50% contrast (n = 10 mdx52 and 8 WT littermates). Similarly, as in the ERG recordings, the mice were 3–4 months of age. All stimuli were presented for 60 s randomly in either clockwise or counterclockwise direction. The measurements were completed in three trials for each animal, which we had previously validated as an optimal number of replicates to reduce the variability of individual’s scores. At 100% contrast, OMRs were recorded in response to sinusoidal gratings at 12 spatial frequencies between 0.0125 and 0.5 cycles per degree (cpd). At 50% contrast, si-nusoidal gratings were presented at 10 different spatial frequencies between 0.0125 and 0.4 cpd.
The number of head movements recorded at a speed range from 2 to 14 degrees per second in the same direction as the stimulus (nCorrect) and
in the opposite direction (nUncorrect) were used to calculate the OMR
indices (nCorrect / nUncorrect) at each spatial frequency.
2.5. Statistics
All ERG and OMR data were expressed as means ± standard devia-tion (for ERG) and ± standard error (for OMR). Genotype and group differences were analyzed using one or two-way ANOVAs depending on the presence of a within-subject repeated measure (strength, frequency). Univariate t-test was used to compare OMRs with baseline (test value = 1). p values <0.05 were considered statistically significant.
3. Results
3.1. Dark- and light-adapted flash ERGs
We first describe responses to flash stimuli in scotopic and photopic conditions to evaluate the integrity of rod, cone and bipolar cell- mediated retinal physiology in the conventional ERG, and of the retinal network that generates OPs (Frishman, 2006). Both dark-adapted (scotopic) and light-adapted (photopic) ERGs were altered in mdx52 mice compared with WT littermates. In the two genotypes, all tested stimulus strengths elicited a positive component (b-wave) in the dark- adapted flash ERG that dominated the responses, while a negative a- wave was detectable at flash strengths above − 1.7 log cd.s/m2 (Fig. 2 A).
The amplitudes of the a-waves (F(2,58) = 384.14; p < 0.001) and the b- waves (F(4,120) = 273.44; p < 0.001) of the dark-adapted flash ERGs increased with increasing flash strength responses in both genotypes. As shown in Fig. 2 B, the mean amplitudes of a-waves and b-waves (upper plots) were clearly reduced in mdx52 mice compared to WT mice (a- waves: genotype effect, F(1,29) = 9.66, p = 0.004; genotype x intensity interaction, F(2,58) = 5.79; p < 0.01; b waves: genotype effect, F(1,30) =36.95, p < 0.001; genotype x intensity interaction, F(4,120) = 7.29, p
< 0.001). Moreover, implicit times were significantly increased in mdx52 mice, for both the a-wave (genotype effect: F(1,30) = 19.71; p <
0.001; genotype x intensity interaction: F(2,60) = 21.87; p < 0.001) and the b-wave (genotype effect: (F(1,27) = 10.39, p < 0.01), with no sig-nificant genotype x intensity interaction: (F(4,108) = 0.95; p > 0.4). Additionally, the scotopic ERG in mdx52 mice showed a shoulder on the ascending limb of the b-wave at the highest flash strength (arrow in Fig. 2 A; upper plots), which was consistently found in all mdx52 mice but never observed in WT mice.
OPs were extracted from the response to brightest dark-adapted flash (0.3 log cd.s/m2) (Fig. 2 C–D). The amplitudes of all OPs were
drasti-cally reduced in mdx52 mice compared with WT (Fig. 2 C). As shown in Fig. 2 D, a quantitative analysis of the largest OP (OP3) confirmed the presence of significantly reduced amplitudes (genotype effect: F(1,30) =206.08; p < 0.001; genotype x intensity interaction: F(4,120) = 80.59; p < 0.001) and of an implicit time elongation in mdx52 mice (genotype effect: F(1,30) = 111,34; p < 0.001; genotype x intensity interaction: F (4,120) = 13.68; p < 0.001).
As shown in Fig. 2 E, the photopic b-wave amplitudes were signifi-cantly decreased in mdx52 mice (F(1,30) = 13.55; p < 0.01), while implicit times (Fig. 2 F) were comparable in the two genotypes (F(1,30) =3.34; p = 0.078).
This first set of stimulus protocols revealed a general reduction of amplitudes and longer implicit times in all retinal responses to flashes in
mdx52 mice.
3.2. Sawtooth On and Off ERGs
To further assess the integrity of the pathways involving On- and Off- bipolar cells that underlie the responses to luminance increases and decreases, we next describe the responses to mesopic and photopic
rapid-On and rapid-Off sawtooth stimuli. Mesopic On-responses (Fig. 3 A) exhibited an initial small negative component followed by a larger positive component. Mesopic Off-responses also displayed an initial negative deflection followed by a positive component. While the abso-lute amplitudes of the negative component of mesopic On-responses were similar in the two genotypes (F(1,30) = 1.86; p > 0.1), the positive-component amplitudes were significantly reduced in mdx52 compared to WT mice (Fig. 3 B, upper plots) (F(1,30) = 9.59; p < 0.01). Mesopic Off-response amplitudes were also reduced for both the nega-tive (F(1,30) = 13.89; p < 0.005) and posinega-tive (F(1,30) = 15.27; p < 0.001) components. Implicit times of the mesopic On-responses (Fig. 3 B, lower plots) were significantly longer in mdx52 mice compared to WT mice (negative component, F(1,30) = 12.02, p < 0.005; positive component, F(1,30) = 7.96, p < 0.01). Implicit times of mesopic Off- responses were also significantly different between genotypes. Howev-er, they were shorter in mdx52 mice for the negative component (F (1,30) = 7.96, p = 0.008) and longer for the positive component (F (1,30) = 12.72, p = 0.001).
Photopic On- and Off-responses are shown in Fig. 3 C–D. As in the mesopic condition, the photopic On-response exhibited an initial small negative component followed by a larger positive component. However, the implicit times of the photopic components were substantially shorter than those of the mesopic responses. In contrast, the photopic Off- response only displayed a negative component. As for the mesopic re-sponses, the amplitude of the negative component photopic On-response was similar in the two genotypes (F(1,30) = 0.748, p > 0.3), while its
positive component was significantly smaller in mdx52 mice (F(1,30) = 17.40; p < 0.001). The amplitude of the negative wavelet of the phot-opic Off-response was reduced in mdx52 mice (negative component F (1,30) = 16.64; p < 0.001). Implicit times of photopic sawtooth re-sponses (Fig. 3 D, lower plots) were all significantly increased in mdx52 mice (negative On-component: F(1,30) = 42.26, p < 0.001; positive On- component: F(1,30) = 5.74, p < 0.05; negative Off-component: F(1,30) =6.30; p < 0.05).
In conclusion, sawtooth stimuli elicited responses that were largely reduced in amplitude and delayed in implicit times in mdx52 mice.
3.3. ERGs to luminance sine-wave modulations
Sine-wave stimuli were used to test the post-receptoral cone-driven mechanisms that underlie temporal luminance processing. Responses to sine-wave modulation were used to analyze the first harmonic ampli-tudes and phases at 10 temporal frequencies from 3 to 30 Hz (Fig. 4 B). Mean amplitudes were reduced in mdx52 mice compared to WT mice (genotype effect: F(1,28) = 26.03; p < 0.001; genotype x frequency interaction: F(9,252) = 7.60; p < 0.001). The relationship between phases and frequency were approximately linear, indicating that the response phases are mainly determined by a delay. The slopes of the linear regressions through the phase data are proportional to the apparent delay. The slopes of the linear regressions were 23.9 degree/Hz for mdx52 and 24.5 degree/Hz for WT mice, corresponding to apparent delays of 66.46 ms and 68.14 ms, respectively.
Fig. 4. Responses to sine-wave stimuli. (A) Averaged responses of WT (thin traces, left) and mdx52 mice (bold traces, right) to sine-wave stimuli at 3, 8, 14 and 30
Hz. (B) Mean (± one standard deviation) first harmonic amplitudes (μV, top) and phases (degrees, bottom) as a function of temporal frequency between 3 and 30 Hz
in WT (open symbols) and mdx52 mice (filled symbols). Response amplitudes were different between groups at all frequencies (marked with an asterisk; genotype effect: p < 0.05; two-group comparisons: all p < 0.01), phases were similar in the two groups. Linear regressions to the phase data are shown for mdx52 (black line) and WT (dashed line) mice. Slopes of the linear regressions are 23.9 degree/Hz for mdx52 and 24.5 degree/Hz for WT mice corresponding to apparent delays of 66.46 ms and 68.14 ms, respectively. Recordings made in 20 eyes of 10 mdx52 mice and 12 eyes of 6 WT littermates.
Thus, mdx52 mice displayed major alterations in the ERG amplitudes in response to sine-wave stimuli without a change in the delays.
3.4. Optomotor response (OMR)
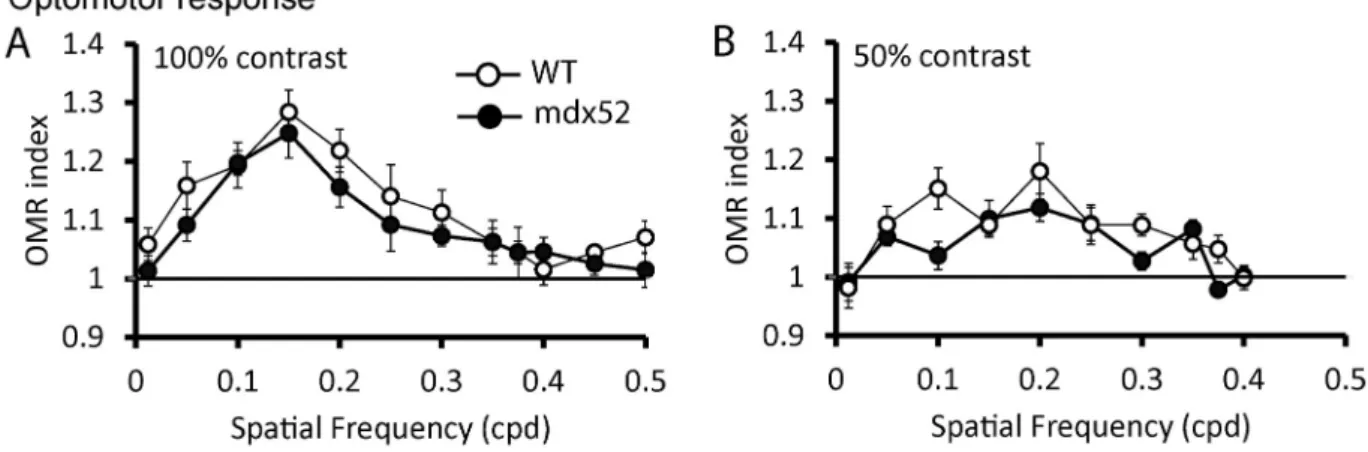
The optomotor response (OMR) to achromatic sinusoidal gratings was measured. OMR indices were obtained from three trials, averaged for each mouse and group means ± SEM were plotted as a function of spatial frequency (Fig. 5). Note that the OMR indices for both mdx52 and WT mice were higher at 100% contrast (Fig. 5A) than at 50% contrast (Fig. 5B), indicating a stronger reflex at 100% contrast.
We then compared if the OMR values differed in the two groups. We excluded the OMR values at those spatial frequencies where they did not differ (Univariate t-test) from a value of one in both groups, because a value of one indicates no specific response to the stimulus. Therefore, at 100% of contrast the values at 0.012, 0.375, 0.4, 0.45, and 0.5 cpd were not included in the statistical analysis, whereas at 50% contrast those at 0.012, 0.375, and 0.4 cpd were not used.
At 100% contrast, there was no significant difference between ge-notypes (genotype effect: F(1,14) = 3.291; p = 0.091; gege-notypes x fre-quencies interaction: F(6,84) = 0.300; p = 0.935), while OMR indices were significantly reduced in mdx52 mice compared to WT at 50% contrast (genotype effect: F(1,16) = 6.112; p = 0.025; genotypes x fre-quencies interaction: F(6,96) = 1.754; p = 0.117).
4. Discussion
The present report details the deficits in response to visual stimuli displayed by the mdx52 mouse, a DMD transgenic model holding a deletion in a hotspot region of the DMD gene. We found that the deletion of exon 52 in this mouse is associated with: i) dark-adapted (scotopic) responses with reduced amplitude and delayed implicit times, particu-larly affecting the b-waves and oscillatory potentials; ii) diminished light-adapted (photopic) flash ERG responses; iii) reduced amplitudes and/or delayed implicit times of On- and Off-responses in mesopic and photopic conditions; iv) lower amplitudes of the fundamental harmonic components in ERG responses to sine-wave luminance modulation; and v) lower OMR indices with 50% contrast stimuli. We thus demonstrate that the cumulative loss of Dp427, Dp260 and Dp140 in the mouse retina leads to a complex impaired visual phenotype.
4.1. Profile of ERG alterations in mdx52 mice
Our results indicate that both photoreceptor (the main contributor to the a-wave) and inner retina/bipolar cell (b-wave, OPs) functions are altered in scotopic conditions. Prolonged implicit times of the scotopic
b-wave were previously described in an ERG study in mdx52 mice, but no significant amplitude reduction was reported (Kameya et al., 1997). In contrast, the results of our present study clearly demonstrate the presence of reduced a- and b-wave- as well as OP-amplitudes. The contradictory findings might be due to differences in the ERG methods, related to the use of a short dark-adaptation time (30 min) in the study of Kameya et al. (Kameya et al., 1997) compared to the longer adaptation (overnight) in the present study. In mdx4Cv mice, a mouse model with a mutation in exon 53 disrupting expression of the same dystrophins as in the mdx52 mouse (Im et al., 1996), there was a trend toward a reduction in the b-wave amplitude (Pillers et al., 1999b). However, this reduction did not reach statistical significance, which might be attributable to the small number of recorded eyes (4–5 eyes). Furthermore, the authors used 5–6 months old mice and age effects on the ERGs cannot be excluded. Finally, they used congenic C57BL/6 mice as controls instead of littermates, making a comparison less straightforward.
Our data suggest that the prolonged implicit times of scotopic flash ERG responses, possibly reflecting a general delay in photoreceptor-to- bipolar cell transmission, are associated with the reduced amplitudes of the a- and b-waves and of the OPs. Reduced and delayed OPs may be a consequence of the changes in the signal transmission at the photore-ceptor synapses. However, they may also reflect additional disturbances in amacrine cell feedback interactions (Wachtmeister and Dowling, 1978), because the reduction in OP amplitudes is larger than the re-ductions of the a- and b-waves (cf. Fig. 2B and D). This would be in line with the detection of Dp427 mRNAs in mouse amacrine cells (Wersinger et al., 2011). The reduced photopic flash ERGs indicate that cone driven responses are also affected.
In addition to flash ERGs defects, mdx52 mice also showed dimin-ished On- and Off-mediated sawtooth responses in both mesopic and photopic conditions, suggesting that the On- and Off-cone pathways are also defective. The reduced amplitudes of photopic sine-wave flicker responses further support that cone-driven post-receptoral systems are altered in mdx52 mice. Furthermore, the phases in response to photopic sinusoidal stimuli were not altered indicating that, in contrast to the rod- driven pathways, cone-driven responses are not delayed. In agreement with this result, the implicit times in the photopic flashes were also not altered. The delay differences in the responses to the photopic sawtooth are relatively small and may suggest that the responses are partially still driven by rods. In conclusion, the loss of Dp427, Dp260 and Dp140 in
mdx52 mice results in a complex ERG phenotype characterized by
multiple alteration of retinal physiological mechanisms which are likely to involve dysfunctions of both rod and cone photoreceptors but also of the bipolar and amacrine cells connected to them. Moreover, we cannot exclude an additional or downstream functional change of ganglion cells, due to expression of Dp427 in these cells (Bucher et al., 2019) and/
Fig. 5. Optomotor response. The mean OMR indices (±SEM) are plotted as a function of spatial frequency for each genotype. The baseline (1; horizontal line)
represents unspecific head movements. OMR was measured in two distinct cohorts of mdx52 (filled symbols) and WT littermate mice (open symbols) at 100% contrast (A, n = 8 per genotype) and 50% contrast (B, n = 10 mdx52 and 8 WT littermate mice).
or due to secondary changes resulting from altered photoreceptor inputs.
4.2. Involvement of distinct retinal dystrophins in the mdx52 phenotype
The abnormal dark- and light-adapted flash ERGs observed in mdx52 mice indicate that part of the functional deficits may originate at the rod and cone synapses. This is in agreement with the finding that the absent dystrophins in this mouse model (Dp427, Dp260, and Dp140) are nor-mally expressed in the outer plexiform layer (OPL) of the retina ( Clau-depierre et al., 1999; Rodius et al., 1997; Wersinger et al., 2011). However, the precise localization of the different dystrophins in the retina still remains to be specified, as it is currently based on the detection of their specific mRNA and immunolocalization using pan- specific antibodies that may recognize several dystrophins, due to high sequence homology among the shorter C-terminal dystrophins (Dp260, Dp140, Dp71). The current knowledge on the main expression patterns of dystrophins in retina are summarized in Fig. 1 and detailed below. It appears that some dystrophins may be expressed in several retinal layers and/or cell types, but there is also evidence in other tissues that a given cell type may express several dystrophins (e.g., (Aranmolate et al., 2017)). Single-cell transcriptomic profiling may likely help to specify the expression patterns of retinal dystrophins. However, many conventional single-cell RNA-seq technologies still suffer from inherent limitations regarding cell capture efficiency and specificity, capacity to recover complete transcriptomes and reliability to detect low- abundance transcripts. Nonetheless, the recent developments in single- cell sequencing strategies, allowing RNA 5′ end or full-length
coverage, will be more suitable for identification of the unique tran-scription start-site and precise annotation of each dystrophin promoter, as well as for effective quantification of transcript levels (Adiconis et al., 2018; Hestand et al., 2010; Liu and Trapnell, 2016). It has been sug-gested that the differences between the broad expression patterns revealed by in situ hybridization and the rather localized expression of dystrophins using immunohistochemistry might be due to scaffolding and microdomain concentration of dystrophin proteins (Kameya et al., 1997). In this context, transcriptomic approaches should therefore be complemented by development of specific antibodies and/or proteomic analyses (Choi et al., 2020) to better define expression levels of the distinct dystrophins and their spatial distribution in retinal layers.
Nevertheless, the main dystrophin proteins detected in retina, Dp427, Dp260, Dp140 and Dp71 clearly show preferential expression in distinct cell types and/or subcellular domains of the retina (Fig. 1 B) and are likely to play distinct roles in retinal structure and/or physiology. Hence, we propose that the ERG alterations in the mdx52 model result from cumulative dysfunctions due to the absence of Dp427, Dp260 and Dp140. A previous histological examination of the mdx52 mouse retina revealed normally organized retinal cells in an orderly layered anatomical arrangement, similar to WT and mdx mice (Kameya et al., 1997). Punctate staining of β-dystroglycan, the transmembrane component of the complex associated with dystrophins, was detected in the OPL of WT and mdx mice, but was absent in the mdx52 OPL. This suggests an altered synaptic function between photoreceptors, bipolar and/or horizontal cells in mdx52 mice, in agreement with our present ERG data. Although this suggested that Dp260 and/or Dp140 are necessary for dystroglycan localization in the OPL, mGluR6 was not affected, implying that the loss of these dystrophins may affect genera-tion of the b-wave independently of accumulagenera-tion or maintenance of mGluR6. The selective roles of the distinct dystrophins in retinal phys-iology still remain to be specified, yet the localization of dystrophins in several cell types and the comparison of ERG phenotypes among specific DMD mouse model enable to propose working hypotheses.
Retinal Dp427 is found in the OPL of the mouse retina in a greater amount in cone terminals compared to rod terminals (Wersinger et al., 2011). Its mRNA was also detected in the INL, suggesting expression in amacrine and bipolar cells. Accordingly, the selective loss of Dp427 in
mdx mice affects the structure of the first synapse between
photore-ceptor and bipolar cells, but recent studies also suggest impaired func-tion of amacrine and ganglion cells (Catalani et al., 2020; Persiconi et al., 2020). Interestingly, mdx mice, at the same age as the mdx52 mice in the present study, show minor reductions of the amplitudes of scotopic a- and b-wave and minor changes in photopic conditions and in 30 Hz flicker responses (Bucher et al., 2019). Functional studies in mice older than 6 months are scarce and their interpretation may be biased by the progression of muscular dystrophy leading to the appearance of confounding factors that may also impact the CNS (for instance inflammation, presence of higher levels of blood-circulating enzymes that may degrade cell extracellular matrix). Thus, older mdx mice (>15 months old) show greater reduction in flash response amplitudes attributed to additional stressors like hypoxia, perhaps related to the absence of Dp427 in vascular smooth muscles (Bucher et al., 2019). However, the amplitude changes that we report here in mdx52 mice (between 35 and 60% for the b-wave and 20–55% for the a-wave) are much larger than in mdx mice (of maximally 23–26%). In conclusion, the selective absence of Dp427 in mdx mice during retinal development has a relatively small impact on its retinal physiology, leading to a phenotype that is substantially less severe than that found in the mdx52 mouse. However, we cannot rule out a putative contribution of Dp427 loss to the reduced OP amplitudes, due to amacrine cell dysfunction.
Dp260 is selectively expressed in the retina (D’Souza et al., 1995) and its expression level progressively increases during the synaptic maturation phase in the developing retina (Rodius et al., 1997). Conversely, this is the only dystrophin whose expression progressively decreases concomitantly with photoreceptor degeneration in the RCS rat model (Claudepierre et al., 1999), suggesting a key role for Dp260 in synaptogenesis. Accordingly, Dp260 was detected in the mouse OPL in both rod and cone ribbon synapses around the invaginated On-bipolar cell dendritic tips (Fig. 1 C) (Blank et al., 1999; Wersinger et al., 2011). Delayed b-waves and OPs have been reported in mdx2Cv mice lacking Dp427 and Dp260, but not in the Dp427-deficient mdx mouse, suggesting that increases in implicit times may be caused by Dp260 deficiency (Pillers et al., 1999a, 1999b). This may also explain the increased delays in the mdx52 mouse.
A trend toward reduced amplitude of flash ERG responses was pre-viously found in mdx2Cv (lacking Dp427 and Dp260) and mdx4Cv mice (lacking Dp427, Dp260 and Dp140). The changes in flash response amplitudes and implicit times were found to be comparable in the two mouse strains (Pillers et al., 1999b), suggesting that an additional loss of Dp140 does not aggravate the ERG alterations. In conclusion, these data support a main role for Dp260 but not for Dp140 in photoreceptor-to- bipolar cell transmission.
The role of Dp140 and its localization in the nervous system are poorly understood. Dp140 mRNA has been detected in the soma of photoreceptors, but no specific antibodies were available to determine protein expression at the cellular level. Moreover, it is possible that its expression is relatively low in adult tissue compared to other dystro-phins, as it has been mostly detected in CNS during embryonic devel-opment (Morris et al., 1995). As mentioned above, the flash ERGs of
mdx2Cv and mdx4Cv mice are comparable (Pillers et al., 1999b) sug-gesting a minor role of Dp140. However, in the present study we demonstrate significant changes in a-wave amplitude and implicit times that were not detected in the original study of mdx4Cv mice but sug-gesting that Dp140 may aggravate the consequences of Dp427 loss. Likewise, a putative role of Dp140 in the altered sawtooth and sine-wave responses observed in mdx52 mice cannot be ruled out. A more detailed ERG study in e.g. the mdx2Cv mice (which do not lack Dp140) will be helpful to test this hypothesis.
Interestingly, the scotopic ERG in mdx52 mice showed a shoulder on the ascending limb of the b-wave at the highest flash strength. This has also been reported in mouse models for congenital stationary night blindness (CSNB) with mutations in the CACNA1F gene in which the signal transmission in photoreceptor ribbon synapses is affected (Regus-
Leidig et al., 2014). This indicates that the physiological changes in the
mdx52 resembles those in the CSNB models.
Retinal Dp71 is selectively expressed in Müller glial cells and plays an important role in retinal homeostasis due to its functional in-teractions with aquaporin-4 water channels and Kir4.1 potassium channels (Tadayoni et al., 2012). We recently found that a selective loss of Dp71 causes subtle amplitude reductions of the b-wave in scotopic and photopic flash ERGs and of the photopic sine-wave and On- mediated sawtooth responses, with no change in implicit times ( Bar-boni et al., 2020). Interestingly, Dp71 is the only preserved dystrophin in the retina of mdx52 mice. A comparison of ERG defects in mdx52 mice and mdx3Cv mice lacking all dystrophins could be relevant to determine if the loss of Dp71 has a simple additive effect worsening the phenotype described here in mdx52 mice. However, comparisons suggest more complex genotype-phenotype relationships. For example, we have shown here the presence of reduced a-wave amplitudes in mdx52 mice, while this was not found in mdx3Cv mice. The light-adapted b-wave amplitudes were found to be reduced in mdx52 mice (present study), in Dp71-null mice (Barboni et al., 2020) and in mdx3Cv mice. Response delays of light-adapted b-waves were only observed in mdx3Cv mice (Tsai
et al., 2016), possibly as a result of the additional loss of Dp71 in these mice. In conclusion, there are some similarities, but also discrepancies between mdx52, Dp71-null and mdx3Cv mouse models, which do not favor the simple hypothesis that a cumulative loss of several dystrophins result in the addition of the effects induced by the loss of each dystro-phin. This suggests more complex functional relationships between retinal dystrophins: The cumulative loss of several dystrophins may aggravate some phenotypes but also lead to distinct patterns of ERG alterations.
4.3. Altered vision of contrasts in mdx52 mice
The innate optomotor response (OMR) to rotating sinusoidal lumi-nance gratings were comparable in mdx52 and WT mice at 100% contrast, but they were significantly reduced in mdx52 mice at 50% contrast. Interestingly, this appears to have some translational rele-vance, because the visual acuity measured with standard high-contrast optotypes is preserved in DMD patients, while threshold contrasts to static gratings was increased (Costa et al., 2011). Impaired functional autophagy has been recently observed in ganglion cells from mdx mice (Catalani et al., 2020), indicating that the photoreceptor/bipolar cell defects due to Dp427 loss are not compensated and may affect neural pathways involved in OMR and visual sensitivity. However, it must be taken into account that distinct neural pathways lead to an OMR and to visual contrast sensitivity.
This apparent alteration of visual contrast sensitivity should be taken into consideration in future behavioral studies, since it may slightly affect performance in some tasks involving orientation and/or decision based on the processing of visual cues. OMRs have not been studied in other mouse models of DMD. The present results should therefore be considered a starting point for future work on DMD mouse models, to study the effects of dystrophin absence on retinal and central visual pathways and for comparisons with data obtained from DMD patients.
4.4. Relevance of the mdx52 model for translational studies
Among DMD mouse models, the mdx3Cv mouse (Cox et al., 1993) has long been considered a standard model to study the effects of dystrophin down-regulation on retinal physiology (Pillers et al., 1995). The mdx3Cv mouse has a strongly reduced expression of all dystrophins due to a nonsense mutation in intron 65, and it displays a complex ERG pheno-type resembling that of most DMD patients (Pillers et al., 1999b; Pillers et al., 1995; Tsai et al., 2016). However, this mouse model does not represent the most prevalent genetic condition in DMD patients, where the more frequent mutations (50% of patients) are within exons 43–55. The mdx52 mouse, therefore, is likely a better model for DMD than the
the mdx3Cv mouse. Importantly, the expression of dystrophins is not completely disrupted in mdx3Cv mice because they show residual dys-trophin expression and reduced dysfunctions as compared to other models (Li et al., 2008; Vaillend and Ungerer, 1999). Moreover, the intronic mutation in mdx3Cv mice is not a target for genetic therapies based on exon-skipping strategies. On the other hand, mdx52 mice have a deletion of exon 52 and are therefore better suited for future preclin-ical studies (Miyatake et al., 2018; Mizobe et al., 2018). Importantly, functional and preclinical studies in DMD mouse models currently involve early treatment administration in immature animals followed by evaluation of outcome measures after an optimal therapeutic window of several weeks or months, that is, at the same adult age at which we observed ERG defects and altered contrast vision in the present study. Our detailed characterization of the mdx52 ERG phenotype may there-fore be essential when developing tools for the genetic restoration of dystrophin proteins in the CNS.
In face of these considerations it is important to compare ERG data from patients with those of DMD mouse models. In humans, specific ERG alterations have not yet been extensively correlated with specific dys-trophins expressed in the retina. Visual symptoms in DMD patients are less restrictive for daily routine than other limitations. However, increased life expectancy due to improved care and therapies of muscle dysfunction may increase the importance of concomitant treatment of retinopathies, as they may degrade progressively with age (Bucher et al., 2019).
The complex ERG phenotype of mdx52 mice includes key features previously observed in DMD patients lacking several dystrophins due to mutations in the central and distal parts of the DMD gene, particularly with regard to the reduced amplitude of the flash ERG responses ( Girl-anda et al., 1997; Ino-ue et al., 1997; Jensen et al., 1995; Pascual Pascual et al., 1998; Pillers et al., 1999a; Ricotti et al., 2016a; Sigesmund et al., 1994) and OP amplitudes (Tremblay et al., 1994). Similar to the findings in the mdx52 mice, flash a-waves are less affected than b-waves in DMD patients (Ricotti et al., 2016a). In contrast, DMD patients holding mu-tations that alter expression of Dp427, Dp260 and Dp140 (similar as in the mdx52 mouse), only show alterations in photopic On-responses (Barboni et al., 2013), whereas both photopic On- and Off-mediated ERG responses are affected in mdx52 mice.
As mentioned above, the reduced contrast sensitivity for OMR trig-gering in mdx52 mice may be compared with the reduced contrast sensitivity in DMD patients measured psychophysically (Barboni et al., 2013; Costa et al., 2011), even though OMRs and visual perception employ different neural pathways. To establish a better correlation be-tween data from patients and from mouse models of DMD, it will be interesting to perform OMR measurements in DMD patients for a direct comparison.
5. Conclusion
This study highlights the need to reappraise visual dysfunction in both patients and mouse models of DMD with new methods allowing the collection of a detailed repertoire of ERG parameters and of measure-ments of contrast sensitivity. This is required to achieve powerful comparisons aiming at specifying the complex genotype-phenotype re-lationships due to the loss of distinct dystrophins. We unveiled that the
mdx52 model displays a profile of ERG alterations that cannot be
inferred from previous studies in other mouse models of DMD. Our re-sults suggest complex functional relationships among retinal dystro-phins, where the cumulative loss of several dystrophins may aggravate some phenotypes but also lead to distinct patterns of ERG alterations. Importantly, the ERG profile of mdx52 mice includes key features observed in DMD patients, which may represent relevant outcome measures and indications of CNS dysfunction for future preclinical studies.
Funding sources
This study was supported by the Centre National de la Recherche Scientifique (CNRS), the Universit´e Paris-Sud (France), the DIM Gene Therapy Region Ile-de-France to JER, the Deutscher Akademischer Austauschdienst (DAAD #57513929) in Germany and Tempus Public Foundation in Hungary to JK and MTSB, the Sao Paulo Research Foundation (FAPESP # 2019/007771 to AMPL; 2016/04538–3 and 2014/26818–2 to DFV), the National Council for Scientific and Tech-nological Development (CNPq grant number 404239/2016–1 to MTSB), a project award from the Association Mon´egasque contre les Myopathies (AMM, Monaco) to CV, a National Research, Development, and Inno-vation Fund of Hungary OTKA (PD134799), a fellowship from Campus France (dossier 931,824 L) and a short-term scientific mission from COST Action CA17103 to MTSB and a CNPq 1A productivity fellowship (CNPq 309,409/2015–2) to DFV.
Declaration of Competing Interest
The authors declare no competing interests. Acknowledgements
We are grateful to Dr. Shin’ichi Takeda and Dr. Jun Tanihata (Na-tional Center of Neurology and Psychiatry, Tokyo, Japan) for kindly providing mdx52 mouse breeders. We also thank the Zootechnic plat-form of the Institut des Neurosciences Paris Saclay for mouse breeding, care and genotyping.
References
Adiconis, X., Haber, A.L., Simmons, S.K., Levy Moonshine, A., Ji, Z., Busby, M.A., Shi, X., Jacques, J., Lancaster, M.A., Pan, J.Q., Regev, A., Levin, J.Z., 2018. Comprehensive comparative analysis of 5′-end RNA-sequencing methods. Nat. Methods 15,
505–511. https://doi.org/10.1038/s41592-018-0014-2.
Araki, E., Nakamura, K., Nakao, K., Kameya, S., Kobayashi, O., Nonaka, I., Kobayashi, T., Katsuki, M., 1997. Targeted disruption of exon 52 in the mouse dystrophin gene induced muscle degeneration similar to that observed in Duchenne muscular dystrophy. Biochem. Biophys. Res. Commun. 238, 492–497. https://doi.org/ 10.1006/bbrc.1997.7328.
Aranmolate, A., Tse, N., Colognato, H., 2017. Myelination is delayed during postnatal brain development in the mdx mouse model of Duchenne muscular dystrophy. BMC Neurosci. 18, 63. https://doi.org/10.1186/s12868-017-0381-0.
Barboni, M.T.S., Nagy, B.V., de Araújo Moura, A.L., Damico, F.M., da Costa, M.F., Kremers, J., Ventura, D.F., 2013. ON and OFF electroretinography and contrast sensitivity in Duchenne muscular dystrophy. Invest. Ophthalmol. Vis. Sci. 54, 3195–3204. https://doi.org/10.1167/iovs.13-11700.
Barboni, M.T.S., Martins, C.M.G., Nagy, B.V., Tsai, T., Damico, F.M., da Costa, M.F., de Cassia, R., Pavanello, M., Lourenço, N.C.V., de Cerqueira, A.M.P., Zatz, M., Kremers, J., Ventura, D.F., 2016. Dystrophin is required for proper functioning of luminance and red-Green cone opponent mechanisms in the human retina. Invest. Ophthalmol. Vis. Sci. 57, 3581–3587. https://doi.org/10.1167/iovs.16-19287. Barboni, M.T.S., Vaillend, C., Joachimsthaler, A., Liber, A.M.P., Khabou, H., Roux, M.J.,
Vacca, O., Vignaud, L., Dalkara, D., Guillonneau, X., Ventura, D.F., Rendon, A., Kremers, J., 2020. Rescue of Defective Electroretinographic Responses in Dp71-null mice with AAV-mediated Reexpression of Dp71. Invest. Ophthalmol. Vis. Sci. 61, 11. https://doi.org/10.1167/iovs.61.2.11.
Bladen, C.L., Salgado, D., Monges, S., Foncuberta, M.E., Kekou, K., Kosma, K., Dawkins, H., Lamont, L., Roy, A.J., Chamova, T., Guergueltcheva, V., Chan, S., Korngut, L., Campbell, C., Dai, Y., Wang, J., Bariˇsi´c, N., Brabec, P., Lahdetie, J., Walter, M.C., Schreiber-Katz, O., Karcagi, V., Garami, M., Viswanathan, V., Bayat, F., Buccella, F., Kimura, E., Koeks, Z., van den Bergen, J.C., Rodrigues, M., Roxburgh, R., Lusakowska, A., Kostera-Pruszczyk, A., Zimowski, J., Santos, R., Neagu, E., Artemieva, S., Rasic, V.M., Vojinovic, D., Posada, M., Bloetzer, C., Jeannet, P.-Y., Joncourt, F., Díaz-Manera, J., Gallardo, E., Karaduman, A.A., Topalo˘glu, H., El Sherif, R., Stringer, A., Shatillo, A.V., Martin, A.S., Peay, H.L., Bellgard, M.I., Kirschner, J., Flanigan, K.M., Straub, V., Bushby, K., Verschuuren, J., Aartsma-Rus, A., B´eroud, C., Lochmüller, H., 2015. The TREAT-NMD DMD global database: analysis of more than 7,000 Duchenne muscular dystrophy mutations. Hum. Mutat. 36, 395–402. https://doi.org/10.1002/humu.22758.
Blank, M., Koulen, P., Blake, D.J., Kr¨oger, S., 1999. Dystrophin and beta-dystroglycan in photoreceptor terminals from normal and mdx3Cv mouse retinae. Eur. J. Neurosci. 11, 2121–2133. https://doi.org/10.1046/j.1460-9568.1999.00636.x.
Bucher, F., Friedlander, M.S., Aguilar, E., Kurihara, T., Krohne, T.U., Usui, Y., Friedlander, M., 2019. The long dystrophin gene product Dp427 modulates retinal function and vascular morphology in response to age and retinal ischemia. Neurochem. Int. 104489 https://doi.org/10.1016/j.neuint.2019.104489.
Catalani, E., Bongiorni, S., Taddei, A.R., Mezzetti, M., Silvestri, F., Coazzoli, M., Zecchini, S., Giovarelli, M., Perrotta, C., De Palma, C., Clementi, E., Ceci, M., Prantera, G., Cervia, D., 2020. Defects of full-length dystrophin trigger retinal neuron damage and synapse alterations by disrupting functional autophagy. Cell. Mol. Life Sci. https://doi.org/10.1007/s00018-020-03598-5.
Choi, J.R., Yong, K.W., Choi, J.Y., Cowie, A.C., 2020. Single-cell RNA sequencing and its combination with protein and DNA analyses. Cells 9. https://doi.org/10.3390/ cells9051130.
Claudepierre, T., Rodius, F., Frasson, M., Fontaine, V., Picaud, S., Dreyfus, H., Mornet, D., Rendon, A., 1999. Differential distribution of dystrophins in rat retina. Invest. Ophthalmol. Vis. Sci. 40, 1520–1529.
Collin, G.B., Gogna, N., Chang, B., Damkham, N., Pinkney, J., Hyde, L.F., Stone, L., Naggert, J.K., Nishina, P.M., Krebs, M.P., 2020. Mouse models of inherited retinal degeneration with photoreceptor cell loss. Cells 9. https://doi.org/10.3390/ cells9040931.
Costa, M.F., Barboni, M.T.S., Ventura, D.F., 2011. Psychophysical measurements of luminance and chromatic spatial and temporal contrast sensitivity in Duchenne muscular dystrophy. Psychology & Neurosci. 4, 67–74. https://doi.org/ 10.3922/j.psns.2011.1.008.
Cox, G.A., Phelps, S.F., Chapman, V.M., Chamberlain, J.S., 1993. New mdx mutation disrupts expression of muscle and nonmuscle isoforms of dystrophin. Nat. Genet. 4, 87–93. https://doi.org/10.1038/ng0593-87.
Cuenca, N., Fern´andez-S´anchez, L., Campello, L., Maneu, V., De la Villa, P., Lax, P., Pinilla, I., 2014. Cellular responses following retinal injuries and therapeutic approaches for neurodegenerative diseases. Prog. Retin. Eye Res. 43, 17–75. https:// doi.org/10.1016/j.preteyeres.2014.07.001.
Daoud, F., Candelario-Martínez, A., Billard, J.-M., Avital, A., Khelfaoui, M.,
Rozenvald, Y., Guegan, M., Mornet, D., Jaillard, D., Nudel, U., Chelly, J., Martínez- Rojas, D., Laroche, S., Yaffe, D., Vaillend, C., 2008. Role of mental retardation- associated dystrophin-gene product Dp71 in excitatory synapse organization, synaptic plasticity and behavioral functions. PLoS One 4, e6574. https://doi.org/ 10.1371/journal.pone.0006574.
De Becker, I., Riddell, D.C., Dooley, J.M., Tremblay, F., 1994. Correlation between electroretinogram findings and molecular analysis in the Duchenne muscular dystrophy phenotype. Br. J. Ophthalmol. 78, 719–722. https://doi.org/10.1136/ bjo.78.9.719.
Desguerre, I., Christov, C., Mayer, M., Zeller, R., Becane, H.-M., Bastuji-Garin, S., Leturcq, F., Chiron, C., Chelly, J., Gherardi, R.K., 2009. Clinical heterogeneity of duchenne muscular dystrophy (DMD): definition of sub-phenotypes and predictive criteria by long-term follow-up. PLoS One 4, e4347. https://doi.org/10.1371/ journal.pone.0004347.
D’Souza, V.N., Nguyen, T.M., Morris, G.E., Karges, W., Pillers, D.A., Ray, P.N., 1995. A novel dystrophin isoform is required for normal retinal electrophysiology. Hum. Mol. Genet. 4, 837–842. https://doi.org/10.1093/hmg/4.5.837.
Frishman, L.J., 2006. Origins of the Electroretinogram, in: Principles and Practice of Clinical Electrophysiology of Vision. MIT Press, Cambridge, pp. 139–183. Girlanda, P., Quartarone, A., Buceti, R., Sinicropi, S., Macaione, V., Saad, F.A.,
Messina, L., Danieli, G.A., Ferreri, G., Vita, G., 1997. Extra-muscle involvement in dystrophinopathies: an electroretinography and evoked potential study. J. Neurol. Sci. 146, 127–132. https://doi.org/10.1016/s0022-510x(96)00292-4.
Harazny, J., Scholz, M., Buder, T., Lausen, B., Kremers, J., 2009. Electrophysiological deficits in the retina of the DBA/2J mouse. Doc. Ophthalmol. 119, 181–197. https:// doi.org/10.1007/s10633-009-9194-5.
Hauser, M.A., Chamberlain, J.S., 1996. Progress towards gene therapy for Duchenne muscular dystrophy. J. Endocrinol. 149, 373–378.
Hestand, M.S., Klingenhoff, A., Scherf, M., Ariyurek, Y., Ramos, Y., van Workum, W., Suzuki, M., Werner, T., van Ommen, G.-J.B., den Dunnen, J.T., Harbers, M., ‘t Hoen, P.A.C., 2010. Tissue-specific transcript annotation and expression profiling with complementary next-generation sequencing technologies. Nucleic Acids Res. 38, e165 https://doi.org/10.1093/nar/gkq602.
Hoffman, E.P., Brown, R.H., Kunkel, L.M., 1987. Dystrophin: the protein product of the Duchenne muscular dystrophy locus. Cell 51, 919–928.
Im, W.B., Phelps, S.F., Copen, E.H., Adams, E.G., Slightom, J.L., Chamberlain, J.S., 1996. Differential expression of dystrophin isoforms in strains of mdx mice with different mutations. Hum. Mol. Genet. 5, 1149–1153. https://doi.org/10.1093/hmg/ 5.8.1149.
Ino-ue, M., Honda, S., Nishio, H., Matsuo, M., Nakamura, H., Yamamoto, M., 1997. Genotype and electroretinal heterogeneity in Duchenne muscular dystrophy. Exp. Eye Res. 65, 861–864. https://doi.org/10.1006/exer.1997.0389.
Jensen, H., Warburg, M., Sj¨o, O., Schwartz, M., 1995. Duchenne muscular dystrophy: negative electroretinograms and normal dark adaptation. Reappraisal of assignment of X linked incomplete congenital stationary night blindness. J. Med. Genet. 32, 348–351. https://doi.org/10.1136/jmg.32.5.348.
Juan-Mateu, J., Gonzalez-Quereda, L., Rodriguez, M.J., Baena, M., Verdura, E., Nascimento, A., Ortez, C., Baiget, M., Gallano, P., 2015. DMD mutations in 576 Dystrophinopathy families: a step forward in genotype-phenotype correlations. PLoS One 10, e0135189. https://doi.org/10.1371/journal.pone.0135189.
Kameya, S., Araki, E., Katsuki, M., Mizota, A., Adachi, E., Nakahara, K., Nonaka, I., Sakuragi, S., Takeda, S., Nabeshima, Y., 1997. Dp260 disrupted mice revealed prolonged implicit time of the b-wave in ERG and loss of accumulation of beta- dystroglycan in the outer plexiform layer of the retina. Hum. Mol. Genet. 6, 2195–2203.
Koenig, M., Hoffman, E.P., Bertelson, C.J., Monaco, A.P., Feener, C., Kunkel, L.M., 1987. Complete cloning of the Duchenne muscular dystrophy (DMD) cDNA and preliminary genomic organization of the DMD gene in normal and affected individuals. Cell 50, 509–517.